. 2022 May 18;10(5):1044.
doi: 10.3390/microorganisms10051044.

Gut Microbiota Associated with Clinical Relapse in Patients with Quiescent Ulcerative Colitis

Affiliations

Gut Microbiota Associated with Clinical Relapse in Patients with Quiescent Ulcerative Colitis

Hiroaki Kitae et al. Microorganisms. .

Abstract

The microbiota associated with relapse in patients with quiescent ulcerative colitis (qUC) remains unclear. Our objective was to analyze the fecal microbiota of Japanese patients with qUC and identify the relapse-associated microbiota. In this study, 59 patients with qUC and 59 healthy controls (HCs) were enrolled (UMIN 000019486), and their fecal microbiota was compared using 16S rRNA gene amplicon sequencing. We followed their clinical course up to 3.5 years and analyzed the relapse-associated microbiota. Potential functional changes in the fecal microbiota were evaluated using PICRUSt software and the Kyoto Encyclopedia of Genes and Genomes database. There were significant differences in fecal microbiota diversity between HC and qUC subjects, with 13 taxa characterizing each subject. Despite no significant difference in variation of microbiota in a single sample (α diversity) between patients in sustained remission and relapsed patients, the variation in microbial communities between samples (β diversity) was significantly different. Prevotella was more abundant in the sustained remission patients, whereas Faecalibacterium and Bifidobacterium were more abundant in the relapsed patients. We clustered the entire cohort into four clusters, and Kaplan-Meier analysis revealed the subsequent clinical course of each cluster was different. We identified 48 metabolic pathways associated with each cluster using linear discriminant analysis effect size. We confirmed the difference in microbiota between patients with qUC and HCs and identified three genera associated with relapse. We found that the clusters based on these genera had different subsequent clinical courses and activated different metabolic pathways.

Keywords: LEfSe; fecal microbiota; quiescent ulcerative colitis; ulcerative colitis relapse.


Conflict of interest statement

Tomohisa Takagi received lecture fees from Yanssen Pharmaceutical K.K., Mitsubishi Tanabe Pharma Co., and Mochida Pharmaceutical Co., Ltd. Yuji Naito received research grants from EA Pharma Co., Ltd. and research funding from Fujifilm Medical Co., Ltd. Yoshito Itoh received lecture fees from Merck Sharp and Dohme, Gilead Sciences Inc., and AbbVie Inc., and received research grants from Merck Sharp and Dohme, Bristol-Myers Squibb Company, Gilead Sciences Inc., AbbVie GK., Eisai Co., Ltd., Astellas Pharma Inc., and Takeda Pharmaceutical Company Limited., EA pharm CO., LTD., Bayer AG, Novo Nordisk Pharma Ltd., Nissan Chemical Industries, LTD., and received endowed courses from Nichinichi Pharmaceutical CO., LTD. The other authors have no conflicts of interest to declare.

Figures
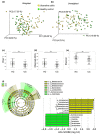
Figure 1
Figure 1
Comparison of the structure of gut microbiota between healthy controls (HCs) and patients with ulcerative colitis (UC). Principal coordinate analysis (PCoA) plots of gut microbiota based on (a) weighted and (b) unweighted UniFrac distances as β-diversity was calculated (PERMANOVA, p < 0.01). Yellow dots indicate patients with UC and green dots indicate HCs; As for α-diversity, (c) Chao 1 (ASV richness estimation); (d) observed ASVs; (e) Shannon (ASV evenness estimation) indices were significantly lower in patients with UC than those in HCs; (f) linear discriminant analysis effect size (LEfSe) analysis identified taxa that characterized each group. Cladogram of LEfSe analysis results. Yellow-shaded areas indicate taxa that characterize UC, and green-shaded areas indicate taxa that characterize HCs. Linear discriminant analysis (LDA) scores for identified taxa of patient of UCs (7 taxa) and HC (6 taxa) was shown. ** p < 0.01.
Figure 2
Figure 2
Comparison of the structure of gut microbiota between quiescent ulcerative colitis patients who sustained remission and relapsed: (a) Kaplan–Meier curve for sustained remission showed about 30% relapse in up to 3.5 years in the clinical course of quiescent ulcerative colitis patients. Principal coordinate analysis (PCoA) plots of gut microbiota based on (b) weighted and (c) unweighted UniFrac distances; (d) Chao 1 (ASV richness estimation); (e) observed ASVs; (f) Shannon (ASV evenness estimation) indices as α-diversity indices did not differ between sustained remission (SusRem) and relapsed subjects (Relapse); (g) linear discriminant analysis effect size (LEfSe) analysis identified taxa that characterized each group. Cladogram of LEfSe analysis results. Red-shaded areas indicate taxa that characterize relapse group, and blue-shaded areas indicate taxa that characterize SusRem group. Linear discriminant analysis (LDA) scores for identified taxa of SusRem (2 taxa) and Relapse (6 taxa) are shown.
Figure 3
Figure 3
Comparison of predictors of ulcerative colitis relapse and clustering analysis based on the three genera, and their prognosis for relapse: (a) the receiver operating characteristics (ROC) curves based on multivariate logistic regression analysis with the abundance of Prevotella, Faecalibacterium, Bifidobacterium and based on univariate logistic regression analysis with each genus; (b) clustering analysis for the whole cohort, including quiescent ulcerative colitis patients and healthy controls via Ward’s hierarchical method based on the abundance of Prevotella, Faecalibacterium, and Bifidobacterium. In the upper section, green indicates healthy subjects, yellow indicates relapsed patients with ulcerative colitis, and purple indicates SusRem patients with ulcerative colitis. In the lower section, the abundance of each genus is indicated by color change, with red indicating high abundance and blue low abundance; (c) Kaplan–Meier analysis according to four clusters (Prevotella-rich, Faecalibacterium-rich, Bifidobacterium-rich, and other clusters) and log-rank test showing differences in the clinical course of each cluster. SusRem, sustained remission; Prevo., Prevotella; Faecali., Faecalibacterium; Bifido., Bifidobacterium.
Figure 4
Figure 4
Pathway analysis based on identified clusters. Linear discriminant analysis effect size (LEfSe) analysis identified the assumed activated Kyoto Encyclopedia of Genes and Genomes (KEGG) metabolic pathways that characterized each cluster: (a) linear discriminant analysis (LDA) scores for identified metabolic pathways of the Prevotella-rich cluster (20 pathways), the Faecalibacterium-rich cluster (11 pathways), and the Bifidobacterium-rich cluster (16 pathways). Purple indicates Prevotella-rich cluster, blue indicates “Other” cluster, green indicates Faecalibacterium-rich cluster, and red indicates Bifidobacterium-rich cluster; (b) cladogram of LEfSe analysis results. This is a circular tree diagram representing the hierarchical categories of KEGG metabolic pathways, with each yellow dot representing a pathway identified in this analysis. The regions that characterize each cluster are shaded with the color of the cluster.

References

    1. Lynch S.V., Pedersen O. The Human Intestinal Microbiome in Health and Disease. N. Engl. J. Med. 2016;375:2369–2379. doi: 10.1056/NEJMra1600266. - DOI - PubMed
    1. Takagi T., Naito Y., Inoue R., Kashiwagi S., Uchiyama K., Mizushima K., Tsuchiya S., Dohi O., Yoshida N., Kamada K., et al. Differences in Gut Microbiota Associated with Age, Sex, and Stool Consistency in Healthy Japanese Subjects. J. Gastroenterol. 2019;54:53–63. doi: 10.1007/s00535-018-1488-5. - DOI - PubMed
    1. Sheehan D., Moran C., Shanahan F. The Microbiota in Inflammatory Bowel Disease. J. Gastroenterol. 2015;50:495–507. doi: 10.1007/s00535-015-1064-1. - DOI - PubMed
    1. Nishida A., Inoue R., Inatomi O., Bamba S., Naito Y., Andoh A. Gut Microbiota in the Pathogenesis of Inflammatory Bowel Disease. Clin. J. Gastroenterol. 2018;11:1–10. doi: 10.1007/s12328-017-0813-5. - DOI - PubMed
    1. Frank D.N., St Amand A.L., Feldman R.A., Boedeker E.C., Harpaz N., Pace N.R. Molecular-Phylogenetic Characterization of Microbial Community Imbalances in Human Inflammatory Bowel Diseases. Proc. Natl. Acad. Sci. USA. 2007;104:13780–13785. doi: 10.1073/pnas.0706625104. - DOI - PMC - PubMed

LinkOut - more resources