. 2022 May 13;27(10):3141.
doi: 10.3390/molecules27103141.

The Relationship between the IC50 Values and the Apparent Inhibition Constant in the Study of Inhibitors of Tyrosinase Diphenolase Activity Helps Confirm the Mechanism of Inhibition

Affiliations

The Relationship between the IC50 Values and the Apparent Inhibition Constant in the Study of Inhibitors of Tyrosinase Diphenolase Activity Helps Confirm the Mechanism of Inhibition

Pablo Garcia-Molina et al. Molecules. .

Abstract

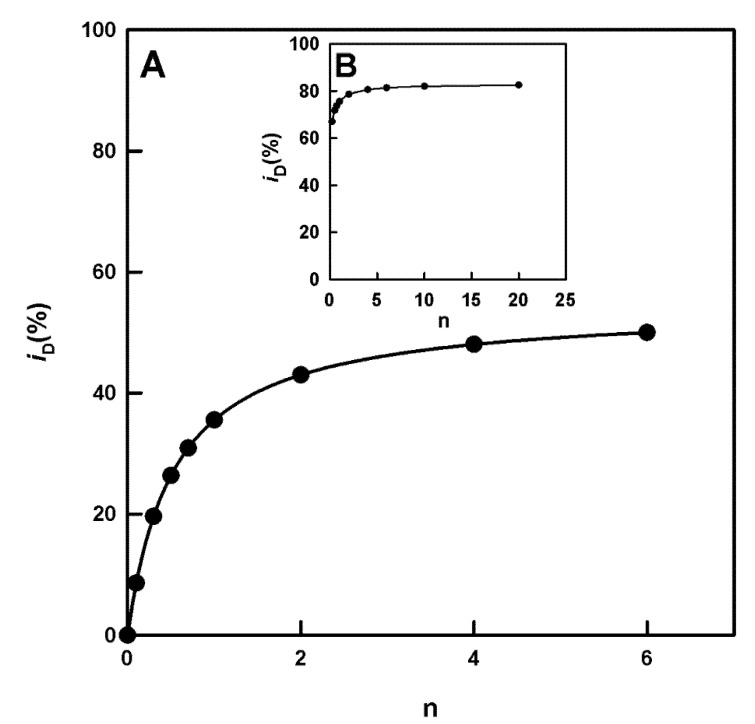
Tyrosinase is the enzyme involved in melanization and is also responsible for the browning of fruits and vegetables. Control of its activity can be carried out using inhibitors, which is interesting in terms of quantitatively understanding the action of these regulators. In the study of the inhibition of the diphenolase activity of tyrosinase, it is intriguing to know the strength and type of inhibition. The strength is indicated by the value of the inhibition constant(s), and the type can be, in a first approximation: competitive, non-competitive, uncompetitive and mixed. In this work, it is proposed to calculate the degree of inhibition (iD), varying the concentration of inhibitor to a fixed concentration of substrate, L-dopa (D). The non-linear regression adjustment of iD with respect to the initial inhibitor concentration [I]0 allows for the calculation of the inhibitor concentration necessary to inhibit the activity by 50%, at a given substrate concentration (IC50), thus avoiding making interpolations between different values of iD. The analytical expression of the IC50, for the different types of inhibition, are related to the apparent inhibition constant (KIapp). Therefore, this parameter can be used: (a) To classify a series of inhibitors of an enzyme by their power. Determining these values at a fixed substrate concentration, the lower IC50, the more potent the inhibitor. (b) Checking an inhibitor for which the type and the inhibition constant have been determined (using the usual methods), must confirm the IC50 value according to the corresponding analytical expression. (c) The type and strength of an inhibitor can be analysed from the study of the variation in iD and IC50 with substrate concentration. The dependence of IC50 on the substrate concentration allows us to distinguish between non-competitive inhibition (iD does not depend on [D]0) and the rest. In the case of competitive inhibition, this dependence of iD on [D]0 leads to an ambiguity between competitive inhibition and type 1 mixed inhibition. This is solved by adjusting the data to the possible equations; in the case of a competitive inhibitor, the calculation of KI1app is carried out from the IC50 expression. The same occurs with uncompetitive inhibition and type 2 mixed inhibition. The representation of iD vs. n, with n=[D]0/KmD, allows us to distinguish between them. A hyperbolic iD vs. n representation that passes through the origin of coordinates is a characteristic of uncompetitive inhibition; the calculation of KI2app is immediate from the IC50 value. In the case of mixed inhibitors, the values of the apparent inhibition constant of meta-tyrosinase (Em) and oxy-tyrosinase (Eox), KI1app and the apparent inhibition constant of metatyrosinase/Dopa complexes (EmD) and oxytyrosinase/Dopa (EoxD), KI2app are obtained from the dependence of iD vs. n, and the results obtained must comply with the IC50 value.

Keywords: IC50; K I app; diphenolase activity; inhibition; polyphenol oxidase; tyrosinase.


Conflict of interest statement

The authors declare no competing financial interest.

Figures

Scheme 1
Scheme 1
Melanin biosynthesis pathway. M, monophenol (L-tyrosine); D, o-diphenol (L-dopa); DQ, (L-o-dopaquinone); L, leucodopachrome and DC, L-dopachrome.
Scheme 2
Scheme 2
Diphenolase activity of tyrosinase. Em, met-tyrosinase; Ed, deoxy-tyrosinase; Eox, oxy-tyrosinase; D, L-dopa; DQ, L-o-dopaquinone-H+ (in the amine group) and DC, L-dopachrome.
Scheme 3
Scheme 3
Generalized inhibition of tyrosinase diphenolase activity.
Figure 1
Figure 1
Representation of the iD (degree of inhibition of diphenolase activity) values, calculated from the experimental values of V0D,DC (initial rate of dopachrome accumulation when the enzyme acts on L-dopa) and Vo,iD,DC (initial rate of dopachrome accumulation when the enzyme acts on L-dopa in the presence of inhibitor), with respect to the inhibitor concentration. (A). Representation of iD for benzoate. The experimental conditions were: [E]0=5 nM [D]0=0.5 mM, phosphate buffer pH = 7, 25 °C and the inhibitor concentration (benzoate) was varied (mM): 0, 0.1, 0.3, 0.7, 1, 1.2, 1.4 and 1.7. (B). Representation of the iD values for cinnamate. The experimental conditions were the same as in Figure 1A and the inhibitor concentration (cinnamate) was varied according to (mM): 0, 0.1, 0.3, 0.6, 1, 1.4, 1.5 and 1.7.
Figure 2
Figure 2
Chemical structures: Benzoate (A), cinnamate (B), and their derivatives (a,b).
Figure 3
Figure 3
Docking of benzoate (A,B) and cinnamate (C,D) to oxy-tyrosinase. The binuclear active copper site in thin sticks (A,C) and the whole structure of oxy-tyrosinase in ribbons (B,D) are depicted with the ligands. The atom colours are as follows: oxygen = red, nitrogen = blue, copper = brown, white = hydrogen, and carbon = green. Ligands are shown in thick sticks and tyrosinase residues in thin sticks.
Figure 4
Figure 4
Docking of benzoate (A,B) and cinnamate (C,D) to met-tyrosinase. The binuclear active copper site in thin sticks (A,C) and the full structure of met-tyrosinase in ribbons (B,D) are depicted with the ligands. Colour scheme is as in Figure 3.
Figure 4
Figure 4
Docking of benzoate (A,B) and cinnamate (C,D) to met-tyrosinase. The binuclear active copper site in thin sticks (A,C) and the full structure of met-tyrosinase in ribbons (B,D) are depicted with the ligands. Colour scheme is as in Figure 3.
Figure 5
Figure 5
Docking of [2-(3-methoxyphenoxy)-2-oxoethyl] 2,4-dihydroxybenzoate to oxy-tyrosinase (A) and met-tyrosinase (B). Colour scheme is as in Figure 3.
Figure 6
Figure 6
Docking of (2-(3-methoxyphenoxy)-2-oxoethyl-(E)-3-(4-hydroxyphenyl) acrylate) to oxy-tyrosinase (A) and met-tyrosinase (B). Colour scheme is as in Figure 3.
Figure 7
Figure 7
(A,B). Representation of the degrees of inhibition iD obtained for each type of reversible and fast inhibition giving a hyperbolic behavior, against the inhibitor concentration. (A) a, competitive; b, uncompetitive; c, non-competitive. (B) d, mixed type (1) and e, mixed type (2). Conditions: a. Competitive: [E]0=10×109 M, [Eox]0=0.3×[E]0, [Em]0=0.7×[E]0; [D]0=0.5×10³ M; [O2]0=0.26×10³ M, and the inhibitor concentration was varied according to (μM): 0, 10, 15, 30, 45, 60, 72.5, 100, 200 and 300. The rate constants were: k2=5×10⁶ M1s1, k2=10 s1, k3=900 s1, k6=2.16×10⁵ M1s1, k6=10 s1, k7=108 s1, k8=2.3×10⁷ M1s1, k8=1.03×10³ s1, k11=106 M1s1, k11=10 s1, k14=105 M1s1, k14=2.68 s1, k16=10 s1. b. Uncompetitive. The simulation conditions were the same as in the previous case, but the new inhibition constants were: k12=106 M1s1, k12=10 s1, k14=105 M1s1, k14=2.68 s1, k15=105 M1s1, k15=3 s1. c. Non-competitive. The simulation conditions were the same as in the first case, but the inhibition constants were: k12=106 M1s1, k12=10 s1, k15=105 M1s1, k15=3 s1. d. Mixed type (1). The simulation conditions were the same as in the first case, but the inhibitor concentrations were (μM): 0, 10, 15, 30, 45, 60, 72.5, 100, 200, 300, 500 and 700. The inhibition constants were: k11=106 M1s1, k11=10 s1, k12=106 M1s1, k12=10 s1, k14=105 M1s1, k14=2.68 s1, k15=105 M1s1, k15=30 s1. e, Mixed type (2). The simulation conditions were the same as in the previous case, but the inhibition constants were: k11=105 M1s1, k11=30 s1, k12=106 M1s1, k12=10 s1, k14=105 M1s1, k14=2.68 s1, k15=106 M1s1, k15=10 s1.
Figure 8
Figure 8
(A) Solution of the ambiguity between competitive and mixed type (1) inhibition. Representation of iD vs. n. The simulation conditions were the same as in Figure 6A,B, but the inhibitor concentration [I]0 was constant (100 μM). The substrate concentration (mM) was varied: 0.25, 0.35, 0.5, 1, 2, 3, 5 and 10. The adjustment by non-linear regression (iDC vs. n), according to Equation (S17), allows us to obtain KI1app (KI1app=32.6 μM). Note that this value, according to Equation (S20), meets the value of IC50C (Table 4), which confirms the inhibition mechanism. (B) If it is a type (1) mixed inhibitor (KI1app<KI2app), the simulated data would not fit Equation (S17) but would fit Equation (S31), as shown in (B). In the latter case, KI1app (KI1app=26.2 μM) and KI2app (KI2app=74.5 μM) are determined. Note the fulfillment of Equation (S35), and therefore, the value of IC50M1, (Table 4), which confirms the inhibition mechanism.
Figure 9
Figure 9
(A,B). Solution of the ambiguity between uncompetitive and mixed type (2) inhibition. Obtaining iD by varying [D]0 at fixed inhibitor concentration. (A) ([I]0=30 μM). Representing iD vs. n, if a hyperbola is obtained that passes through the origin of coordinates, it could be an uncompetitive inhibition as per Equation (S25). Data analysis using nonlinear regression of this equation allows for obtaining the value of KI2app (KI2app=25.1 μM). Note the fulfilment of Equation (S28) (Table 4), which confirms the inhibition mechanism. (B) ([I]0= 50 μM) If the representation of iD vs. n gives rise to a hyperbola that does not pass through the origin of coordinates, it could be a type (2) mixed inhibition with KI2app<KI1app. The non-linear regression fit (iD vs. n), according to Equation (S31), allows KI1app and KI2app to be determined, resulting in KI1app(KI1app=31.5 μM) and KI2app(KI2app=10.1 μM). Note that these values satisfy Equation (S35) (see Table 4), which confirms the inhibition mechanism.

References

    1. Kanteev M., Goldfeder M., Fishman A. Structure–function correlations in tyrosinases. Protein Sci. 2015;24:1360–1369. doi: 10.1002/pro.2734. - DOI - PMC - PubMed
    1. Sánchez-Ferrer Á., Neptuno Rodríguez-López J., García-Cánovas F., García-Carmona F. Tyrosinase: A comprehensive review of its mechanism. Biochim. Biophys. Acta Protein Struct. Mol. Enzymol. 1995;1247:1–11. doi: 10.1016/0167-4838(94)00204-T. - DOI - PubMed
    1. Kim K., Huh Y., Lim K.-M. Anti-Pigmentary Natural Compounds and Their Mode of Action. Int. J. Mol. Sci. 2021;22:6206. doi: 10.3390/ijms22126206. - DOI - PMC - PubMed
    1. Maddaleno A.S., Camargo J., Mitjans M., Vinardell M.P. Melanogenesis and Melasma Treatment. Cosmetics. 2021;8:82. doi: 10.3390/cosmetics8030082. - DOI
    1. Zolghadri S., Bahrami A., Hassan Khan M.T., Munoz-Munoz J., Garcia-Molina F., Garcia-Canovas F., Saboury A.A. A comprehensive review on tyrosinase inhibitors. J. Enzyme Inhib. Med. Chem. 2019;34:279–309. doi: 10.1080/14756366.2018.1545767. - DOI - PMC - PubMed

LinkOut - more resources