. 2022 May 23;11(10):1383.
doi: 10.3390/plants11101383.

In Vitro Anti-Photoaging and Skin Protective Effects of Licania macrocarpa Cuatrec Methanol Extract

Affiliations

In Vitro Anti-Photoaging and Skin Protective Effects of Licania macrocarpa Cuatrec Methanol Extract

Kon Kuk Shin et al. Plants (Basel). .

Abstract

The Licania genus has been used in the treatment of dysentery, diabetes, inflammation, and diarrhea in South America. Of these plants, the strong anti-inflammatory activity of Licania macrocarpa Cuatrec (Chrysobalanaceae) has been reported previously. However, the beneficial activities of this plant on skin health have remained unclear. This study explores the protective activity of a methanol extract (50-100 μg/mL) in the aerial parts of L. macrocarpa Cuatrec (Lm-ME) and its mechanism, in terms of its moisturizing/hydration factors, skin wrinkles, UV radiation-induced cell damage, and radical generation (using RT/real-time PCR, carbazole assays, flowcytometry, DPPH/ABTS, and immunoblotting analysis). The anti-pigmentation role of Lm-ME was also tested by measuring levels of melanin, melanogenesis-related genes, and pigmentation-regulatory proteins. Lm-ME decreased UVB-irradiated death in HaCaT cells by suppressing apoptosis and inhibited matrix metalloproteinases 1/2 (MMP1/2) expression by enhancing the activity of extracellular signal-regulated kinase (ERK), c-Jun N-terminal kinase (JNK), and p38. It was confirmed that Lm-ME displayed strong antioxidative activity. Lm-ME upregulated the expression of hyaluronan synthases-2/3 (HAS-2/3) and transglutaminase-1 (TGM-1), as well as secreted levels of hyaluronic acid (HA) via p38 and JNK activation. This extract also significantly inhibited the production of hyaluronidase (Hyal)-1, -2, and -4. Lm-ME reduced the melanin expression of microphthalmia-associated transcription factor (MITF), tyrosinase, and tyrosinase-related protein-1/2 (TYRP-1/2) in α-melanocyte-stimulating hormone (α-MSH)-treated B16F10 cells via the reduction of cAMP response element-binding protein (CREB) and p38 activation. These results suggest that Lm-ME plays a role in skin protection through antioxidative, moisturizing, cytoprotective, and skin-lightening properties, and may become a new and promising cosmetic product beneficial for the skin.

Keywords: B16 melanoma cells; HaCaT cells; UVB exposure; melanogenesis; wrinkle formation.


Conflict of interest statement

The authors declare no conflict of interest.

Figures

Figure 1
Figure 1
The antioxidative activity of Lm-ME and its phytochemical fingerprinting profiles. (a,b) DPPH and ABTS assays were performed to confirm the ROS scavenging activity of Lm-ME. Ascorbic acid (500 μM) was used as a positive control. (c) The phytochemical fingerprinting profiles of Lm-ME using HPLC analysis. (d) Qualitative analysis of Lm-ME using GC/MS analysis. *: p < 0.05 and **: p < 0.01 compared to the control group (DPPH or ABTS alone).
Figure 2
Figure 2
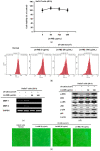
The protective effects of Lm-ME under UVB irradiation. (a) HaCaT cells were treated with Lm-ME at 50 and 100 μg/mL. After 24 h, cell viability was measured using the MTT assay. (b) HaCaT cells were stained with DCFDA, which were evaluated with flow cytometry to check ROS production. (c) The mRNA expression of MMP-1 and -2 was analyzed using RT-PCR. GAPDH was used as an internal control. (d) After UVB induction (30 mJ/cm2), cells were treated with dose-dependently Lm-ME (0–100 μg/mL) for 24 h. Phosphorylated and total ERK, JNK, and p38 were tested with Western blot. (e) HaCaT cells were pretreated with Lm-ME and continuously irradiated with UVB. After 48 h, photos of cells were taken using a digital camera. (fh) HaCaT was stained with annexin V/PI and detected using flow cytometry. The bottom values of c and d indicate the relative intensity measured using ImageJ. ##: p < 0.01 compared to the normal group and *: p < 0.05 and **: p < 0.01 compared to the control group.
Figure 2
Figure 2
The protective effects of Lm-ME under UVB irradiation. (a) HaCaT cells were treated with Lm-ME at 50 and 100 μg/mL. After 24 h, cell viability was measured using the MTT assay. (b) HaCaT cells were stained with DCFDA, which were evaluated with flow cytometry to check ROS production. (c) The mRNA expression of MMP-1 and -2 was analyzed using RT-PCR. GAPDH was used as an internal control. (d) After UVB induction (30 mJ/cm2), cells were treated with dose-dependently Lm-ME (0–100 μg/mL) for 24 h. Phosphorylated and total ERK, JNK, and p38 were tested with Western blot. (e) HaCaT cells were pretreated with Lm-ME and continuously irradiated with UVB. After 48 h, photos of cells were taken using a digital camera. (fh) HaCaT was stained with annexin V/PI and detected using flow cytometry. The bottom values of c and d indicate the relative intensity measured using ImageJ. ##: p < 0.01 compared to the normal group and *: p < 0.05 and **: p < 0.01 compared to the control group.
Figure 3
Figure 3
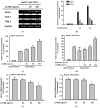
The hydration effects of Lm-ME in HaCaT cells. (a,b) After treatment with Lm-ME for 24 h, the hydration-related genes (HAS-2, -3, and TGM-1) were analyzed in HaCaT cells by semi-quantitative and real-time PCR. GAPDH was used as an internal control. (c,d) Hyaluronic acid levels were determined from culture supernatants of normal Lm-ME-treated or UVB-irradiated HaCaT cells using the carbazole assay. (ei) The mRNA expressions of Hyal-1, -2, and -4 were determined from normal Lm-ME-treated or UVB-irradiated HaCaT cells using real-time PCR. (j) The AP-1 luciferase construct and β-gal (as control) were transfected for 24 h. The HEK293T cells were then treated with Lm-ME at different concentrations (0–100 μg/mL). Luciferase activity was measured using a luminometer. (k) The HaCaT cells were treated with Lm-ME (0–100 μg/mL) for 24 h. The levels of phosphorylated, as well as the total ERK, JNK, and p38 gene products, were tested using immunoblotting. (l) The HaCaT cells were then treated with Lm-ME (0–100 μg/mL) and MAPK inhibitors, such as U 0126, SB 203580, and SP 600125. After this treatment, the mRNA expression levels of HAS-2 and HAS-3 were analyzed using semi-quantitative PCR. The relative intensity of bottom values of a, k, and l are measured using ImageJ. #: p < 0.05 and ##: p < 0.01 compared to the normal group, and *: p < 0.05 and **: p < 0.01 compared to the control group.
Figure 3
Figure 3
The hydration effects of Lm-ME in HaCaT cells. (a,b) After treatment with Lm-ME for 24 h, the hydration-related genes (HAS-2, -3, and TGM-1) were analyzed in HaCaT cells by semi-quantitative and real-time PCR. GAPDH was used as an internal control. (c,d) Hyaluronic acid levels were determined from culture supernatants of normal Lm-ME-treated or UVB-irradiated HaCaT cells using the carbazole assay. (ei) The mRNA expressions of Hyal-1, -2, and -4 were determined from normal Lm-ME-treated or UVB-irradiated HaCaT cells using real-time PCR. (j) The AP-1 luciferase construct and β-gal (as control) were transfected for 24 h. The HEK293T cells were then treated with Lm-ME at different concentrations (0–100 μg/mL). Luciferase activity was measured using a luminometer. (k) The HaCaT cells were treated with Lm-ME (0–100 μg/mL) for 24 h. The levels of phosphorylated, as well as the total ERK, JNK, and p38 gene products, were tested using immunoblotting. (l) The HaCaT cells were then treated with Lm-ME (0–100 μg/mL) and MAPK inhibitors, such as U 0126, SB 203580, and SP 600125. After this treatment, the mRNA expression levels of HAS-2 and HAS-3 were analyzed using semi-quantitative PCR. The relative intensity of bottom values of a, k, and l are measured using ImageJ. #: p < 0.05 and ##: p < 0.01 compared to the normal group, and *: p < 0.05 and **: p < 0.01 compared to the control group.
Figure 4
Figure 4
The anti-pigmentation effects of Lm-ME. (a) B16F10 cells were co-treated with α-MSH Lm-ME (0–100 μg/mL) or arbutin (1 mM) for 48 h. Photos were taken using a Nikon Eclipse Ti inverted microscope (DS-Qi1Mc, Nikon Shinagawa, Tokyo, Japan). (b) The B16F10 cells were treated with Lm-ME (0–100 μg/mL) for 48 h. The cell viability was examined with an MTT assay. (c) B16F10 cells were induced using α-MSH for 48 h. Lm-ME (0–100 μg/mL) and arbutin (1 mM), as the control for 48 h. Melanin secretion was tested at 475 nm. (d) To measure the melanin content, the B16F10 cell pellets were lysed using a lysis buffer. The absorbance of B16F10 cell lysates was measured at 405 nm using spectrophotometry. (e) Tyrosinase activity was induced via mushroom tyrosinase (100 U/mL). Furthermore, 2 mM of L-DOPA and Lm-ME (0–100 μg/mL) or kojic acid (300 μM) was co-treated for 15 min. Next, mushroom tyrosinase was added. The absorbance of each sample was measured at 475 nm. (f) B16F10 cells were co-treated with α-MSH and Lm-ME or arbutin for 24 h. The mRNA levels of melanogenesis-related genes were checked by RT-PCR. GAPDH was used as an internal control. (g) The CREB-luc and β-gal were transfected with PEI for 24 h. The B16F10 cells were then treated with Lm-ME in a dose-dependent manner. CREB luciferase activity was checked using a luminometer. (h) The B16F10 cells were co-treated with α-MSH and Lm-ME or arbutin for 48 h. The total and phosphorylated forms of MITF and CREB were measured using Western blot. (i) The B16F10 cells were treated with α-MSH and Lm-ME or arbutin for 24 h. Next, the total and phospho-ERK, JNK, and p38 were tested using Western blot. The bottom values of (f,h,i) indicate the relative intensity measured using ImageJ (Wayne Rasband, NIH, Bethesda, MD, USA). ##: p < 0.01 compared to the normal group, and **: p < 0.01 compared to the control group.
Figure 4
Figure 4
The anti-pigmentation effects of Lm-ME. (a) B16F10 cells were co-treated with α-MSH Lm-ME (0–100 μg/mL) or arbutin (1 mM) for 48 h. Photos were taken using a Nikon Eclipse Ti inverted microscope (DS-Qi1Mc, Nikon Shinagawa, Tokyo, Japan). (b) The B16F10 cells were treated with Lm-ME (0–100 μg/mL) for 48 h. The cell viability was examined with an MTT assay. (c) B16F10 cells were induced using α-MSH for 48 h. Lm-ME (0–100 μg/mL) and arbutin (1 mM), as the control for 48 h. Melanin secretion was tested at 475 nm. (d) To measure the melanin content, the B16F10 cell pellets were lysed using a lysis buffer. The absorbance of B16F10 cell lysates was measured at 405 nm using spectrophotometry. (e) Tyrosinase activity was induced via mushroom tyrosinase (100 U/mL). Furthermore, 2 mM of L-DOPA and Lm-ME (0–100 μg/mL) or kojic acid (300 μM) was co-treated for 15 min. Next, mushroom tyrosinase was added. The absorbance of each sample was measured at 475 nm. (f) B16F10 cells were co-treated with α-MSH and Lm-ME or arbutin for 24 h. The mRNA levels of melanogenesis-related genes were checked by RT-PCR. GAPDH was used as an internal control. (g) The CREB-luc and β-gal were transfected with PEI for 24 h. The B16F10 cells were then treated with Lm-ME in a dose-dependent manner. CREB luciferase activity was checked using a luminometer. (h) The B16F10 cells were co-treated with α-MSH and Lm-ME or arbutin for 48 h. The total and phosphorylated forms of MITF and CREB were measured using Western blot. (i) The B16F10 cells were treated with α-MSH and Lm-ME or arbutin for 24 h. Next, the total and phospho-ERK, JNK, and p38 were tested using Western blot. The bottom values of (f,h,i) indicate the relative intensity measured using ImageJ (Wayne Rasband, NIH, Bethesda, MD, USA). ##: p < 0.01 compared to the normal group, and **: p < 0.01 compared to the control group.
Figure 5
Figure 5
Schematic summary of the skin protective actions of Lm-ME with UV protection, moisturizing, anti-melanogenesis properties.

Similar articles

Cited by

References

    1. You L., Cho J.Y. The regulatory role of korean ginseng in skin cells. J. Ginseng Res. 2021;45:363–370. doi: 10.1016/j.jgr.2020.08.004. - DOI - PMC - PubMed
    1. Song C., Lorz L.R., Lee J., Cho J.Y. In vitro photoprotective, anti-inflammatory, moisturizing, and antimelanogenic effects of a methanolic extract of Chrysophyllum lucentifolium cronquist. Plants. 2021;11:94. doi: 10.3390/plants11010094. - DOI - PMC - PubMed
    1. Jeong D., Qomaladewi N.P., Lee J., Park S.H., Cho J.Y. The role of autophagy in skin fibroblasts, keratinocytes, melanocytes, and epidermal stem cells. J. Investig. Dermatol. 2020;140:1691–1697. doi: 10.1016/j.jid.2019.11.023. - DOI - PubMed
    1. Saba E., Kim S.H., Lee Y.Y., Park C.K., Oh J.W., Kim T.H., Kim H.K., Roh S.S., Rhee M.H. Korean red ginseng extract ameliorates melanogenesis in humans and induces antiphotoaging effects in ultraviolet B-irradiated hairless mice. J. Ginseng Res. 2020;44:496–505. doi: 10.1016/j.jgr.2019.05.003. - DOI - PMC - PubMed
    1. Truong V.L., Keum Y.S., Jeong W.S. Red ginseng oil promotes hair growth and protects skin against UVC radiation. J. Ginseng Res. 2021;45:498–509. doi: 10.1016/j.jgr.2020.12.008. - DOI - PMC - PubMed