

NIR Instruments and Prediction Methods for Rapid Access to Grain Protein Content in Multiple Cereals
- PMID: 35632119
- PMCID: PMC9146900
- DOI: 10.3390/s22103710
NIR Instruments and Prediction Methods for Rapid Access to Grain Protein Content in Multiple Cereals
Abstract
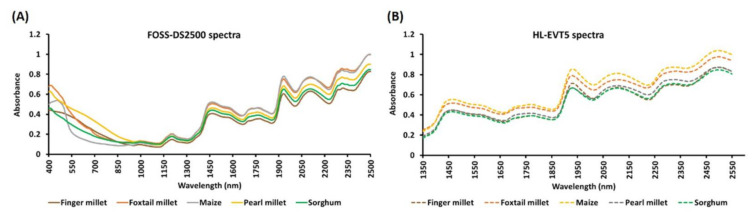
Achieving global goals for sustainable nutrition, health, and wellbeing will depend on delivering enhanced diets to humankind. This will require instantaneous access to information on food-source quality at key points of agri-food systems. Although laboratory analysis and benchtop NIR spectrometers are regularly used to quantify grain quality, these do not suit all end users, for example, stakeholders in decentralized agri-food chains that are typical in emerging economies. Therefore, we explored benchtop and portable NIR instruments, and the methods that might aid these particular end uses. For this purpose, we generated NIR spectra for 328 grain samples from multiple cereals (finger millet, foxtail millet, maize, pearl millet, and sorghum) with a standard benchtop NIR spectrometer (DS2500, FOSS) and a novel portable NIR-based instrument (HL-EVT5, Hone). We explored classical deterministic methods (via winISI, FOSS), novel machine learning (ML)-driven methods (via Hone Create, Hone), and a convolutional neural network (CNN)-based method for building the calibrations to predict grain protein out of the NIR spectra. All of the tested methods enabled us to build relevant calibrations out of both types of spectra (i.e., R2 ≥ 0.90, RMSE ≤ 0.91, RPD ≥ 3.08). Generally, the calibration methods integrating the ML techniques tended to enhance the prediction capacity of the model. We also documented that the prediction of grain protein content based on the NIR spectra generated using the novel portable instrument (HL-EVT5, Hone) was highly relevant for quantitative protein predictions (R2 = 0.91, RMSE = 0.97, RPD = 3.48). Thus, the presented findings lay the foundations for the expanded use of NIR spectroscopy in agricultural research, development, and trade.
Keywords: Convolution Neural Network (CNN); Hone Create; cereals; near-infrared spectroscopy (NIRS); prediction methods; protein; winISI.
Conflict of interest statement
The authors declare no conflict of interest. The funders had no role in the design of the study; in the collection, analyses, or interpretation of data; in the writing of the manuscript, or in the decision to publish the results.
Figures


References
-
- Agelet L.E., Hurburgh C.R., Jr. A tutorial on near infrared spectroscopy and its calibration. Crit. Rev. Anal. Chem. 2010;40:246–260. doi: 10.1080/10408347.2010.515468. - DOI
-
- Workman J., Weyer L. Practical Guide and Spectral Atlas for Interpretive Near-Infrared Spectroscopy. 2nd ed. CRC Press; Boca Raton, FL, USA: 2012. - DOI
-
- Villamuelas M., Serrano E., Espunyes J., Fernández N., López-Olvera J.R., Garel M., Santos J., Parra-Aguado M.Á., Ramanzin M., Fernández-Aguilar X., et al. Predicting herbivore faecal nitrogen using a multispecies near-infrared reflectance spectroscopy calibration. PLoS ONE. 2017;12:e0176635. doi: 10.1371/journal.pone.0176635. - DOI - PMC - PubMed
-
- Rukundo I.R., Danao M.G.C., Mitchell R.B., Masterson S.D., Weller C.L. Comparing the use of portable and benchtop NIR spectrometers in predicting nutritional value of forage. Appl. Eng. Agric. 2021;37:171–181. doi: 10.13031/aea.14157. - DOI
-
- FOSS-DS2500 Flour Analyzer from FOSS. [(accessed on 7 January 2021)]. Available online: https://www.dksh.com/global-en/products/ins/foss-flour-analyzer-nirs-ds2500.
MeSH terms
Substances
Grants and funding
LinkOut - more resources
Full Text Sources
Miscellaneous
