. 2022 Apr 28;14(5):916.
doi: 10.3390/v14050916.

Generated Randomly and Selected Functionally? The Nature of Enterovirus Recombination

Affiliations

Generated Randomly and Selected Functionally? The Nature of Enterovirus Recombination

Fadi G Alnaji et al. Viruses. .

Abstract

Genetic recombination in RNA viruses is an important evolutionary mechanism. It contributes to population diversity, host/tissue adaptation, and compromises vaccine efficacy. Both the molecular mechanism and initial products of recombination are relatively poorly understood. We used an established poliovirus-based in vitro recombination assay to investigate the roles of sequence identity and RNA structure, implicated or inferred from an analysis of circulating recombinant viruses, in the process. In addition, we used next-generation sequencing to investigate the early products of recombination after cellular coinfection with different poliovirus serotypes. In independent studies, we find no evidence for a role for RNA identity or structure in determining recombination junctions location. Instead, genome function and fitness are of greater importance in determining the identity of recombinant progeny. These studies provide further insights into this important evolutionary mechanism and emphasize the critical nature of the selection process on a mixed virus population.

Keywords: next-generation sequencing; positive-sense RNA viruses; recombination; viral evolution.


Conflict of interest statement

All authors declare no conflict of interest.

Figures

Figure 1
Figure 1
Schematic representation of CRE-REP assays. (A) Intertypic CRE-REP assay showing the genomes of the PV3 acceptor and PV1 donor RNAs. Black arrows represent position of primers used to amplify recombinant genomes. The lower expanded image illustrates the recombination window and highlights examples of recombination events in Cluster 1 and Cluster 2. The position of a unique XbaI site used for screening is shown in the donor template. (B) Modified CRE-REP assays highlighting the region of modification within Cluster 2 and the resulting acceptor and donor templates with altered sequence identity or RNA secondary structure.
Figure 2
Figure 2
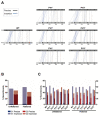
Analysis of recombination junctions from CRE-REP assay. (A) The location of each recombination junction was mapped respective to each parental genome. Each line represents a unique recombinant within the population of precise (black) or imprecise-insertion (blue) recombinants (see Nomenclature, materials and method). (B) Junctions were defined as precise or imprecise and graphed according to location in Cluster 1 or Cluster 2. Unflattened data were compared to flattened data using Fisher’s Exact Test and showed no significant difference in the distribution of recombinants. (C) Junctions were defined as for (B) and graphed by individual CRE-REP assay. Each modified assay was compared to wild type using Fisher’s Exact Test and showed no significant difference in the distribution of recombinants, either between assays or unflattened and flattened data sets.
Figure 3
Figure 3
Isolation and characterization of recombinants generated from virus coinfection. (A) PCR amplification of the region between nucleotides 3235–4548 followed by agarose gel screening. The negative control is an equimolar mixture of in vitro transcribed full-length PV1 and PV3 RNA. (B) The number of precise and imprecise (both insertion and deletion) recombinants was plotted against the number of NGS reads (left panel); each dot represents a unique recombinant. On the right panel, heatmaps show the distribution of sequence lengths of insertion (blue) and deletion (red) within the detected imprecise recombinants. Each cell represents a unique recombinant. (C) Parallel coordinates visualization of recombinants from coinfection studies. The location of each recombination junction was mapped respective to each parental genome. Each line represents a unique recombinant within the population of precise (black), imprecise-insertion (blue), and imprecise-deletion (red) recombinants.
Figure 4
Figure 4
Analysis of recombination junction sequences generated from virus coinfection. (A) The occurrence of recombination on the genome was given a score of 1 while no occurrence was 0. The number of recombination occurrences was calculated in a cumulative way, i.e., the occurrence of recombination at each position was added to the occurrence at the previous position. This was applied to two populations; the precise recombinants from the virus coinfection sample and a random recombination model generated by Excel. The cumulative recombinant count (y-axis) was plotted against the locations on the PV1 (donor) amplicon (x-axis). (B) An identical sequence length (IS) of 4 nt, which hypothetically occurred twice in the genome, was used as an example. The rectangles correspond to a part of the targeted region of PV1 and PV3, the lines represent recombinants and their lengths denote the NGS read, i.e., the longer the line, the more NGS reads. The identical sequence is placed within a smaller rectangle and the red Ns represent a mismatch of any other nucleotides. Looking at a possible real situation in the left panel, the Precise Recombinants (PRs) occurred at different sites within the identical sequence with different reads. ViReMa will always report 1 PR per IS—something similar to the middle panel. In our linear model, we convert ViReMa model into the right panel, where junction counts equal the number of sequence identity length + the mismatch, and NGS reads are equal for all junctions. (C) Individual counts of identical sequences (IS) of different lengths were summed within the amplified region and plotted along with the count of precise junctions that mapped to each different length of sequence identity. For each of the latter the average number of junctions per nucleotide was calculated, assuming that recombination was equally likely to occur at each position within identical donor and template sequences. The linear regression analysis was performed to compare the slopes between the predicted-data model (fitted line) and the expected-data model (perfect line); since the slopes of both lines are nearly identical, only one line can be seen in the figure.
Figure 5
Figure 5
The influence of identical sequence length and reading frame on imprecise recombination. (A) The imprecise recombinants were counted at each identical length (x-axis) and the percentage proportion related to the total imprecise junctions was calculated (y-axis). The flattened data of the imprecise recombinants generated from the coinfection experiments (grey) were plotted against a random control (black), where every possible imprecise junction was created and classified using a custom Perl script. (B) In the upper panel, the locations of the detected imprecise recombinants on the PV1 genome were plotted against the NGS read count. In the lower panel, the size of either the insertions or deletions of the detected recombinants were plotted against NGS read count. Each dot represents a unique recombinant.
Figure 6
Figure 6
The influence of RNA structure on recombination. The MFED was calculated for a 100 nt sliding window (at 30 nt increments) for both PV1 and PV3 positive and negative strands (dashed and solid lines, respectively) and plotted against the number of total recombinants within the same sliding window. We chose a 100 nt window, as we found from our previous studies [19,20,28] that decreasing the sliding window size would introduce noise to the system attributed to the appearance and disappearance of small stem–loop structures, making the MFED values less conclusive. Spearman’s correlation coefficient was calculated between the recombinant count and the MFED values on either strand.

References

    1. Hahn C.S., Lustig S., Strauss E.G., Strauss J.H. Western equine encephalitis virus is a recombinant virus. Proc. Natl. Acad. Sci. USA. 1988;85:5997–6001. doi: 10.1073/pnas.85.16.5997. - DOI - PMC - PubMed
    1. Ge X.Y., Li J.L., Yang X.L., Chmura A.A., Zhu G., Epstein J.H., Mazet J.K., Hu B., Zhang W., Peng C., et al. Isolation and characterization of a bat SARS-like coronavirus that uses the ACE2 receptor. Nature. 2013;503:535–538. doi: 10.1038/nature12711. - DOI - PMC - PubMed
    1. Li K.S., Guan Y., Wang J., Smith G.J., Xu K.M., Duan L., Rahardjo A.P., Puthavathana P., Buranathai C., Nguyen T.D., et al. Genesis of a highly pathogenic and potentially pandemic H5N1 influenza virus in eastern Asia. Nature. 2004;430:209–213. doi: 10.1038/nature02746. - DOI - PubMed
    1. Smith G.J., Vijaykrishna D., Bahl J., Lycett S.J., Worobey M., Pybus O.G., Ma S.K., Cheung C.L., Raghwani J., Bhatt S., et al. Origins and evolutionary genomics of the 2009 swine-origin H1N1 influenza A epidemic. Nature. 2009;459:1122–1125. doi: 10.1038/nature08182. - DOI - PubMed
    1. Gmyl A.P., Belousov E.V., Maslova S.V., Khitrina E.V., Chetverin A.B., Agol V.I. Nonreplicative RNA recombination in poliovirus. J. Virol. 1999;73:8958–8965. doi: 10.1128/JVI.73.11.8958-8965.1999. - DOI - PMC - PubMed

Publication types

LinkOut - more resources