. 2022 Oct;42(10):1890-1904.
doi: 10.1177/0271678X221104540. Epub 2022 May 27.

Measurement of glucose metabolism in the occipital lobe and frontal cortex after oral administration of [1-13C]glucose at 9.4 T

Affiliations

Measurement of glucose metabolism in the occipital lobe and frontal cortex after oral administration of [1-13C]glucose at 9.4 T

Theresia Ziegs et al. J Cereb Blood Flow Metab. 2022 Oct.

Abstract

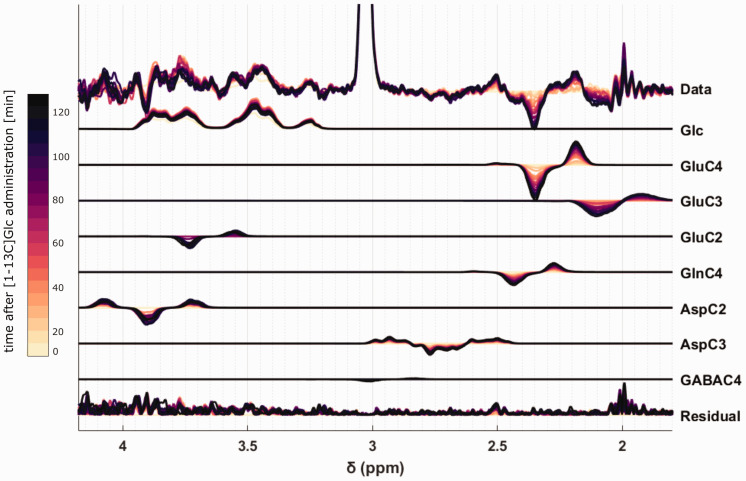
For the first time, labeling effects after oral intake of [1-13C]glucose are observed in the human brain with pure 1H detection at 9.4 T. Spectral time series were acquired using a short-TE 1H MRS MC-semiLASER (Metabolite Cycling semi Localization by Adiabatic SElective Refocusing) sequence in two voxels of 5.4 mL in the frontal cortex and the occipital lobe. High-quality time-courses of [4-13C]glutamate, [4-13C]glutamine, [3-13C]glutamate + glutamine, [2-13C] glutamate+glutamine and [3-13C]aspartate for individual volunteers and additionally, group-averaged time-courses of labeled and non-labeled brain glucose could be obtained. Using a one-compartment model, mean metabolic rates were calculated for each voxel position: The mean rate of the TCA-cycle (Vtca) value was determined to be 1.36 and 0.93 μmol min-1 g-1, the mean rate of glutamine synthesis (Vgln) was calculated to be 0.23 and 0.45 μmol min-1 g-1, the mean exchange rate between cytosolic amino acids and mitochondrial Krebs cycle intermediates (Vx) rate was found to be 0.57 and 1.21 μmol min-1 g-1 for the occipital lobe and the frontal cortex, respectively. These values were in agreement with previously reported data. Altogether, it can be shown that this most simple technique combining oral administration of [1-13C]Glc with pure 1H MRS acquisition is suitable to measure metabolic rates.

Keywords: Glucose metabolism; glutamatergic metabolism; human brain; proton magnetic resonance spectroscopy; ultra-high field strengths.


Conflict of interest statement

Declaration of conflicting interests: The author(s) declared no potential conflicts of interest with respect to the research, authorship, and/or publication of this article.

Figures

None
Figure 1. Position of the voxel (15 × 18 × 20 mm2) in the occipital lobe (a) and the frontal cortex (b) along with the corresponding sample spectra.
Figure 2.
Figure 2.
Simulated LCModel basis spectra for metabolites, which are 13C labeled at different carbon positions for the LCModel fit of post-Glc-administration: Glutamate and glutamine labeled at position C4 (Glu C4, Gln C4, respectively), the mix of glutamate and glutamine labeled at position C3 and C2 (Glx C3, Glx C2, respectively), aspartate labeled at position C2 and C3 (Asp C2, Asp C3, respectively) as well as GABA labeled at position C2, C3 and C4 (GABA C2, GABA C3, GABA C4, respectively). These basis spectra were simulated using the method of Boumezbeur et al. as described in the method section to account for the decrease for 12C-bonded protons and the increase of 13C-bonded protons at the same time. In the bottom three rows the unlabeled Glc spectrum for the upfield and the downfield area, the labeled Glc spectrum for the upfield area and the [1-13C]Glcα were seen for the downfield area. The Glc and the [1-13C]Glc basis sets are indistinguishable for LCModel. Thus, only the unlabeled Glc basis set was used in the LCModel fits.
Figure 3.
Figure 3.
Time series of spectra and difference spectra from (a) occipital lobe and (b) frontal cortex. The changes for the 12C-bonded H4-glutamate and -glutamine signals are highlighted in the zoomed figure above for a few selected time points.and (c) Sum of the last difference spectrum for all volunteers. Decreasing metabolite peaks with 12C-bonded protons are marked in blue and increasing satilite peaks due to the coupling to 13C are marked in green. In the lower panel, subtraction errors at the NAA 2CH3, Cr CH3 and Cho CH3 peaks are additionally shown.
Figure 4.
Figure 4.
Difference spectra and fitted metabolite basis sets for the metabolites of interests with the remaining Cr CH3 peak at 3 ppm. In addition, the residual of the difference spectra and the fit are displayed. Sample data from one volunteer from the occipital lobe. Colors indicate time points from light to dark (yellow for short after the Glc intake to black at the very end of the measurement).
Figure 5.
Figure 5.
(a) The first row shows mean concentrations across all volunteers in the occipital lobe (black) and frontal cortex (red). The columns show data Glctot, Glc12C in addition to an exponential fit and Glc13C and In (b) the time courses for different labeled metabolies is shown. The range of concentration for each volunteer for the occipital lobe (first column), frontal cortex (second column) and the percent enrichment (PE) calculated from the mean concentration for each position is presented. For the calculation of the mean concentration as well as the percent enrichment, data from volunteers, which are too far from the median, were removed. See methods section for more information.
Figure 6.
Figure 6.
Experimental mean percent enrichment for [4-13C]Glu, [3-13C]Glx and [4-13C]Gln for both voxel positions (red dots) and the fitted curve from CWave (green) with a single-compartment model in (a) for the occipital lobe and in and (b) for the frontal cortex.

Similar articles

Cited by

References

    1. Blüml S, Moreno A, Hwang J-H, et al.. 1-13C glucose magnetic resonance spectroscopy of pediatric and adult brain disorders. NMR Biomed 2001; 14: 19–32. - PubMed
    1. Chhina N, Kuestermann E, Halliday J, et al.. Measurement of human tricarboxylic acid cycle rates during visual activation by 13C magnetic resonance spectroscopy. J Neurosci Res 2001; 66: 737–746. - PubMed
    1. Gruetter R, Novotny EJ, Boulware SD, et al.. Localized 13C NMR spectroscopy in the human brain of amino acid labeling from D-[1-13C] glucose. J Neurochem 2002; 63: 1377–1385. - PubMed
    1. Mason GF, Petersen KF, de Graaf RA, et al.. A comparison of 13 C NMR measurements of the rates of glutamine synthesis and the tricarboxylic acid cycle during oral and intravenous administration of. Brain Res Protoc 2003; 10: 181–190. - PubMed
    1. Lanz B, Xin L, Millet P, et al.. In vivo quantification of neuro-glial metabolism and glial glutamate concentration using 1H-[13C] MRS at 14.1T. J Neurochem 2014; 128: 125–139. - PubMed

Publication types

LinkOut - more resources