. 2022 May 28;79(6):323.
doi: 10.1007/s00018-022-04340-z.

PAI-1 production by reactive astrocytes drives tissue dysfibrinolysis in multiple sclerosis models

Affiliations

PAI-1 production by reactive astrocytes drives tissue dysfibrinolysis in multiple sclerosis models

Héloïse Lebas et al. Cell Mol Life Sci. .

Abstract

Background: In multiple sclerosis (MS), disturbance of the plasminogen activation system (PAS) and blood brain barrier (BBB) disruption are physiopathological processes that might lead to an abnormal fibrin(ogen) extravasation into the parenchyma. Fibrin(ogen) deposits, usually degraded by the PAS, promote an autoimmune response and subsequent demyelination. However, the PAS disruption is not well understood and not fully characterized in this disorder.

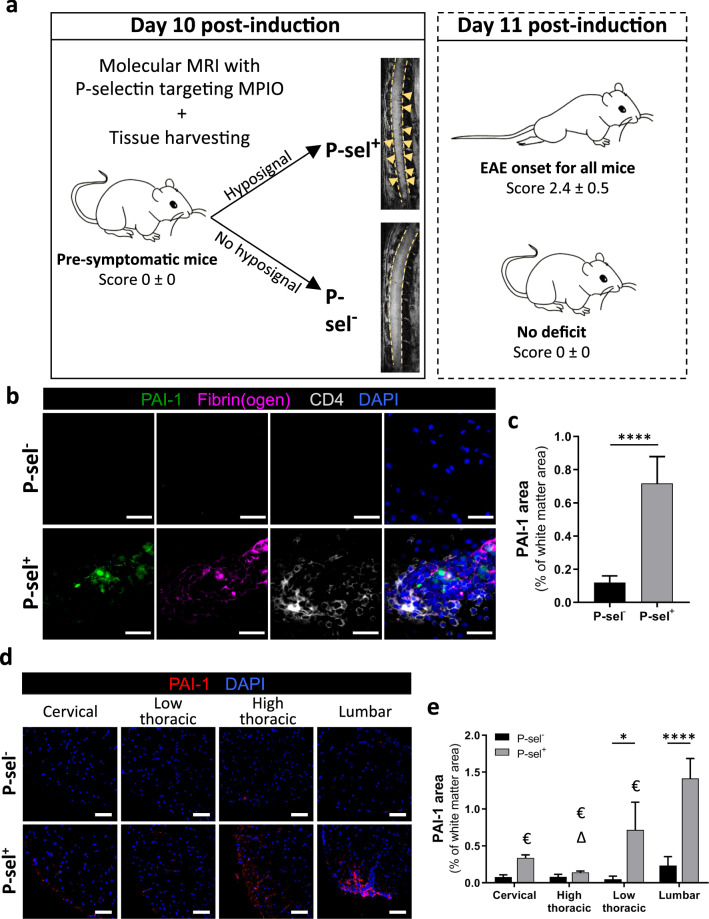
Methods: Here, we characterized the expression of PAS actors during different stages of two mouse models of MS (experimental autoimmune encephalomyelitis-EAE), in the central nervous system (CNS) by quantitative RT-PCR, immunohistofluorescence and fluorescent in situ hybridization (FISH). Thanks to constitutive PAI-1 knockout mice (PAI-1 KO) and an immunotherapy using a blocking PAI-1 antibody, we evaluated the role of PAI-1 in EAE models and its impact on physiopathological processes such as fibrin(ogen) deposits, lymphocyte infiltration and demyelination.

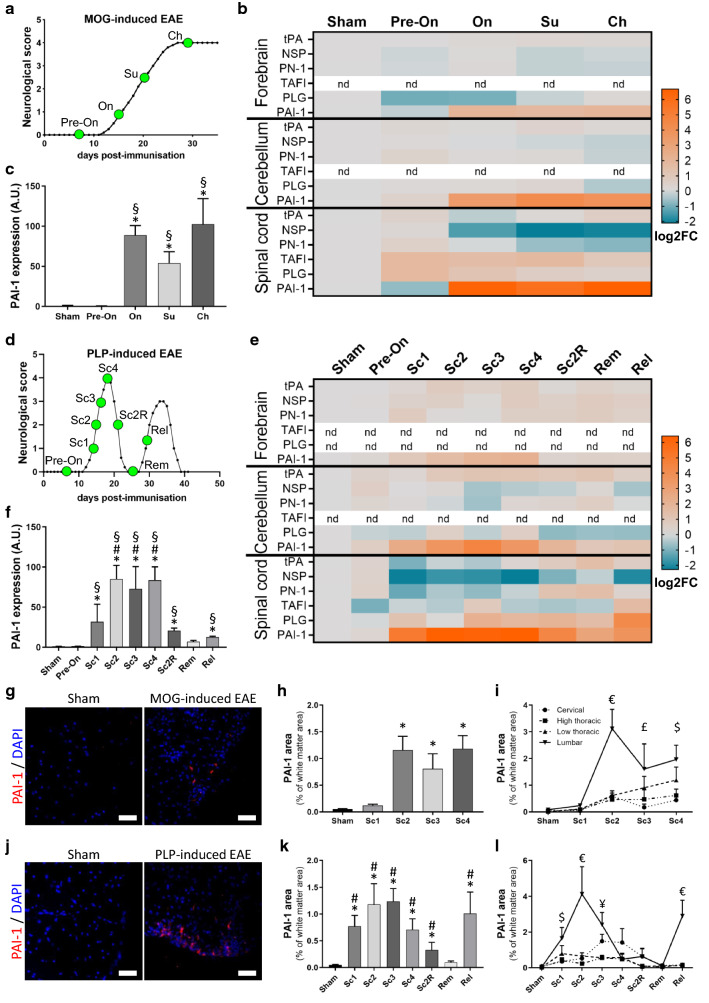
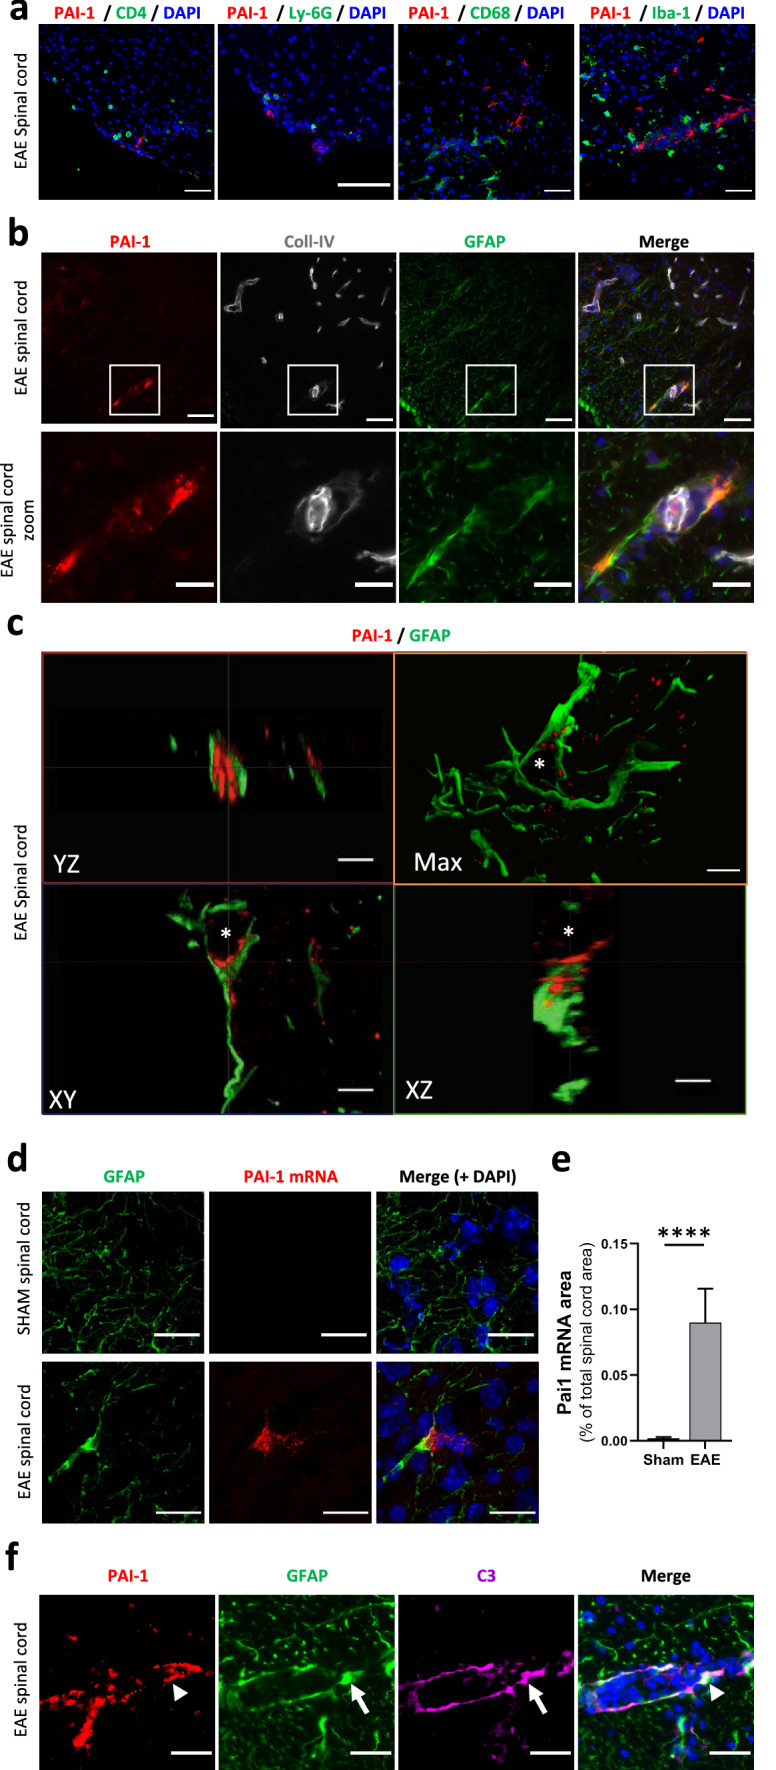
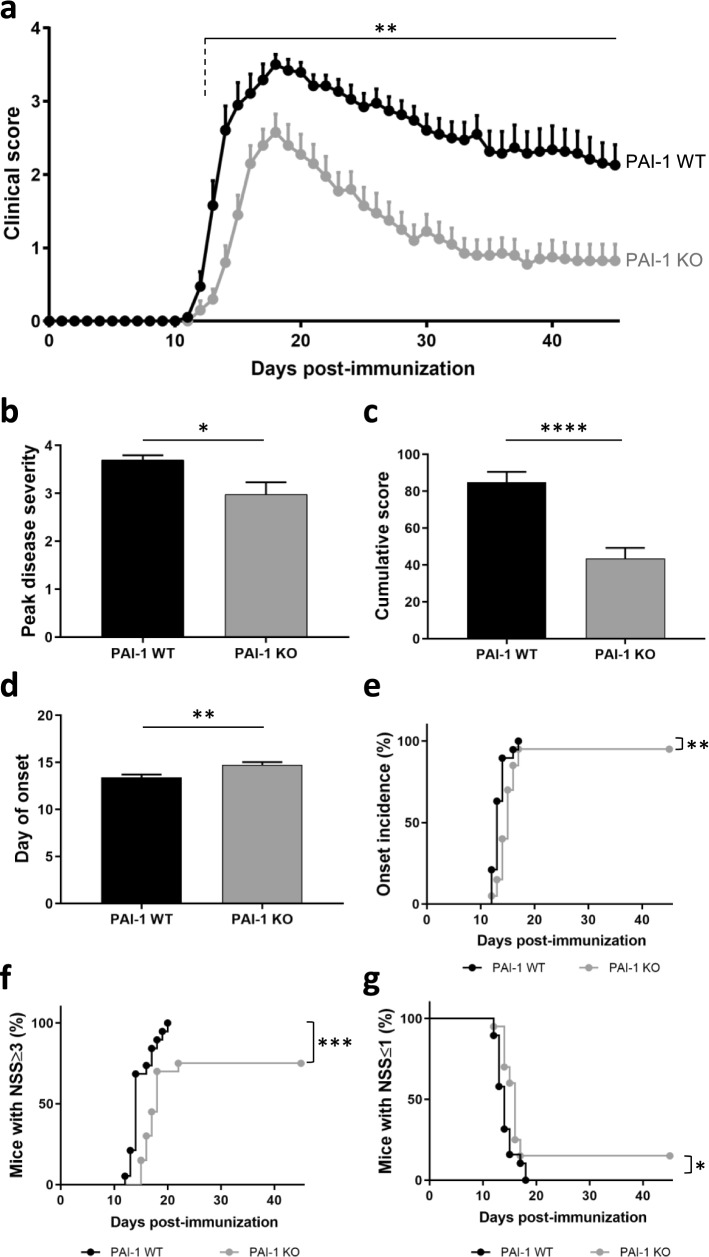
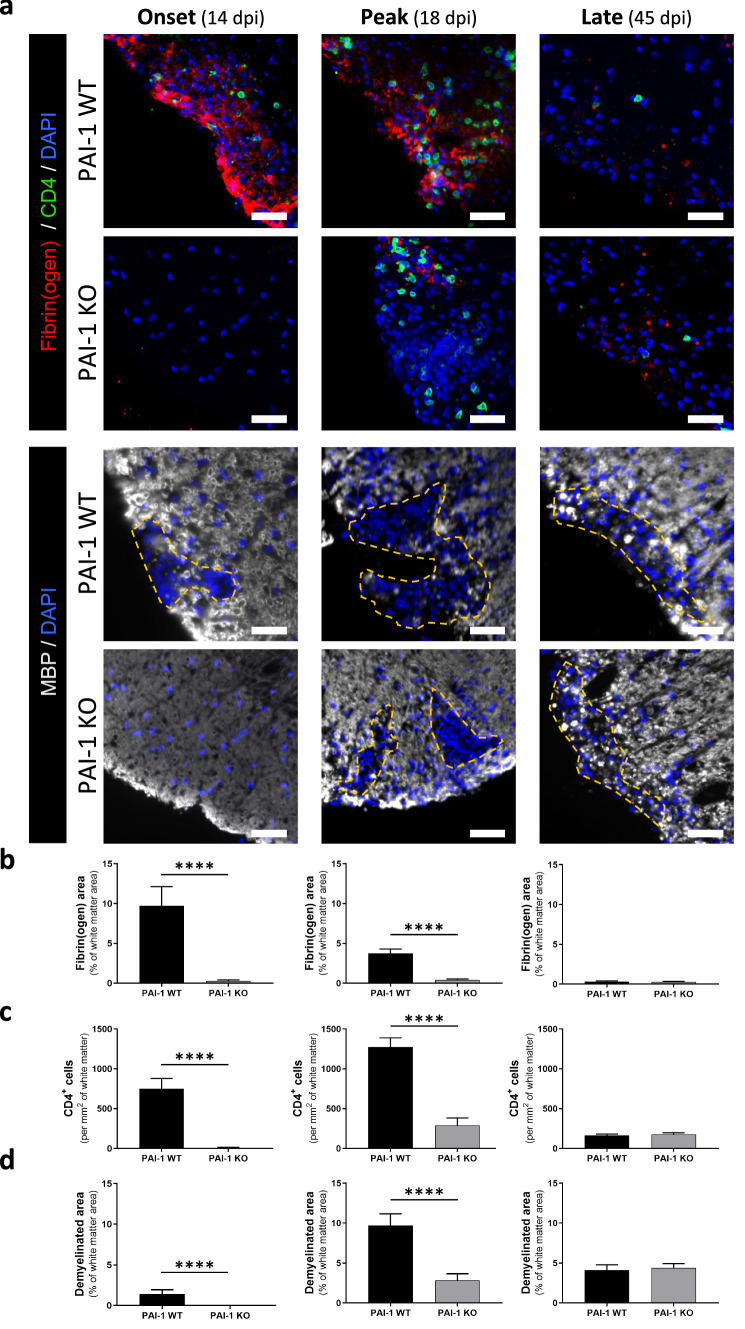
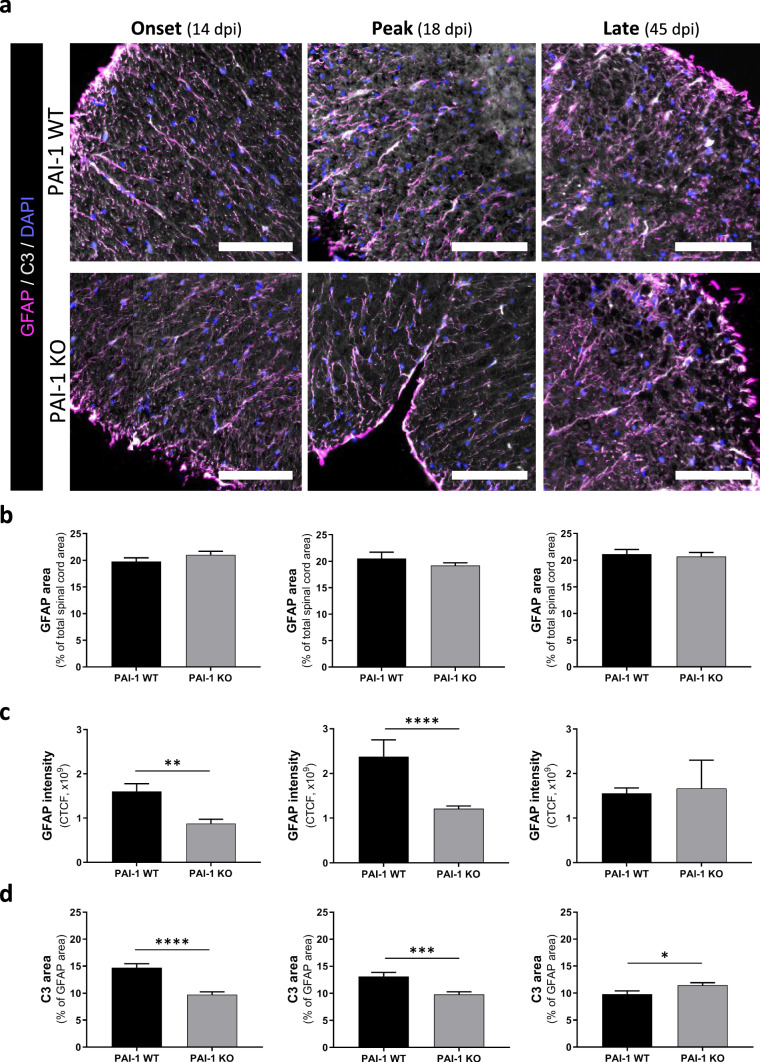
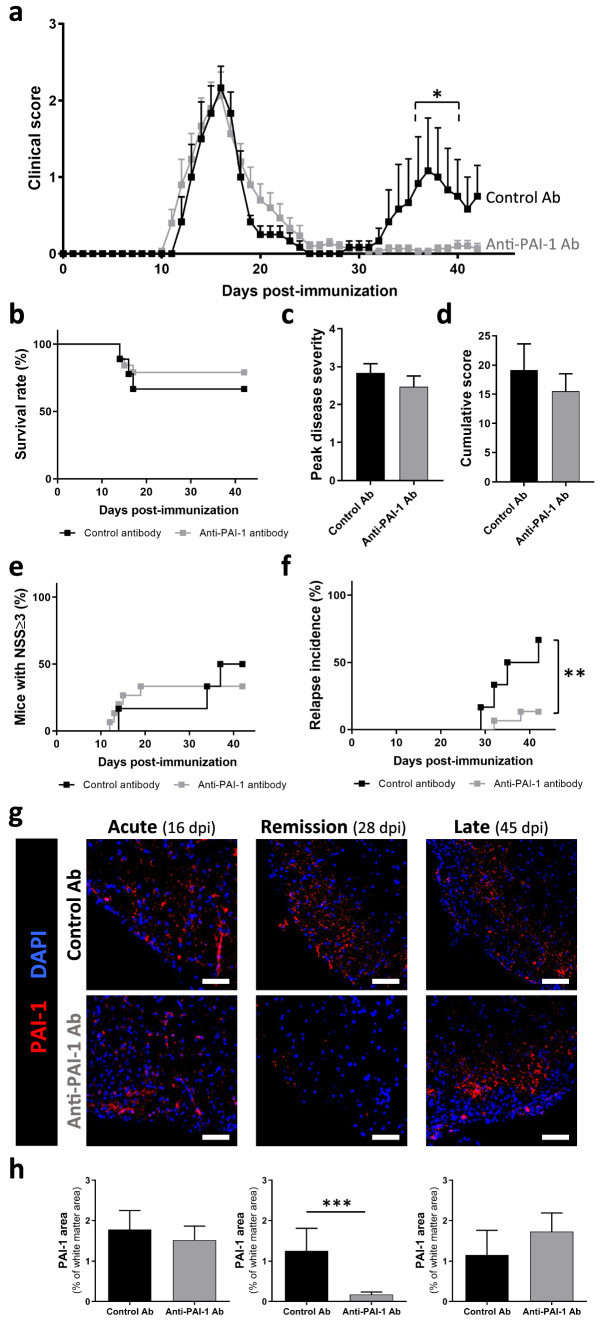
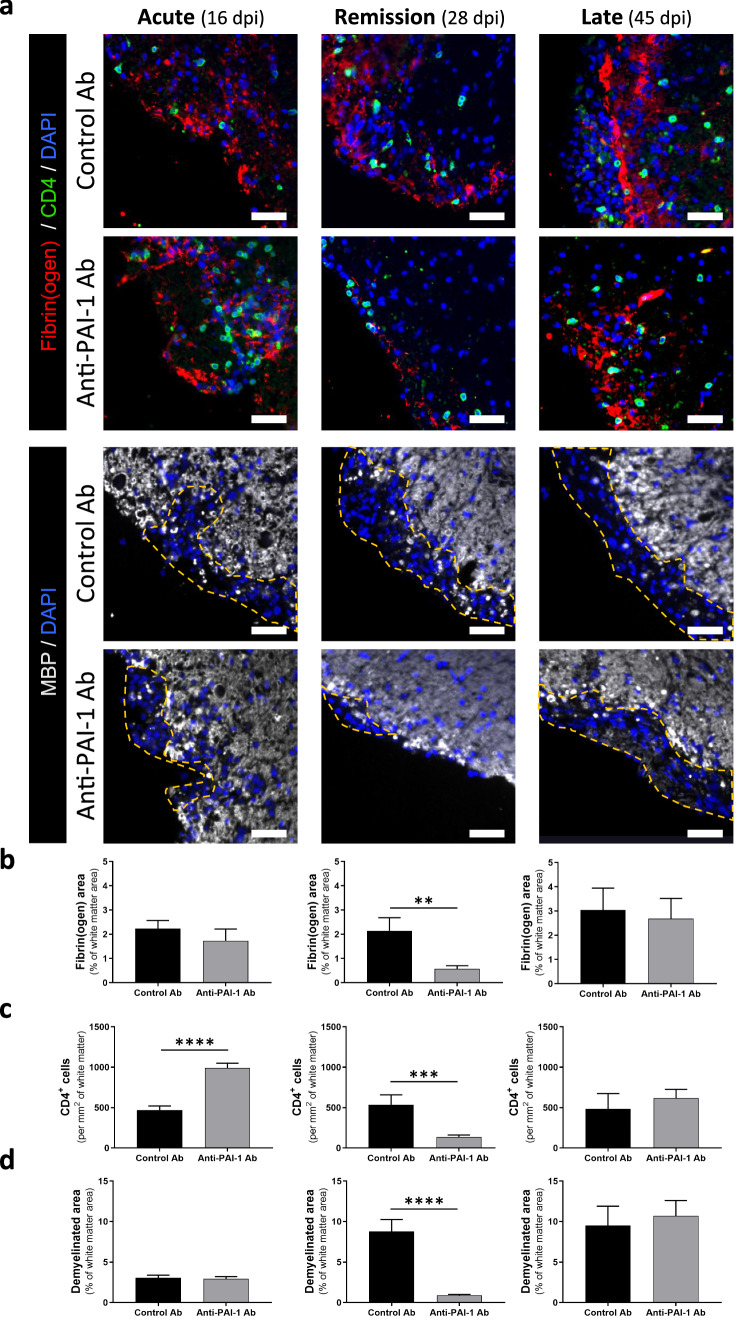
Results: We report a striking overexpression of PAI-1 in reactive astrocytes during symptomatic phases, in two EAE mouse models of MS. This increase is concomitant with lymphocyte infiltration and fibrin(ogen) deposits in CNS parenchyma. By genetic invalidation of PAI-1 in mice and immunotherapy using a blocking PAI-1 antibody, we demonstrate that abolition of PAI-1 reduces the severity of EAE and occurrence of relapses in two EAE models. These benefits are correlated with a decrease in fibrin(ogen) deposits, infiltration of T4 lymphocytes, reactive astrogliosis, demyelination and axonal damage.

Conclusion: These results demonstrate that a deleterious overexpression of PAI-1 by reactive astrocytes leads to intra-parenchymal dysfibrinolysis in MS models and anti-PAI-1 strategies could be a new therapeutic perspective for MS.

Keywords: Astrocytes; EAE; Intraparenchymal fibrinolysis; PAI-1.


Conflict of interest statement

The authors declare that they have no competing interests.

Figures

Fig. 1
Fig. 1
Analysis of plasminogen activation system expression reveals a major PAI-1 increase during the EAE course. a Average clinical score evolution in MOG-induced EAE. CNS tissues were harvested from MOG-induced EAE mice at different time points of disease course represented by green dots: pre-onset (Pre-On), onset (On), surge (Su), chronic (Ch). b Heatmap (log2FC) showing expression of PAS genes in the forebrain, cerebellum and spinal cord during the course of MOG-induced EAE. c PAI-1 expression (RT-qPCR) in the spinal cord during the course of MOG-induced EAE. d Average clinical score evolution in PLP-induced EAE. CNS tissues were harvested at different time points represented by green dots: score = Sc, score 2 remitting (Sc2R), remission (Rem) and relapse (Rel). e Heatmap (log2FC) of PAS genes expression in the forebrain, cerebellum and spinal cord during the course of PLP-induced EAE. f PAI-1 expression (RT-qPCR) in the spinal cord during the course of PLP-induced EAE. g Representative images of PAI-1 immunostaining (red) in the lumbar region of white matter spinal cord from sham and symptomatic MOG-induced EAE mice (DAPI: blue). h, i Quantification of PAI-1 positive area in the total spinal cord as percentage of white matter area (h) and in the cervical, high thoracic, low thoracic, lumbar sections (i) from sham and MOG-induced EAE animals. j Representative images of PAI-1 immunostaining (red) in the lumbar region of white matter spinal cord from sham and symptomatic PLP-induced EAE mice (DAPI: blue). k, l Quantification of PAI-1-positive area in the total spinal cord as percentage of white matter area (k) and in the cervical, high thoracic, low thoracic, lumbar sections (l) from sham and PLP-induced EAE animals. Data are represented as mean ± SEM, n = 5 or n = 3 per condition (for RT-qPCR or for immunohistochemistry, respectively). c, f, h, k Kruskal–Wallis test followed by FDR post hoc test with *, §, # indicating significant difference (p < 0.05) compared to sham, Pre-On and Rem, respectively. i, l Two-way ANOVA test followed by FDR post hoc test with € indicating significant difference (p < 0.05) between the lumbar and all other levels; $ between the lumbar and cervical/high thoracic; ¥ between the lumbar and high/low thoracic; £ between the lumbar and cervical. tPA tissue-type plasminogen activator, NSP neuroserpin, PN-1 protease-nexin 1, TAFI thrombin-activatable fibrinolysis inhibitor, PLG plasminogen, PAI-1 type-1 plasminogen activator inhibitor
Fig. 2
Fig. 2
PAI-1 is already detected at the earliest events of EAE onset. a Experimental design of the discrimination by molecular MRI (MPIO-anti P-selectin) at day 10 post-induction of pre-symptomatic (P-sel+) and non-pre-symptomatic (P-sel) EAE animals. b Representative images of PAI-1 (red), fibrin(ogen) (cyan) and CD4 (T4 lymphocytes, green) immunostaining on the lumbar region of spinal white matter from P-sel and P-sel+ EAE mice (DAPI: blue). c Quantification of PAI-1-positive area in the total spinal cord as percentage of white matter area from P-sel and P-sel+ EAE mice. d, e Representative images (d) of PAI-1 (red) immunostaining and its relative quantification (e) on the lumbar, low thoracic, high thoracic and cervical regions of spinal white matter from P-sel and P-sel+ EAE mice (DAPI: blue). Data are represented as mean ± SEM and analyzed with c Mann–Whitney U test and a two-way ANOVA. Two-way ANOVA test followed by FDR post hoc test with € indicating significant difference (p < 0.05) between the lumbar and all other levels; Δ significant difference (p < 0.05) between the low thoracic and cervical/high thoracic. *p < 0.05, and ****p < 0.0001. n = 3 per condition. Scale bars: 20 µm
Fig. 3
Fig. 3
PAI-1 is expressed in activated astrocytes. a Representative immunostaining of PAI-1 (red) in combination with a set of inflammatory cell-type markers (green): T4 lymphocytes (CD4); neutrophils (Ly-6G); macrophages/microglia (CD68 and Iba-1) on the lumbar spinal cord from symptomatic EAE mice (DAPI: blue). b Representative immunostaining of PAI-1 (red), Coll-IV (blood vessels, grey) and GFAP (astrocytes, green) on the spinal cord from symptomatic EAE mice (DAPI: blue). c 3D reconstruction (by maximal intensity projection: max) and orthogonal sections of representative confocal imaging of PAI-1 (red) and GFAP (green) immunostaining on the lumbar spinal cord from symptomatic EAE mice (asterisk: nucleus). d, e Representative image of fluorescent in situ hybridization (d) of PAI-1 mRNA (red) and GFAP immunostaining (green) on the lumbar spinal cord from sham and symptomatic EAE mice (DAPI: blue) and its relative quantification (e) as percentage of the total spinal cord area n = 3. Data are represented as mean ± SEM and analyzed with a Mann–Whitney U test. ****p < 0.0001. f Representative immunostaining of PAI-1 (red, arrowhead), GFAP (green, arrow) and C3 (magenta, arrow) on the lumbar spinal cord from symptomatic EAE mice (DAPI: blue). Scale bars: 50 µm in a and upper b; 20 µm in lower b and d; 10 µm in c and f
Fig. 4
Fig. 4
PAI-1-deficient mice develop less severe MOG-induced EAE. a Clinical score evolution, b peak disease severity, c cumulative score over 45 days, d day of onset, e incidence of onset, f mice with neurological severity score (NSS) ≥ 3 and g mice with NSS ≤ 1 of MOG-induced EAE in PAI-1 WT (n = 19) and PAI-1 KO (n = 20) mice. Data are represented as mean ± SEM and analyzed with a two-way ANOVA, b-d Mann–Whitney U test and e–g log-rank (Mantel–Cox) test. *p < 0.05; **p < 0.01, ***p < 0.001, and ****p < 0.0001
Fig. 5
Fig. 5
PAI-1 KO mice exhibit less fibrin(ogen) deposits, CD4+ cells infiltration and demyelination at early stages of MOG-induced EAE. a Representative immunostaining of fibrin(ogen; red), CD4 (yellow) and myelin (MBP, grey) in the lumbar spinal cord from PAI-1 WT and PAI-1 KO mice at onset (14 dpi), peak (18 dpi) and late stages (45 dpi) during MOG-induced EAE, (DAPI: blue). Demyelinated areas are defined by the dashed yellow line. Corresponding quantifications of b fibrin(ogen) deposits, c CD4+ cell infiltration and d demyelination. Data are represented as mean ± SEM. n = 3 per condition. Mann–Whitney U test; ****p < 0.0001. Scale bars: 50 µm
Fig. 6
Fig. 6
PAI-1 KO mice exhibit less reactive astrogliosis of MOG-induced EAE mice. a Representative immunostaining of GFAP (magenta) and C3 (grey) in the spinal cord from PAI-1 WT and PAI-1 KO mice at onset (14 dpi), peak (18 dpi) and late stages (45 dpi) during MOG-induced EAE (DAPI: blue). At 14, 18 and 45 dpi, the spinal cord region is, respectively, the low thoracic, lumbar and cervical area. b-d Corresponding quantifications of (b) GFAP area, (c) GFAP intensity and (d) C3 area in astrocytes (GFAP positive area). CTCF: corrected total cell fluorescence. Data are represented as mean ± SEM. n = 3 per condition Mann–Whitney U test; *p < 0.05; **p < 0.01, ***p < 0.001, and ****p < 0.0001. Scale bars: 40 µm
Fig. 7
Fig. 7
Intracisternal administration of anti-PAI-1 antibody abolish EAE relapses of PLP-induced EAE mice. a Clinical score evolution, b survival curves, c peak disease severity, d cumulative score, e incidence of mice with NSS ≥ 3 and f incidence of relapse for PLP-induced EAE animals treated with control antibody (n = 9) or anti-PAI-1 antibody (MA-MP6H6; n = 19). Antibodies were administered in the cisterna magna at the day of EAE onset. g Representative immunostaining of PAI-1 in the high thoracic spinal cord from PLP-induced EAE animals treated with control antibody or anti-PAI-1 antibody at acute (16 dpi), remission (28 dpi) and late stages (45 dpi) during PLP-induced EAE (DAPI: blue) and h the PAI-1 positive area quantification in the total spinal cord as percentage of white matter area (n = 3). Data are represented as mean ± SEM and analyzed with a Two-way ANOVA followed by FDR test, b, e, f log-rank (Mantel–Cox) test and c, d, h Mann–Whitney U test *p < 0.05; **p < 0.01, ***p < 0.001. Scale bars: 20 µm
Fig. 8
Fig. 8
Immunotherapy targeting PAI-1 improves pathological signs of PLP-induced EAE animals. a Representative immunostaining of fibrin(ogen) (red), CD4 (yellow) and myelin (MBP, grey) in the spinal cord from control and anti-PAI-1 antibody-treated mice at acute (16 dpi), remission (28 dpi) and late stages (45 dpi) during PLP-induced EAE, (DAPI: blue). Demyelinated areas are defined by the dashed yellow line. The representative images for acute stages are from the cervical region and for remission and late stages are from the lumbar area. Corresponding quantifications of b fibrin(ogen) deposits, c CD4+ cells infiltration and d demyelination. Data are represented as mean ± SEM. n = 3 per condition. Mann–Whitney U test. **p < 0.01; ***p < 0.001. Scale bars: 50 µm

References

    1. Petersen MA, Ryu JK, Akassoglou K. Fibrinogen in neurological diseases: mechanisms, imaging and therapeutics. Nat Rev Neurosci. 2018;19(5):283–301. doi: 10.1038/nrn.2018.13. - DOI - PMC - PubMed
    1. Gveric D, Hanemaaijer R, Newcombe J, van Lent NA, Sier CF, Cuzner ML. Plasminogen activators in multiple sclerosis lesions: implications for the inflammatory response and axonal damage. Brain. 2001;124(Pt 10):1978–1988. doi: 10.1093/brain/124.10.1978. - DOI - PubMed
    1. Gveric D, Herrera B, Petzold A, Lawrence DA, Cuzner ML. Impaired fibrinolysis in multiple sclerosis: a role for tissue plasminogen activator inhibitors. Brain. 2003;126(Pt 7):1590–1598. doi: 10.1093/brain/awg167. - DOI - PubMed
    1. Ryu JK, Petersen MA, Murray SG, Baeten KM, Meyer-Franke A, Chan JP, et al. Blood coagulation protein fibrinogen promotes autoimmunity and demyelination via chemokine release and antigen presentation. Nat Commun. 2015;6:8164. doi: 10.1038/ncomms9164. - DOI - PMC - PubMed
    1. Docagne F, Nicole O, Marti HH, MacKenzie ET, Buisson A, Vivien D. Transforming growth factor-beta1 as a regulator of the serpins/t-PA axis in cerebral ischemia. FASEB J. 1999;13(11):1315–1324. doi: 10.1096/fasebj.13.11.1315. - DOI - PubMed