

Modulation of Gut Microbiota by Magnesium Isoglycyrrhizinate Mediates Enhancement of Intestinal Barrier Function and Amelioration of Methotrexate-Induced Liver Injury
- PMID: 35634319
- PMCID: PMC9134347
- DOI: 10.3389/fimmu.2022.874878
Modulation of Gut Microbiota by Magnesium Isoglycyrrhizinate Mediates Enhancement of Intestinal Barrier Function and Amelioration of Methotrexate-Induced Liver Injury
Erratum in
-
Erratum: Modulation of Gut Microbiota by Magnesium Isoglycyrrhizinate Mediates Enhancement of Intestinal Barrier Function and Amelioration of Methotrexate-Induced Liver Injury.Front Immunol. 2022 Jul 4;13:976502. doi: 10.3389/fimmu.2022.976502. eCollection 2022. Front Immunol. 2022. PMID: 35860282 Free PMC article.
Abstract
Background: The gut-liver axis plays a crucial role in various liver diseases. Therefore, targeting this crosstalk may provide a new treatment strategy for liver diseases. However, the exact mechanism underlying this crosstalk and its impact on drug-induced liver injury (DILI) requires clarification.
Aim: This study aimed to investigate the potential mechanism and therapeutic effect of MgIG on MTX-induced liver injury, which is associated with the gut-liver axis and gut microbiota.
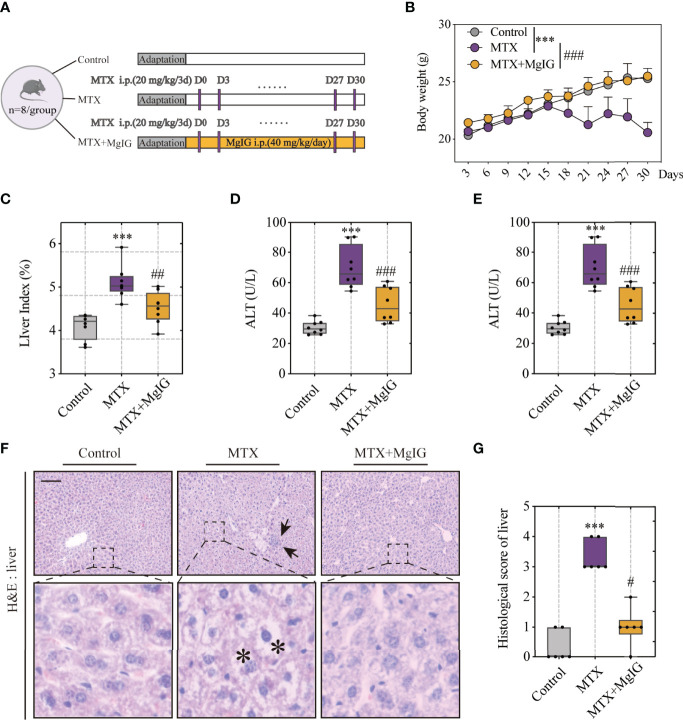
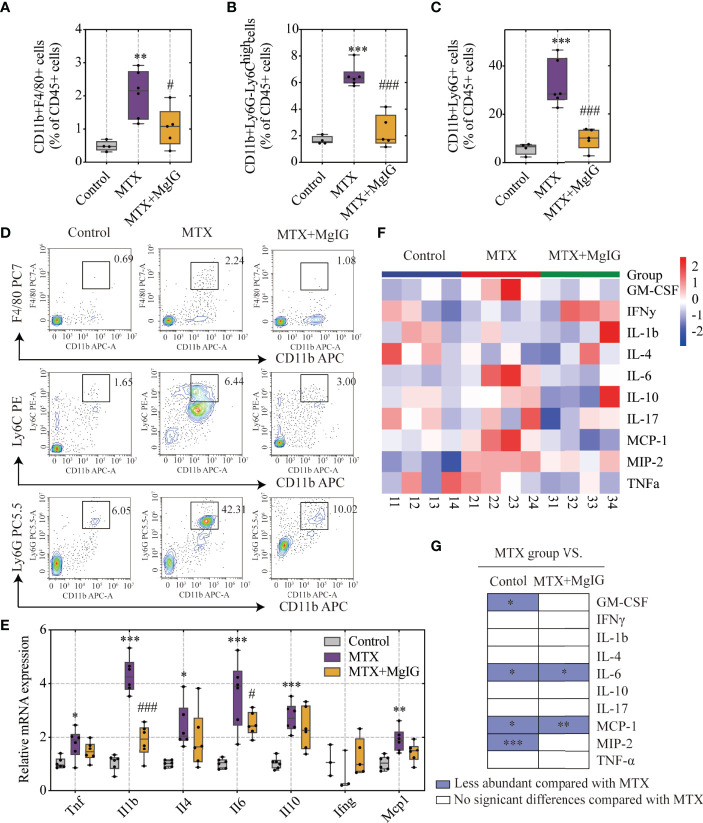
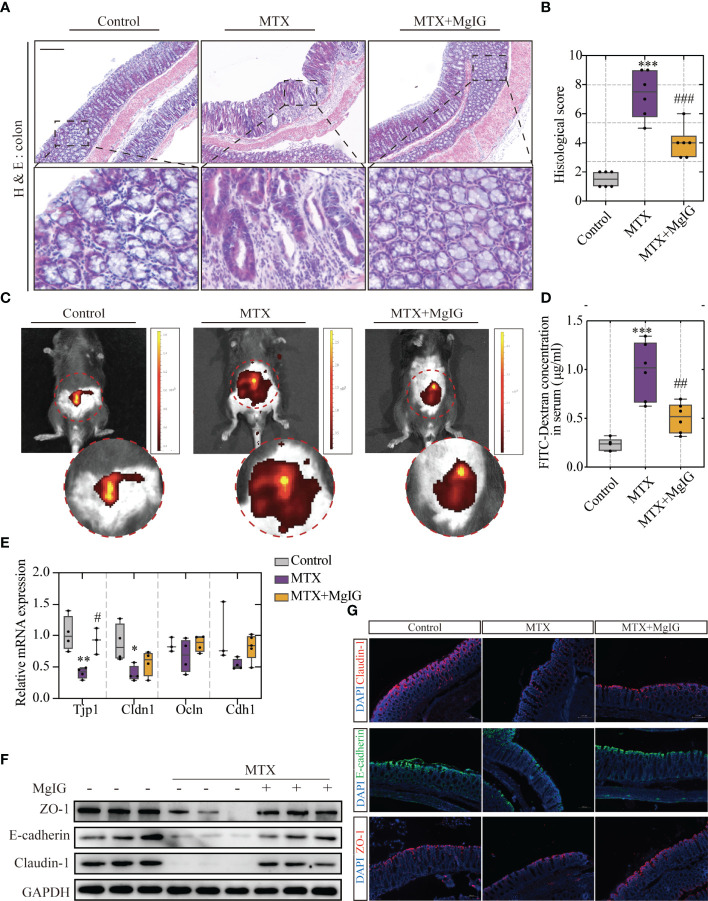
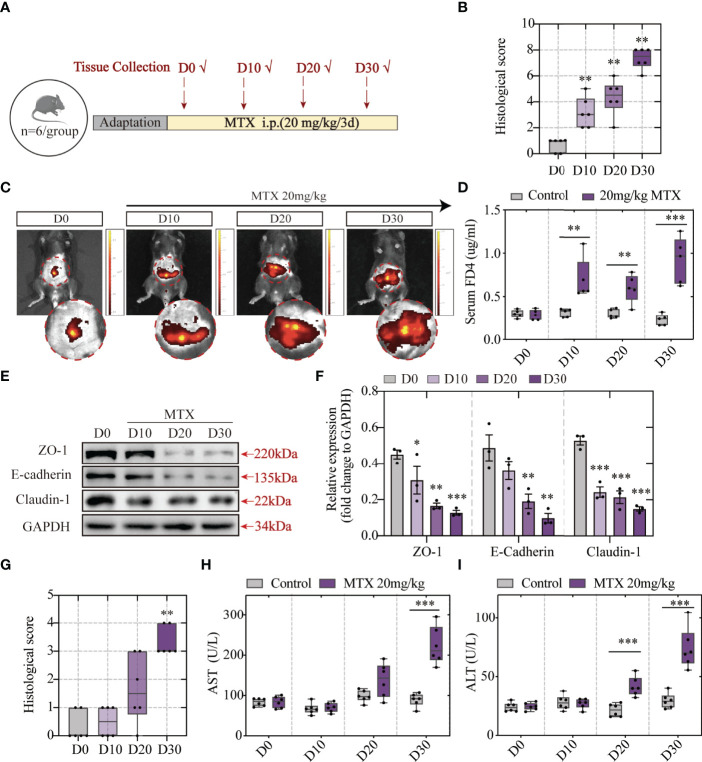
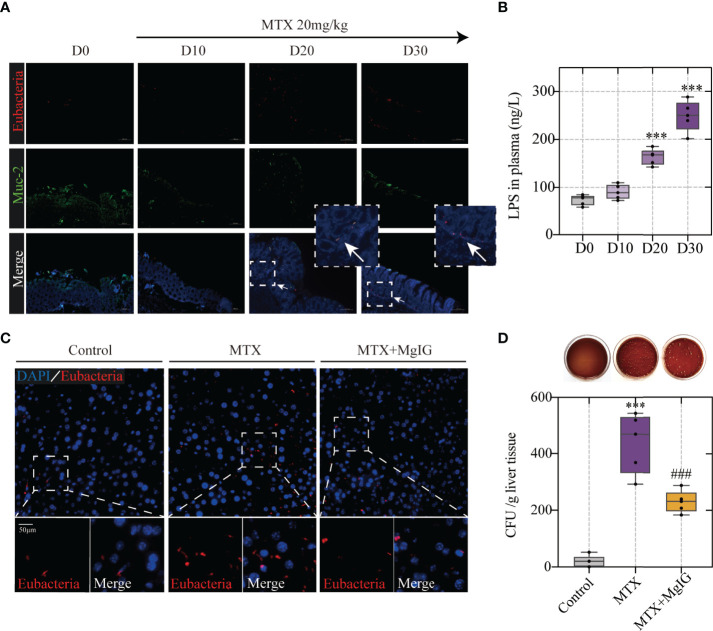
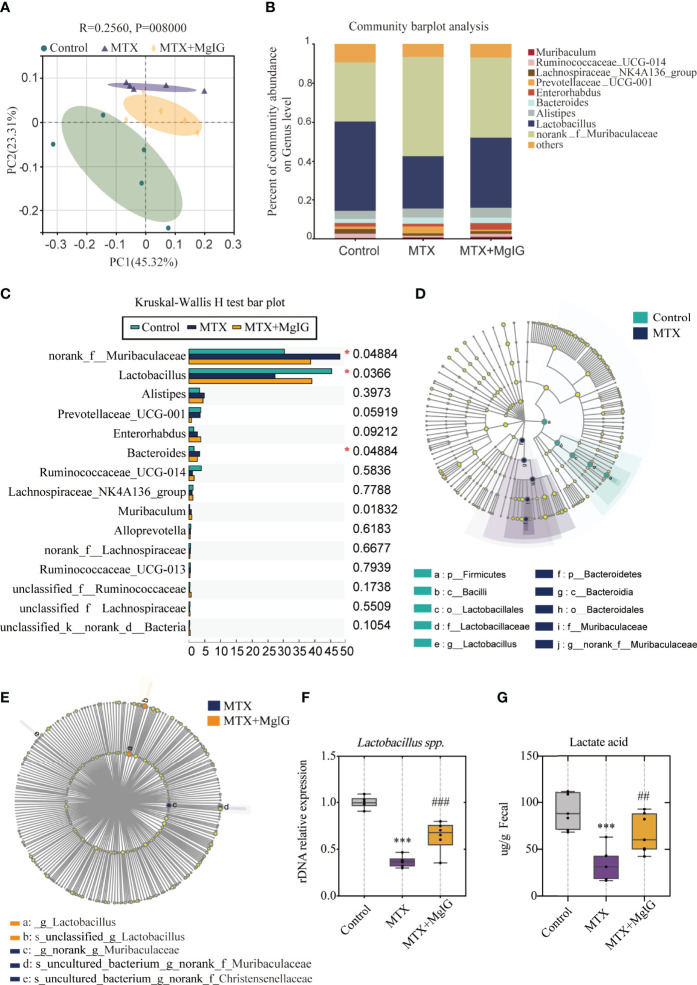
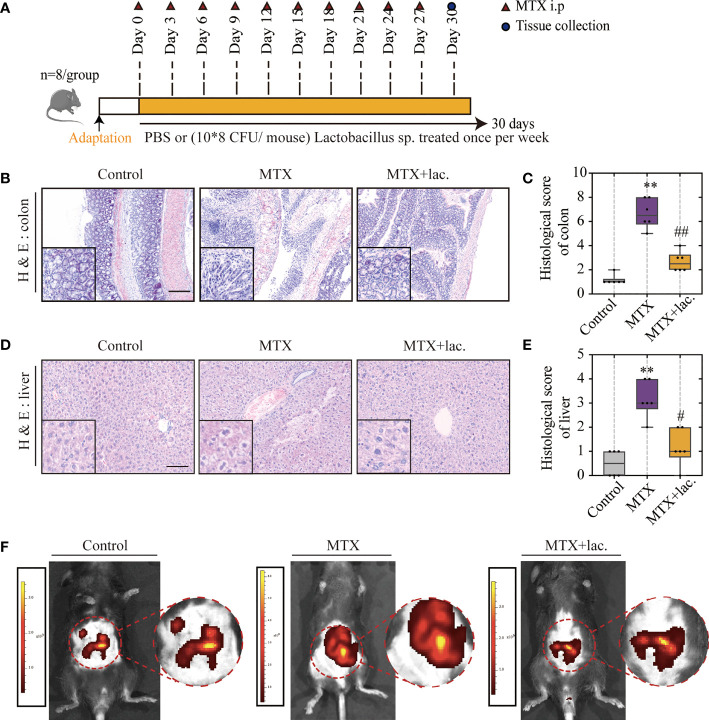
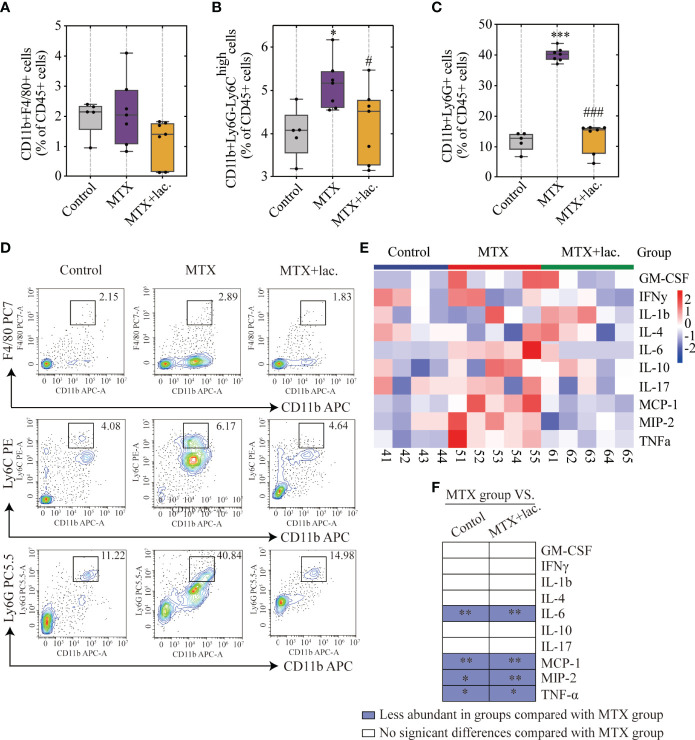
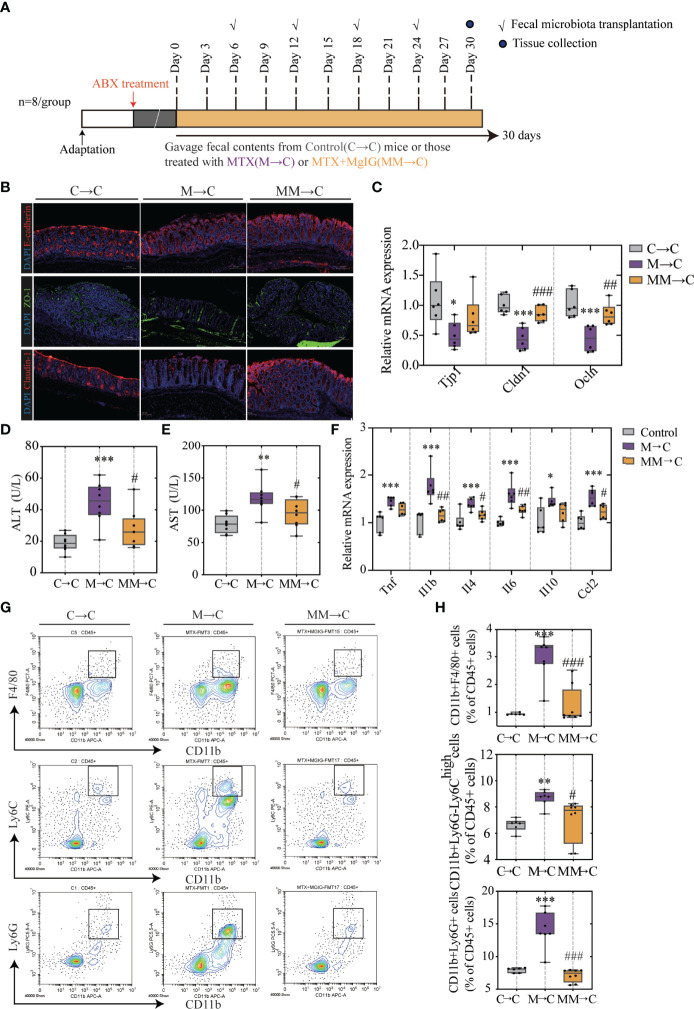
Methods: An MTX-induced liver injury model was generated after 20-mg/kg/3d MTX application for 30 days. Meanwhile, the treatment group was treated with 40-mg/kg MgIG daily. Histological examination, aminotransferase, and aspartate aminotransferase enzyme levels were estimated to evaluate liver function. Immune cells infiltration and inflammatory cytokines were detected to indicate inflammation levels. Colon histological score, intestinal barrier leakage, and expression of tight junctions were employed to assess the intestinal injury. Bacterial translocation was observed using fluorescent in situ hybridisation, colony-forming unit counting, and lipopolysaccharide detection. Alterations in gut microbial composition were analysed using 16s rDNA sequencing and relative quantitative polymerase chain reaction. Short-chain-fatty-acids and lactic acid concentrations were then utilized to validate changes in metabolites of specific bacteria. Lactobacillus sp. supplement and fecal microbiota transplantation were used to evaluate gut microbiota contribution.
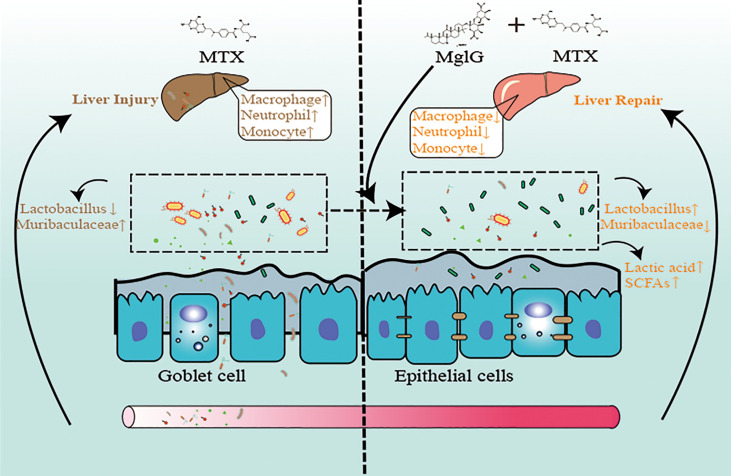
Results: MTX-induced intestinal and liver injuries were significantly alleviated using MgIG treatment. Bacterial translocation resulting from the intestinal barrier disruption was considered a crucial cause of MTX-induced liver injury and the therapeutic target of MgIG. Moreover, MgIG was speculated to have changed the gut microbial composition by up-regulating probiotic Lactobacillus and down-regulating Muribaculaceae, thereby remodelling the intestinal barrier and inhibiting bacterial translocation.
Conclusion: The MTX-induced intestinal barrier was protected owing to MgIG administration, which reshaped the gut microbial composition and inhibited bacterial translocation into the liver, thus attenuating MTX-related DILI.
Keywords: bacterial translocation; gut microbiota; gut-liver axis; magnesium isoglycyrrhizinate; methotrexate.
Copyright © 2022 Xia, Shi, Qian, Han, Lu, Tao, Gu, Zhao, Wei and Lu.
Conflict of interest statement
The authors declare that the research was conducted in the absence of any commercial or financial relationships that could be construed as a potential conflict of interest.
Figures
Similar articles
-
Magnesium Isoglycyrrhizinate Attenuates Anti-Tuberculosis Drug-Induced Liver Injury by Enhancing Intestinal Barrier Function and Inhibiting the LPS/TLRs/NF-κB Signaling Pathway in Mice.Pharmaceuticals (Basel). 2022 Sep 9;15(9):1130. doi: 10.3390/ph15091130. Pharmaceuticals (Basel). 2022. PMID: 36145350 Free PMC article.
-
New strain of Pediococcus pentosaceus alleviates ethanol-induced liver injury by modulating the gut microbiota and short-chain fatty acid metabolism.World J Gastroenterol. 2020 Oct 28;26(40):6224-6240. doi: 10.3748/wjg.v26.i40.6224. World J Gastroenterol. 2020. PMID: 33177795 Free PMC article.
-
The hepatoprotective effects of XCHD and MgIG against methotrexate-induced liver injury and inflammation in rats through suppressing the activation of AIM2 inflammasomes.Pathol Res Pract. 2020 Apr;216(4):152875. doi: 10.1016/j.prp.2020.152875. Epub 2020 Feb 26. Pathol Res Pract. 2020. PMID: 32113793
-
Contribution of gut microbiota to drug-induced liver injury.Hepatobiliary Pancreat Dis Int. 2023 Oct;22(5):458-465. doi: 10.1016/j.hbpd.2023.06.008. Epub 2023 Jun 13. Hepatobiliary Pancreat Dis Int. 2023. PMID: 37365109 Review.
-
Role of Gut Microecology in the Pathogenesis of Drug-Induced Liver Injury and Emerging Therapeutic Strategies.Molecules. 2024 Jun 4;29(11):2663. doi: 10.3390/molecules29112663. Molecules. 2024. PMID: 38893536 Free PMC article. Review.
Cited by
-
Magnesium and the Hallmarks of Aging.Nutrients. 2024 Feb 9;16(4):496. doi: 10.3390/nu16040496. Nutrients. 2024. PMID: 38398820 Free PMC article. Review.
-
Hypomagnesemia: exploring its multifaceted health impacts and associations with blood pressure regulation and metabolic syndrome.Diabetol Metab Syndr. 2025 Jun 16;17(1):217. doi: 10.1186/s13098-025-01772-y. Diabetol Metab Syndr. 2025. PMID: 40524199 Free PMC article. Review.
-
The Protective Effects of Nutraceutical Components in Methotrexate-Induced Toxicity Models-An Overview.Microorganisms. 2022 Oct 18;10(10):2053. doi: 10.3390/microorganisms10102053. Microorganisms. 2022. PMID: 36296329 Free PMC article. Review.
-
Interactions between Dietary Micronutrients, Composition of the Microbiome and Efficacy of Immunotherapy in Cancer Patients.Cancers (Basel). 2022 Nov 14;14(22):5577. doi: 10.3390/cancers14225577. Cancers (Basel). 2022. PMID: 36428677 Free PMC article. Review.
-
Treatment of Drug-Induced Liver Injury.Biomedicines. 2022 Dec 21;11(1):15. doi: 10.3390/biomedicines11010015. Biomedicines. 2022. PMID: 36672522 Free PMC article. Review.
References
-
- Palsson-McDermott EM, Curtis AM, Goel G, Lauterbach MA, Sheedy FJ, Gleeson LE, et al. . Pyruvate Kinase M2 Regulates Hif-1α Activity and IL-1β Induction and is a Critical Determinant of the Warburg Effect in LPS-Activated Macrophages. Cell Metab (2015) 21(1):65–80. doi: 10.1016/j.cmet.2014.12.005 - DOI - PMC - PubMed
Publication types
MeSH terms
Substances
LinkOut - more resources
Full Text Sources
Other Literature Sources
Medical