

Primary Trophoblast Cultures: Characterization of HLA Profiles and Immune Cell Interactions
- PMID: 35634345
- PMCID: PMC9136060
- DOI: 10.3389/fimmu.2022.814019
Primary Trophoblast Cultures: Characterization of HLA Profiles and Immune Cell Interactions
Abstract
Introduction: Trophoblasts are essential in fetal-maternal interaction during pregnancy. The goal was to study HLA profiles of primary trophoblasts derived from placentas, and to investigate their usefulness in studying interaction with immune cells.
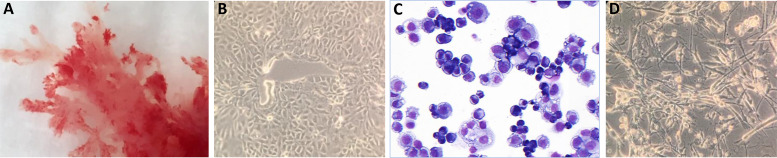
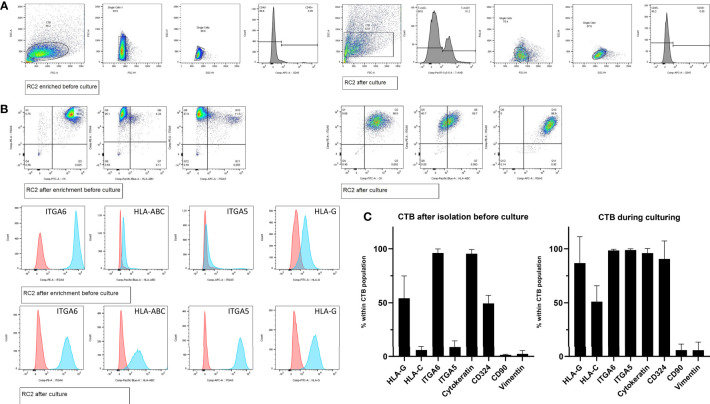
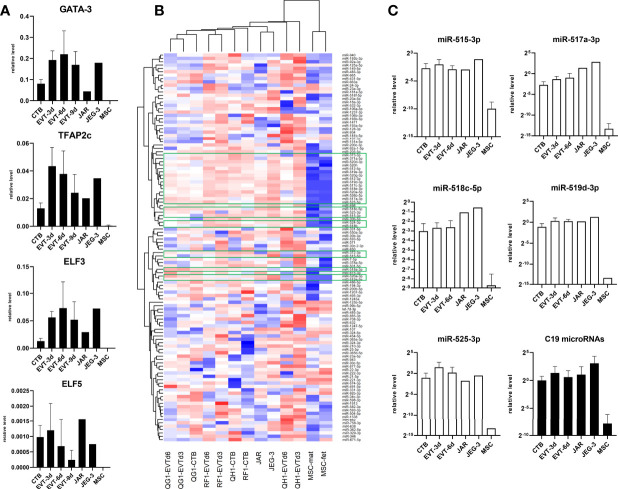
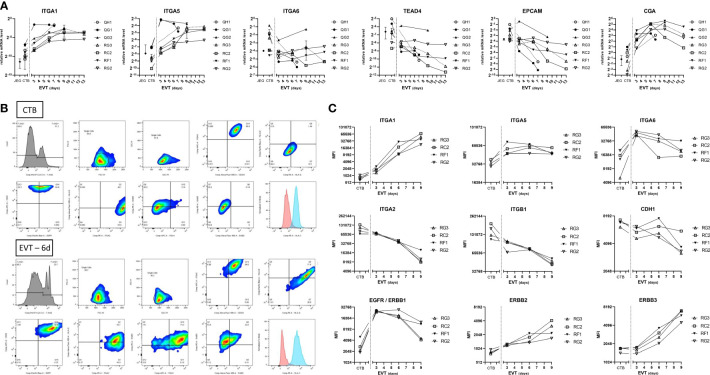
Methods: After enzymatic digestion of first-trimester placental tissue from seven donors (6-9 weeks gestation) and trophoblast enrichment we cultured cytotrophoblasts (CTB) in stem cell medium. CTB were differentiated into EVT in a Matrigel-containing medium. A subset of CTB/EVT was profiled for microRNA levels. Expression of classical HLA molecules and of HLA-G was studied by flow cytometry, qPCR, and ELISA. Secondary trophoblast cell lines JAR and JEG-3 were studied as controls. Lymphocytes were investigated during co-culturing with EVT.
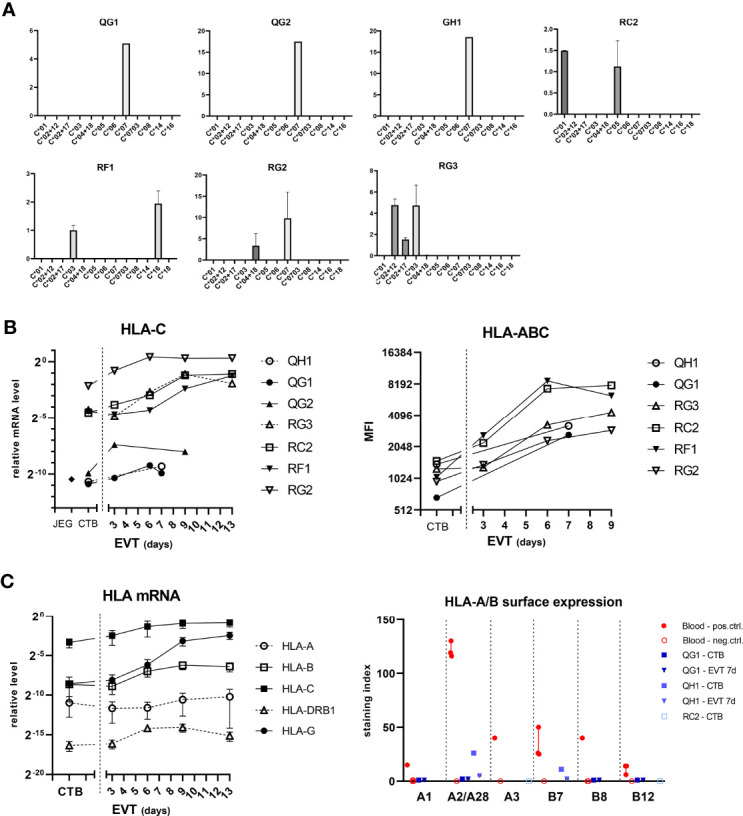
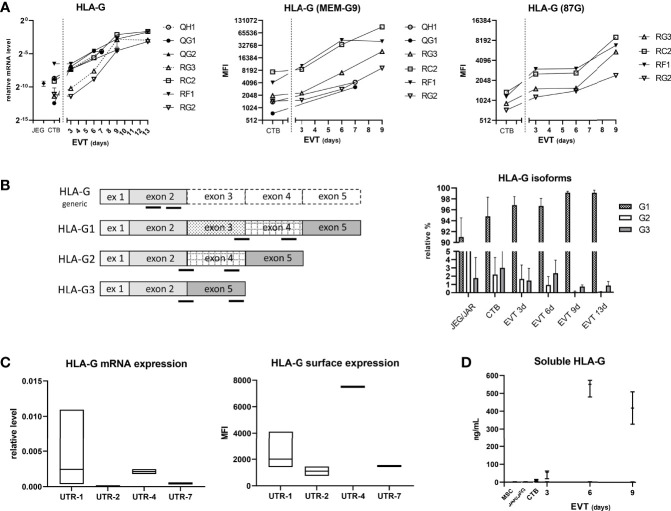
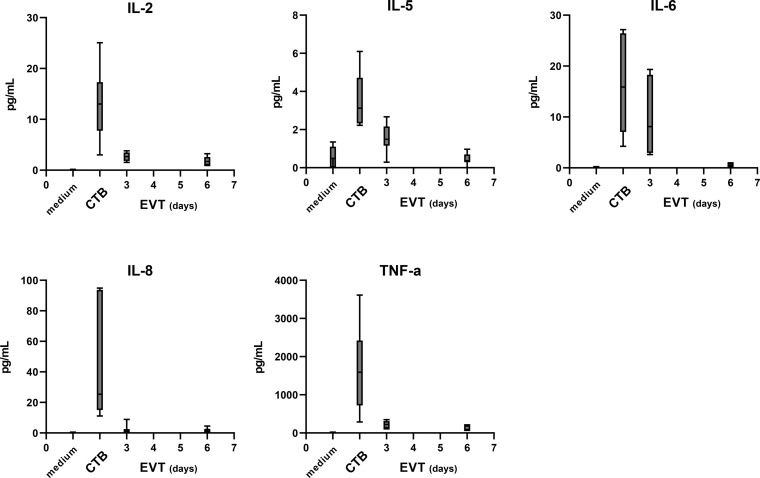
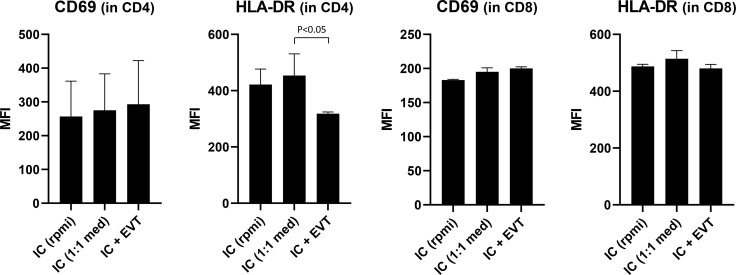
Results: The trophoblasts could be easily maintained for several passages, upregulated classical trophoblast markers (GATA3, TFAP2C, chromosome-19 microRNAs), and upon differentiation to EVT they were selective in expressing HLA-C. EVT showed increasing expression of total HLA-G, an increasing proportion of HLA-G1 over G2- and G3 isoforms, and elevated excretion of soluble HLA-G. These features were distinct from those of the secondary trophoblast cell lines. TNF-α and IL-8 represented the most abundantly secreted cytokines by CTB, but their levels were minimal in EVT cultures. As proof of principle, we showed that EVT affect lymphocytes in three-day co-cultures (n=4) by decreasing activation marker HLA-DR.
Conclusion: We verified the possibility culturing trophoblasts from first-term placentas, and their capability of differentiating to HLA-G expressing EVT. This culture model better represents the in-vivo situation than previously studied secondary trophoblast cell lines and enables mechanistic studies of fetal-maternal interactions.
Keywords: HLA-G; culturing; differentiation; immune cell; placenta; pregnancy; stem cell; trophoblast.
Copyright © 2022 Eikmans, van der Keur, Anholts, Drabbels, van Beelen, de Sousa Lopes and van der Hoorn.
Conflict of interest statement
The authors declare that the research was conducted in the absence of any commercial or financial relationships that could be construed as a potential conflict of interest.
Figures
Similar articles
-
ADAM8 localizes to extravillous trophoblasts within the maternal-fetal interface and potentiates trophoblast cell line migration through a β1 integrin-mediated mechanism.Mol Hum Reprod. 2018 Oct 1;24(10):495-509. doi: 10.1093/molehr/gay034. Mol Hum Reprod. 2018. PMID: 30124911 Free PMC article.
-
Application of a JEG-3 organoid model to study HLA-G function in the trophoblast.Front Immunol. 2023 Mar 15;14:1130308. doi: 10.3389/fimmu.2023.1130308. eCollection 2023. Front Immunol. 2023. PMID: 37006248 Free PMC article.
-
Definitive class I human leukocyte antigen expression in gestational placentation: HLA-F, HLA-E, HLA-C, and HLA-G in extravillous trophoblast invasion on placentation, pregnancy, and parturition.Am J Reprod Immunol. 2017 Jun;77(6). doi: 10.1111/aji.12643. Epub 2017 Feb 10. Am J Reprod Immunol. 2017. PMID: 28185362
-
Revealing the molecular landscape of human placenta: a systematic review and meta-analysis of single-cell RNA sequencing studies.Hum Reprod Update. 2024 Jul 1;30(4):410-441. doi: 10.1093/humupd/dmae006. Hum Reprod Update. 2024. PMID: 38478759 Free PMC article.
-
The Dual Role of HLA-C in Tolerance and Immunity at the Maternal-Fetal Interface.Front Immunol. 2019 Dec 9;10:2730. doi: 10.3389/fimmu.2019.02730. eCollection 2019. Front Immunol. 2019. PMID: 31921098 Free PMC article. Review.
Cited by
-
Apoptotic Receptors and CD107a Expression by NK Cells in an Interaction Model with Trophoblast Cells.Curr Issues Mol Biol. 2024 Aug 16;46(8):8945-8957. doi: 10.3390/cimb46080528. Curr Issues Mol Biol. 2024. PMID: 39194745 Free PMC article.
-
The Mac Is Back: The Role of Macrophages in Human Healthy and Complicated Pregnancies.Int J Mol Sci. 2023 Mar 10;24(6):5300. doi: 10.3390/ijms24065300. Int J Mol Sci. 2023. PMID: 36982375 Free PMC article. Review.
-
Identification of transcription factors that regulate placental sFLT1 expression.Mol Hum Reprod. 2025 Jul 3;31(3):gaaf031. doi: 10.1093/molehr/gaaf031. Mol Hum Reprod. 2025. PMID: 40632597 Free PMC article.
-
Establishment and comparison of human term placenta-derived trophoblast cells†.Biol Reprod. 2024 May 9;110(5):950-970. doi: 10.1093/biolre/ioae026. Biol Reprod. 2024. PMID: 38330185 Free PMC article.
-
How the Soluble Human Leukocyte Antigen-G levels in Amniotic Fluid and Maternal Serum Correlate with the Feto-Placental Growth in Uncomplicated Pregnancies.Bioengineering (Basel). 2024 May 18;11(5):509. doi: 10.3390/bioengineering11050509. Bioengineering (Basel). 2024. PMID: 38790375 Free PMC article.
References
-
- Apps R, Murphy SP, Fernando R, Gardner L, Ahad T, Moffett A. Human Leucocyte Antigen (HLA) Expression of Primary Trophoblast Cells and Placental Cell Lines, Determined Using Single Antigen Beads to Characterize Allotype Specificities of Anti-HLA Antibodies. Immunology (2009) 127:26–39. doi: 10.1111/j.1365-2567.2008.03019.x - DOI - PMC - PubMed
MeSH terms
Substances
LinkOut - more resources
Full Text Sources
Research Materials