. 2022 May 13:13:808223.
doi: 10.3389/fendo.2022.808223. eCollection 2022.

Small Noncoding RNAome Changes During Human Bone Marrow Mesenchymal Stem Cells Senescence In Vitro

Affiliations

Small Noncoding RNAome Changes During Human Bone Marrow Mesenchymal Stem Cells Senescence In Vitro

Fei Xiao et al. Front Endocrinol (Lausanne). .

Abstract

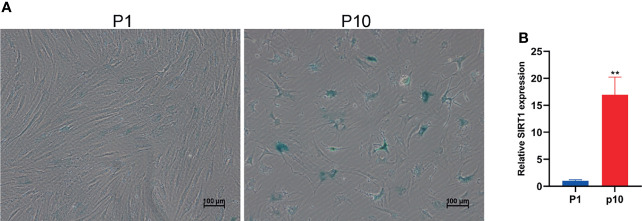
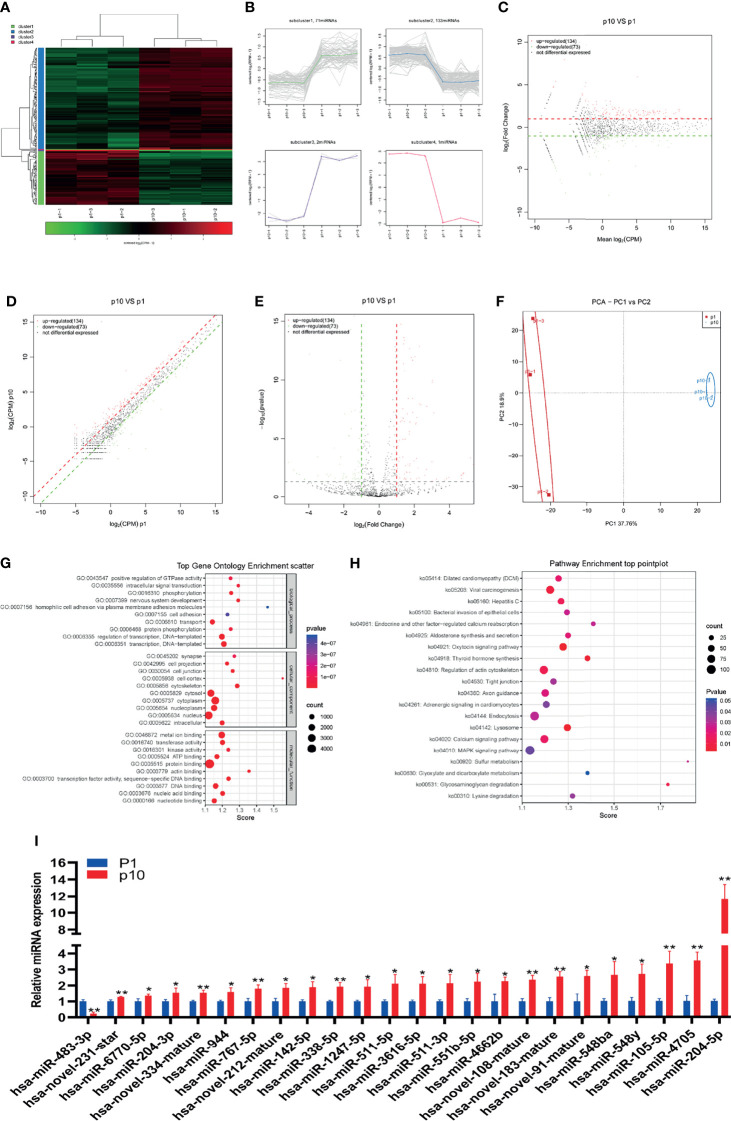
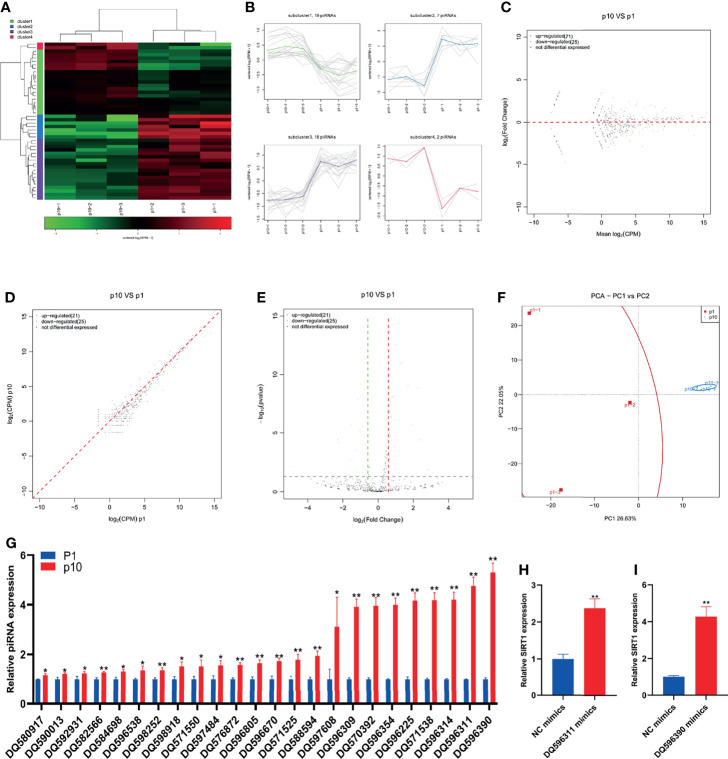
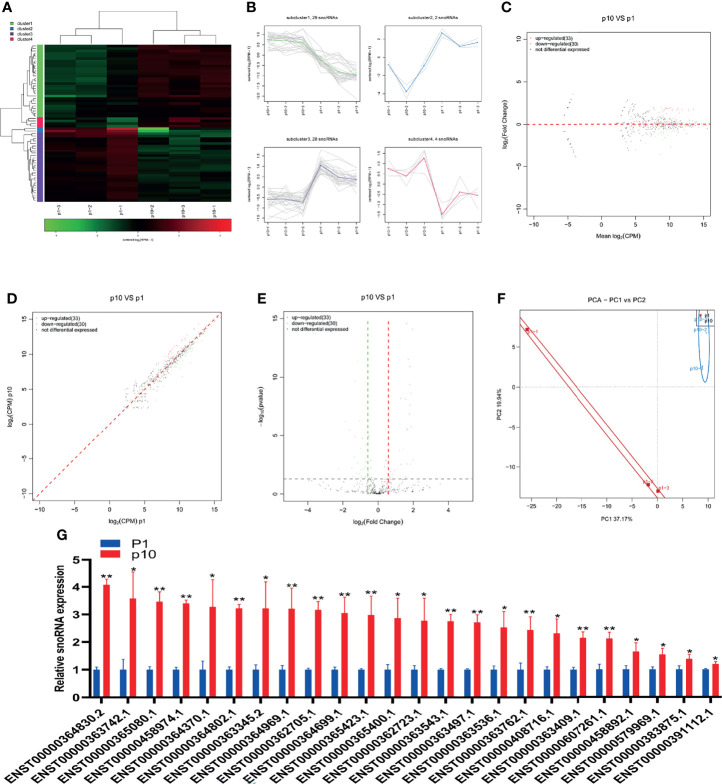
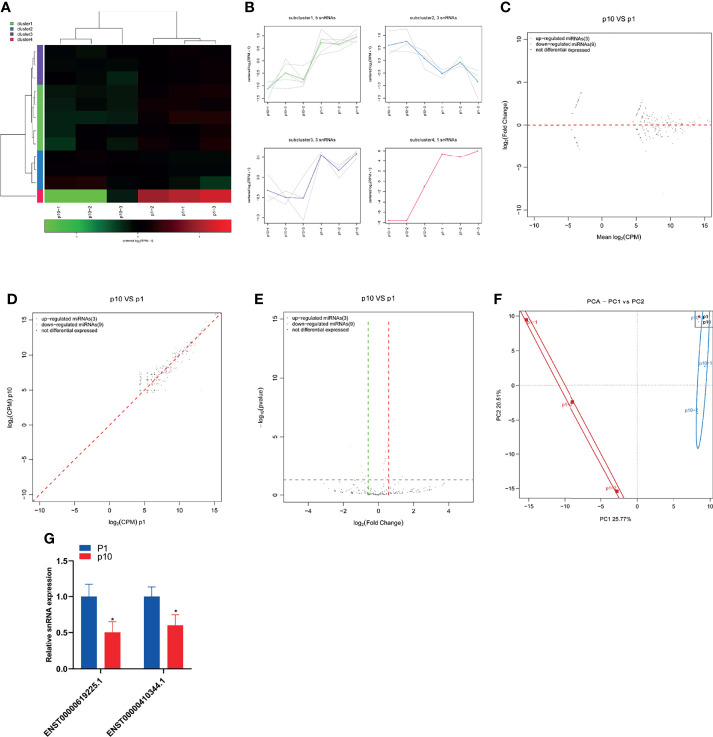
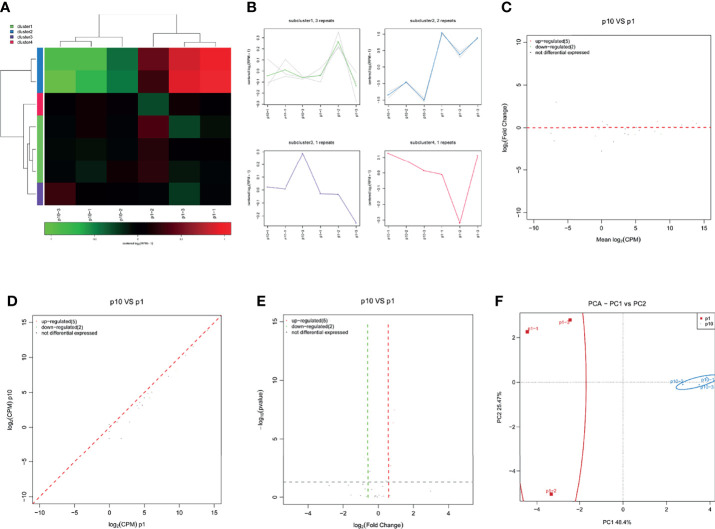
Bone marrow mesenchymal stem cells (BMSCs) have been used in stem cell-based therapy for various diseases due to their self-renewing ability and differentiation potential to various types of cells and immunoprivileged properties. However, the proliferation capability and functionality of BMSCs are known to decline with aging, which severely limits the extensive applications of BMSC-based therapies. To date, the exact mechanism involved in the cellular senescence of BMSCs remains unclear. RNA is thought to be the initial molecular form of life on earth. It also acts as a transmitter and important regulator of genetic information expression. There are many kinds of small noncoding RNAs with different functions in cells that regulate important life activity processes in multiple dimensions, including development process, gene expression, genomic stability, and cellular senescence. In this study, a replicative senescence model of hBMSCs was established and the expression changes of small noncoding RNAs during senescence were detected by small RNA high-throughput sequencing analysis and qPCR. Small RNA sequencing results showed that there were significant differences in the expression of 203 miRNAs, 46 piRNAs, 63 snoRNAs, 12 snRNAs, and 7 rasiRNAs. The results of qPCR, which was performed for the verification of the sequencing results, showed that there were significant differences in the expression of 24 miRNAs, 34 piRNAs, 34 snoRNAs, and 2 snRNAs. These findings might provide a novel insight into hBMSC senescence and contribute to the development of new targeting senescence strategies.

Keywords: bone marrow mesenchymal stem cells; miRNA; piRNA; senescence; snRNA; snoRNA.


Conflict of interest statement

The authors declare that the research was conducted in the absence of any commercial or financial relationships that could be construed as a potential conflict of interest.

Figures

Figure 1
Figure 1
Subculture leads to hBMSC senescence. (A) The staining of β-galactosidase of hBMSCs at passage 1 (P1) and passage 10 (P10). (B) The relative expression of SIRT1 mRNA in hBMSCs at P1 and P10. ** indicated p < 0.01.
Figure 2
Figure 2
Abnormal miRNA expression during hBMSC senescence. (A) A heatmap showing the differential expression of miRNA in hBMSCs at P1 and P10. (B) A subcluster map showing the differential expression of miRNA in hBMSCs at P1 and P10. (C) An MA map showing the differential expression of miRNA in hBMSCs at P1 and P10. (D) A scatter map showing the differential expression of miRNA in hBMSCs at P1 and P10. (E) A volcano map showing the differential expression of miRNA in hBMSCs at P1 and P10. (F) A PCA map showing the differential expression of miRNA in hBMSCs at P1 and P10. (G) Gene ontology analysis in BMSCs at P1 and P10. (H) KEGG analysis in BMSCs at P1 and P10. (I) Differential expression of miRNA in hBMSCs at P1 and P10 detected by qPCR. * indicated p < 0.05, ** indicated p < 0.01.
Figure 3
Figure 3
Abnormal piRNA expression during hBMSC senescence. (A) A heatmap showing the differential expression of piRNA in hBMSCs at P1 and P10. (B) A subcluster map showing the differential expression of piRNA in hBMSCs at P1 and P10. (C) An MA map showing the differential expression of piRNA in hBMSCs at P1 and P10. (D) A scatter map showing the differential expression of piRNA in hBMSCs at P1 and P10. (E) A volcano map showing the differential expression of piRNA in hBMSCs at P1 and P10. (F) A PCA map showing the differential expression of piRNA in hBMSCs at P1 and P10. (G) Differential expression of piRNA in hBMSCs at P1 and P10 detected by qPCR. (H) The relative expression of SIRT1 mRNA in hBMSCs with piRNA DQ596311 overexpression. (I) The relative expression of SIRT1 mRNA in hBMSCs with piRNA DQ596390 overexpression. * indicated p < 0.05, ** indicated p < 0.01.
Figure 4
Figure 4
Abnormal snoRNA expression during hBMSC senescence. (A) A heatmap showing the differential expression of snoRNA in hBMSCs at P1 and P10. (B) A subcluster map showing the differential expression of snoRNA in hBMSCs at P1 and P10. (C) An MA map showing the differential expression of snoRNA in hBMSCs at P1 and P10. (D) A scatter map showing the differential expression of snoRNA in hBMSCs at P1 and P10. (E) A volcano map showing the differential expression of snoRNA in hBMSCs at P1 and P10. (F) A PCA map showing the differential expression of snoRNA in hBMSCs at P1 and P10. (G) Differential expression of snoRNA in hBMSCs at P1 and P10 detected by qPCR. * indicated p < 0.05, ** indicated p < 0.01.
Figure 5
Figure 5
Abnormal snRNA expression during hBMSC senescence. (A) A heatmap showing the differential expression of snRNA in hBMSCs at P1 and P10. (B) A subcluster map showing the differential expression of snRNA in hBMSCs at P1 and P10. (C) An MA map showing the differential expression of snRNA in hBMSCs at P1 and P10. (D) A scatter map showing the differential expression of snRNA in hBMSCs at P1 and P10. (E) A volcano map showing the differential expression of snRNA in hBMSCs at P1 and P10. (F) A PCA map showing the differential expression of snRNA in hBMSCs at P1 and P10. (G) Differential expression of snRNA in hBMSCs at P1 and P10 detected by qPCR. * indicated p < 0.05.
Figure 6
Figure 6
Abnormal rasiRNA expression during hBMSC senescence. (A) A heatmap showing the differential expression of rasiRNA in hBMSCs at P1 and P10. (B) A subcluster map showing the differential expression of rasiRNA in hBMSCs at P1 and P10. (C) An MA map showing the differential expression of rasiRNA in hBMSCs at P1 and P10. (D) A scatter map showing the differential expression of rasiRNA in hBMSCs at P1 and P10. (E) A volcano map showing the differential expression of rasiRNA in hBMSCs at P1 and P10. (F) A PCA map showing the differential expression of rasiRNA in hBMSCs at P1 and P10.

Similar articles

Cited by

References

    1. Sacchetti B, Funari A, Michienzi S, Di Cesare S, Piersanti S, Saggio I, et al. . Self-Renewing Osteoprogenitors in Bone Marrow Sinusoids Can Organize a Hematopoietic Microenvironment. Cell (2007) 131:324–36. doi: 10.1016/j.cell.2007.08.025 - DOI - PubMed
    1. Chen Q, Shou P, Zheng C, Jiang M, Cao G, Yang Q, et al. . Fate Decision of Mesenchymal Stem Cells: Adipocytes or Osteoblasts? Cell Death Differ (2016) 23:1128–39. doi: 10.1038/cdd.2015.168 - DOI - PMC - PubMed
    1. Galipeau J, Sensébé L. Mesenchymal Stromal Cells: Clinical Challenges and Therapeutic Opportunities. Cell Stem Cell (2018) 22:824–33. doi: 10.1016/j.stem.2018.05.004 - DOI - PMC - PubMed
    1. Wagner W, Bork S, Horn P, Krunic D, Walenda T, Diehlmann A, et al. . Aging and Replicative Senescence Have Related Effects on Human Stem and Progenitor Cells. PloS One (2009) 4:e5846. doi: 10.1371/journal.pone.0005846 - DOI - PMC - PubMed
    1. Digirolamo CM, Stokes D, Colter D, Phinney DG, Class R, Prockop DJ. Propagation and Senescence of Human Marrow Stromal Cells in Culture: A Simple Colony-Forming Assay Identifies Samples With the Greatest Potential to Propagate and Differentiate. Br J Haematol (1999) 107:275–81. doi: 10.1046/j.1365-2141.1999.01715.x - DOI - PubMed

Publication types