. 2022 Jun;31(6):e4328.
doi: 10.1002/pro.4328.

The roles of highly conserved, non-catalytic residues in class A β-lactamases

Affiliations

The roles of highly conserved, non-catalytic residues in class A β-lactamases

Aleksandra Chikunova et al. Protein Sci. 2022 Jun.

Abstract

Evolution minimizes the number of highly conserved amino acid residues in proteins to ensure evolutionary robustness and adaptability. The roles of all highly conserved, non-catalytic residues, 11% of all residues, in class A β-lactamase were analyzed by studying the effect of 146 mutations on in cell and in vitro activity, folding, structure, and stability. Residues around the catalytic residues (second shell) contribute to fine-tuning of the active site structure. Mutations affect the structure over the entire active site and can result in stable but inactive protein. Conserved residues farther away (third shell) ensure a favorable balance of folding versus aggregation or stabilize the folded form over the unfolded state. Once folded, the mutant enzymes are stable and active and show only localized structural effects. These residues are found in clusters, stapling secondary structure elements. The results give an integral picture of the different roles of essential residues in enzymes.

Keywords: BlaC; conserved residues; protein evolution; β-Lactamase.


Conflict of interest statement

The authors declare that they have no conflicts of interest with the contents of this article.

Figures

FIGURE 1
FIGURE 1
(a) Structure of β‐lactamase from Mtb (PDB entry 2GDN 56 ) colored by sequence conservation as determined by ConSurf, , with 1 being highly variable and 9 being highly conserved. Solid line, dashed line, and dotted line show the area of the first, second, and third shells, respectively; (b) Highly conserved residues (>92% with conservation score 9) in BlaC (PDB entry 2GDN). Residues of the first, second, and third shell are colored cyan, orange, or purple, respectively; backbone nitrogens are shown as spheres.
FIGURE 2
FIGURE 2
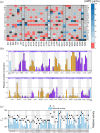
Activity, stability, and amount of soluble enzyme of BlaC variants. (a) MICs based on an ampicillin activity plate assay, with substitutions shown vertically. Wild‐type BlaC is indicated with a black box in each column and gray represents mutations that were not generated. Black rectangles show residues for which all generated mutations were tolerable; (b) Amount of BlaC found in soluble cell fraction of an E. coli cytoplasmic overexpression system relative to wild‐type BlaC, by comparison of the gel band intensity (shown on top of the histograms, full gels can be found in Figure S1). NC, negative control, the vector without the blaC gene. The third‐shell mutants are shown in purple; the second‐shell mutants are shown in orange. The horizontal bars indicate cutoffs for good/poor/no soluble protein production; (c) Melting temperatures and relative activity in nitrocefin conversion of soluble mutants in cell lysate. Horizontal dashed lines show the wild‐type BlaC values. The precision of the T m is 0.5°. Mutants that did not yield folded enzyme sufficient for Tm and activity determination are not shown, mutants with a T m but lacking an activity bar show no detectable activity for nitrocefin.
FIGURE 3
FIGURE 3
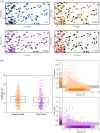
NMR TROSY spectra and CSPs. (a) Examples of details of NMR spectra (full spectra in Figures S5–S6). The wild‐type BlaC spectrum from the whole lysate is shown in black; purified wild‐type BlaC is shown in blue; spectra of well‐folded second‐shell (N245H) and third‐shell (A223K) mutants are shown in orange and purple, respectively; the spectrum of a poorly folded mutant (D131N) is shown in salmon. Red ovals indicate peaks from E. coli proteins. (b) All CSPs from all mutant spectra from the second (orange) and third (purple) shells are presented on the right against the distance from the mutation site (backbone amide to amide). Gray bars represent insignificant CSP (<0.03 ppm). On the left, CSPs above 0.03 ppm are shown for all assigned peaks of all mutants against the distance of the amide nitrogen relative to the Cα atom of the mutated residue. The boxes represent the 25th–75th percentile, lines inside the boxes represent the medians, and dashed lines represent distribution by count. The median of the second‐shell residues is significantly larger (p < 0.01) than that of the third‐shell residues.
FIGURE 4
FIGURE 4
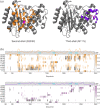
Changes in structure observed upon mutations. (a) Examples of the location of nuclei with significant CSP in second‐shell (left) and third‐shell mutants (right). CSPs are spread far from the mutation site in the second‐shell mutant D233N and are localized around the mutation site in the third‐shell mutant M117L. The mutated residue is shown in magenta sticks. PDB entry 2GDN. (b) CSPs of some mutants are plotted on the amino acid sequence. Residues for which no data are available are shown in gray. The positions of several first‐shell residues are indicated in cyan. For most second‐shell mutants, large CSPs are found for the same residues, in regions around residues 67–72, 110–112, 125–132, 162–169, 213–217, 232–238, 242–248, 261–266. Third‐shell mutants show CSP mostly close to the site of mutation. Traces above the graph represent averaged CSPs for all mutants, curves are smoothed using Savitzky–Golay filter to aid the visualization.
FIGURE 5
FIGURE 5
Schematic representation of the effect of mutations in residues Thr71 and Asn214 relative to WT. Dashed lines show the WT values. The red arrows show worsening of the mutation effect. For residue, Asn214 activity is affected more with conservative substitutions to Gln and Asp compared to non‐conservative Ala and Ser. For residue, Thr71 conservative substitution to Ser displays the worst activity and stability.
FIGURE 6
FIGURE 6
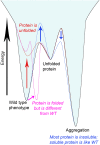
The free energy landscape of protein forms. The free energy landscape for wild‐type BlaC is shown with the black line. The effects of mutations described in the text for Groups A, B, and C are shown in blue, red, and magenta lines, respectively.
FIGURE 7
FIGURE 7
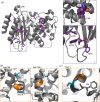
(a) Third‐shell residues localized around the edges of the secondary structure elements (shown in purple sticks or spheres) and zoom‐in of examples of interacting residues; (b) Examples of second‐shell residues (shown in orange) influencing the position of the first‐shell residues (shown in cyan) by ensuring the tight packing (Ala134) or making direct bonds to an active site residue (Asn136); (c) Environment of the second‐shell residue Thr71 (in orange).

References

    1. Sitbon E, Pietrokovski S. Occurrence of protein structure elements in conserved sequence regions. BMC Struct Biol. 2007;7:1–15. - PMC - PubMed
    1. Saldaño TE, Monzon AM, Parisi G, Fernandez‐Alberti S. Evolutionary conserved positions define protein conformational diversity. PLoS Comput Biol. 2016;12:1–25. - PMC - PubMed
    1. Kimura M, Ota T. On some principles governing molecular evolution. Proc Natl Acad Sci USA. 1974;71:2848–2852. - PMC - PubMed
    1. Valdar WSJ. Scoring residue conservation. Proteins Struct Funct Genet. 2002;48:227–241. - PubMed
    1. Lichtarge O, Bourne HR, Cohen FE. An evolutionary trace method defines binding surfaces common to protein families. J Mol Biol. 1996;257:342–358. - PubMed

Publication types

Substances