. 2022 Aug;76(8):905-916.
doi: 10.1177/00037028221096483. Epub 2022 May 28.

Silver Microparticle-Enhanced Laser-Induced Breakdown Spectroscopy

Affiliations

Silver Microparticle-Enhanced Laser-Induced Breakdown Spectroscopy

Jeremy C Marvin et al. Appl Spectrosc. 2022 Aug.

Abstract

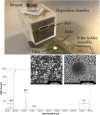
Enhanced emission was observed in the laser-induced breakdown spectroscopy (LIBS) atomic emission spectra of bacterial cells deposited upon a nitrocellulose filtration medium in the presence of one-micron silver microparticles. A deposition chamber was constructed that allowed a uniform coating of the filter with trace amounts of silver microparticles. Masses from 10 to 100 μg were deposited in a circular area of 52.18 mm2. A 30 s deposition time was used for all experiments resulting in a mass deposition of 39 μg ± 17 μg. This mass coverage on the filter provided for a single laser shot silver mass ablation of 3.3 ng per laser shot. LIBS spectra were acquired with single-shot 1064 nm laser pulses from specimens of E. coli, M. smegmatis, and E. cloacae deposited on both microparticle-coated filters and blank filters. An increase in emission intensity for all elements detected in the bacterial LIBS spectrum as well as the carbon emission which derives in part from the nitrocellulose filter medium was observed due to the ablation with silver microparticles relative to the intensity measured from the ablation of bacterial cells deposited on a blank filter. The ratio of emission intensity with microparticles to emission intensity without microparticles was measured to be 3.6 for phosphorus, 4.5 for magnesium, 5.3 for calcium, 4.0 for sodium, and 1.2 for carbon. An enhancement in LIBS emission intensity in the range of 1-10 was observed for all the spectra, with an average enhancement ratio of 4.3.

Keywords: E. coli; LIBS; Laser-induced breakdown spectroscopy; bacteria; filtration medium; microparticles; silver.


Conflict of interest statement

Declaration of Conflicting Interests: The author(s) declared no potential conflicts of interest with respect to the research, authorship, and/or publication of this article.

Figures

Graphical Abstract
Graphical Abstract
Figure 1.
Figure 1.
Silver microparticle deposition chamber with a US nickel and a ruler for scale. The stopper that seals the entrance slot during agitation is sitting on top of the deposition chamber. The filter holder assembly is shown disassembled (no hinge) in the bottom of the figure. The lower part of the filter holder assembly holds a 9.5 mm diameter nitrocellulose filter. The hole in the upper part of the assembly through which the MPs can settle when the assembly is clamped together and inserted into the box through the slot is clearly visible.
Figure 2.
Figure 2.
The mass of Ag MPs deposited upon 10 nitrocellulose filter media for five settling times after 30 s of agitation and a waiting time of 10 s. Masses were obtained for the filters before and after MP deposition using an EA microbalance. The pair of filters with a 20 s settling time possessed an identical mass of Ag within the reading uncertainty of the EA microbalance, as did the pair of filters with a 30 s settling time. A linear fit to the data constrained to pass through the origin was performed to estimate the mass deposition rate, yielding a result of 1.36 μg/s.
Figure 3.
Figure 3.
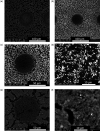
Scanning electron micrographs micrographs of (a) LIBS ablation craters on a blank nitrocellulose filter, 500x magnification. (b) LIBS ablation craters on a nitrocellulose filter coated with Ag MPs deposited using the deposition chamber, 500x magnification. The metallic silver MPs appear as bright white dots in the SEM backscatter-mode images. The laser ablation crater is approximately 75 µm in diameter. (c) LIBS ablation crater on a nitrocellulose filter coated with Ag MPs deposited using the silver chamber, 1000x magnification. (d) Ag MPs deposited on nitrocellulose filter 4000x magnification. Ag MPs are approximately 0.5–1 μm size compared to the 10 μm scale. (e) LIBS ablation crater on a nitrocellulose filter coated with Ag MPs deposited using the silver chamber, with Escherichia coli bacterial cells deposited onto the silver-coated filter, 1000x magnification. (f) Ag MPs and Escherichia coli bacterial cells deposited on nitrocellulose filter 4000x magnification. Larger Ag MPs and Ag MPs closer to the surface are visible in white, while a majority of the silver MPs are hidden underneath the film of bacteria.
Figure 4.
Figure 4.
Averaged spectra acquired from 10 single-shot laser-induced breakdown spectroscopy spectra obtained from (a) a blank nitrocellulose filter and (b) a filter coated with Ag MPs deposited with the deposition chamber (30 s settling time). Notable elemental emission peaks are labeled, including significant emission from neutral (Ag(I)) and singly-ionized (Ag(II)) silver. Each laser shot ablated approximately 3.3 ng of Ag microparticles. Molecular emission from the CN molecule created by ablation of the nitrocellulose filter was observed but not measured. All spectra were acquired in an argon environment.
Figure 5.
Figure 5.
Averaged spectra calculated from 20 single-shot laser-induced breakdown spectroscopy spectra from E. coli deposited on (a) a blank filter (red) and E. coli deposited on (b) an Ag MP-coated filter (black). Both spectra were acquired at a delay time of 2 μs. Identical aliquots of E. coli were deposited on the two filters, but the presence of the Ag MPs caused increased emission from all of the measured lines, including carbon, which is primarily attributable to the ablation of the underlying nitrocellulose filter medium. Emission from all the other elements (except for Ar) is attributable only to the bacterial cells, including the important phosphorus emission. Both spectra are plotted with the same vertical scale.
Figure 6.
Figure 6.
Comparison of absolute emission intensities of five lines of interest from C, P, Mg, Ca, and Na obtained from spectra in Figs. 4 and 5. The number under each region of interest is the center wavelength of the emission line (in nm) and the value above each region of interest is the integrated area under the curve, which is the emission intensity for that line (in arbitrary units). Carbon emission stayed relatively constant, only exhibiting a decrease in intensity when bacteria were deposited upon the filter, resulting in less nitrocellulose filter ablation. Phosphorus peaks were noticeably enhanced with the addition of Ag, but were not seen in any spectra from the filtration medium alone. Magnesium, calcium, and sodium were present in trace amounts in the filtration medium and emission was observable only in averaged spectra but never in single-shot spectra. Significant emission was observed from these elements due to the deposition of bacteria and that emission was enhanced due to the presence of the Ag MPs.

References

    1. Rai V.N., Thakur S.N.. “Physics and Dynamics of Plasma in Laser-Induced Breakdown Spectroscopy”. In: Singh J.P., Thakur S.N., editors. Laser-Induced Breakdown Spectroscopy. Amsterdam: Elsevier, 2020.
    1. Aragón C., Aguilera J.A.. “Characterization of Laser Induced Plasmas by Optical Emission Spectroscopy: A Review of Experiments and Methods”. Spectrochim. Acta, Part B. 2008. 63(9): 893‐916. doi:10.1016/j.sab.2008.05.010 - DOI
    1. Fortes F.J., Moros J., Lucena P., Cabalin L.M., Laserna J.J.. “Laser-Induced Breakdown Spectroscopy”. Anal. Chem 2013. 85(2): 640-669. doi:10.1021/ac303220r - DOI - PubMed
    1. Hahn D.W., Omenetto N.. “Laser-Induced Breakdown Spectroscopy (LIBS), Part I: Review of Basic Diagnostics and Plasma-Particle Interactions: Still-Challenging Issues within the Analytical Plasma Community”. Appl. Spectrosc. 2010. 64(12): 335A-366A. doi:10.1366/000370210793561691 - DOI - PubMed
    1. Jantzi S.C., Motto-Ros V., Trichard F., Markushin Y., et al. “Sample Treatment and Preparation for Laser-Induced Breakdown Spectroscopy”. Spectrochim. Acta, Part B. 2016. 115: 52-63. doi:10.1016/j.sab.2015.11.002 - DOI

LinkOut - more resources