

Bone Microenvironment-Suppressed T Cells Increase Osteoclast Formation and Osteolytic Bone Metastases in Mice
- PMID: 35635377
- PMCID: PMC9543062
- DOI: 10.1002/jbmr.4615
Bone Microenvironment-Suppressed T Cells Increase Osteoclast Formation and Osteolytic Bone Metastases in Mice
Abstract
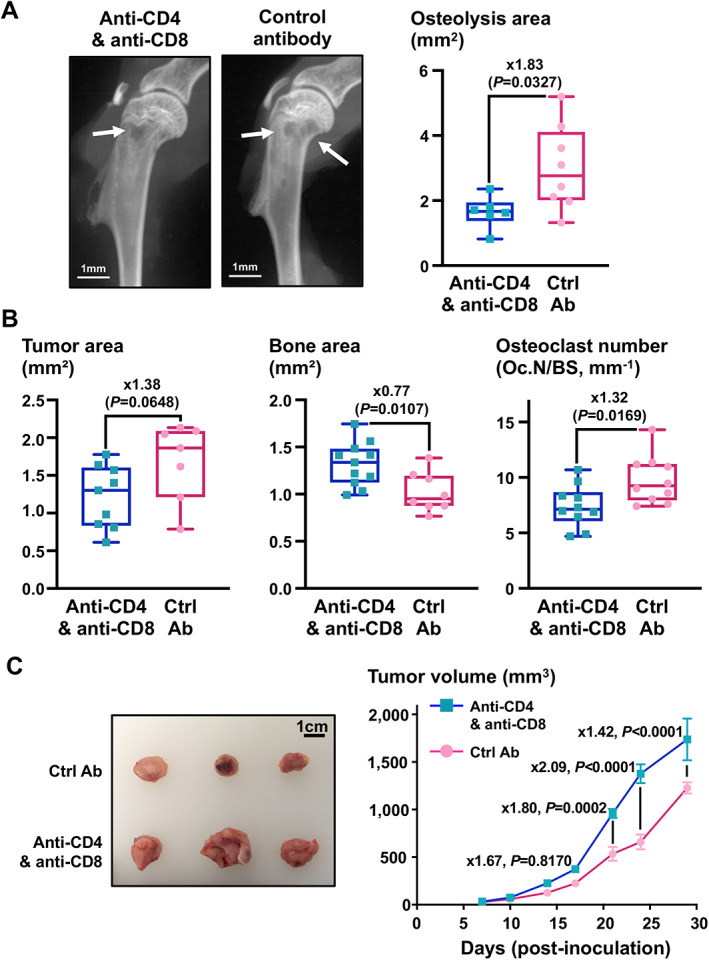
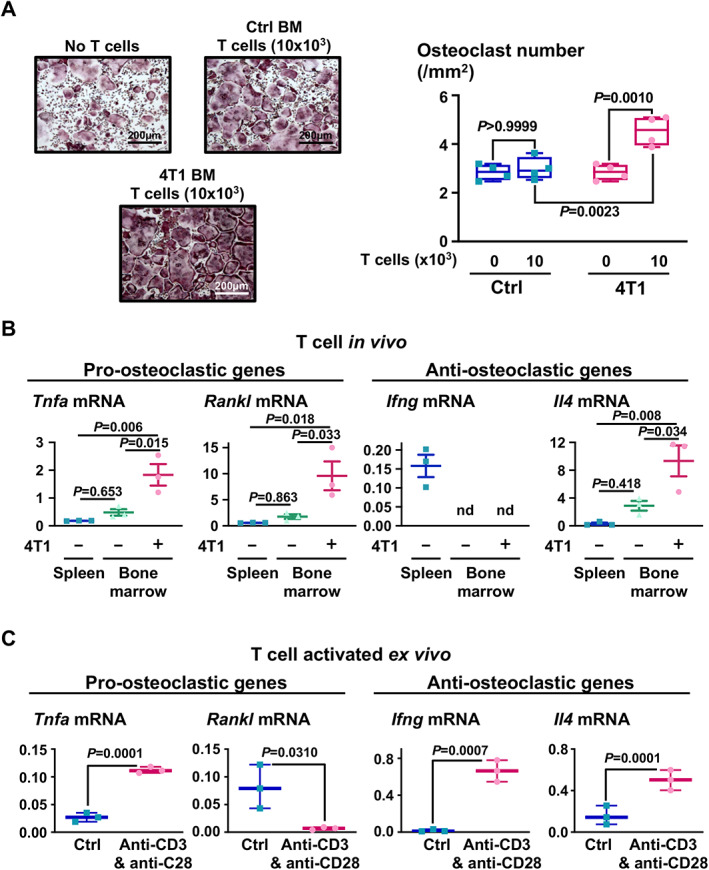
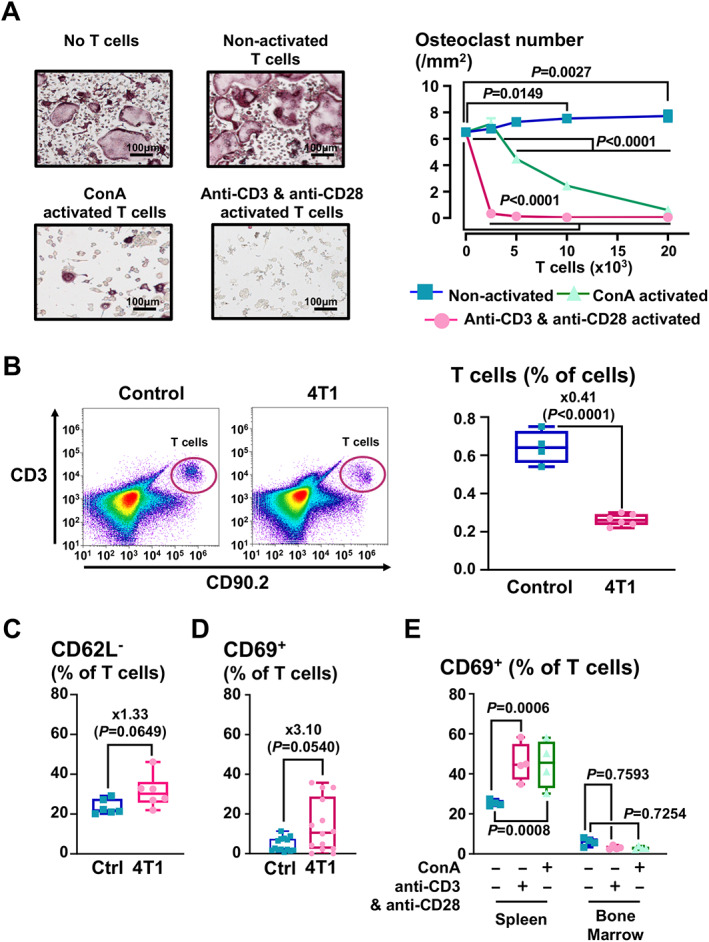
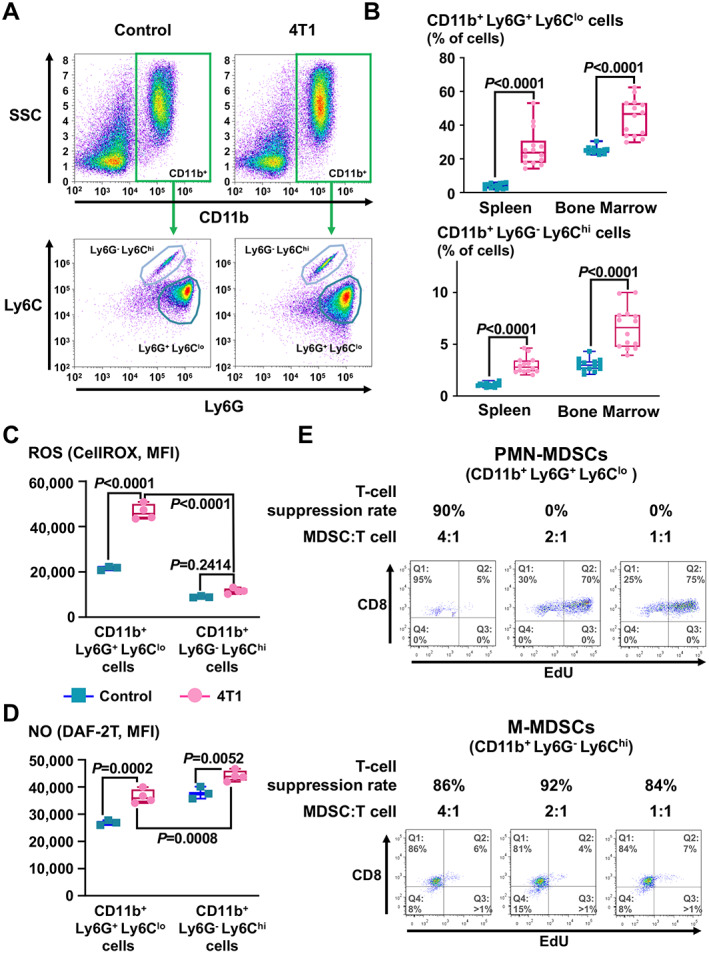
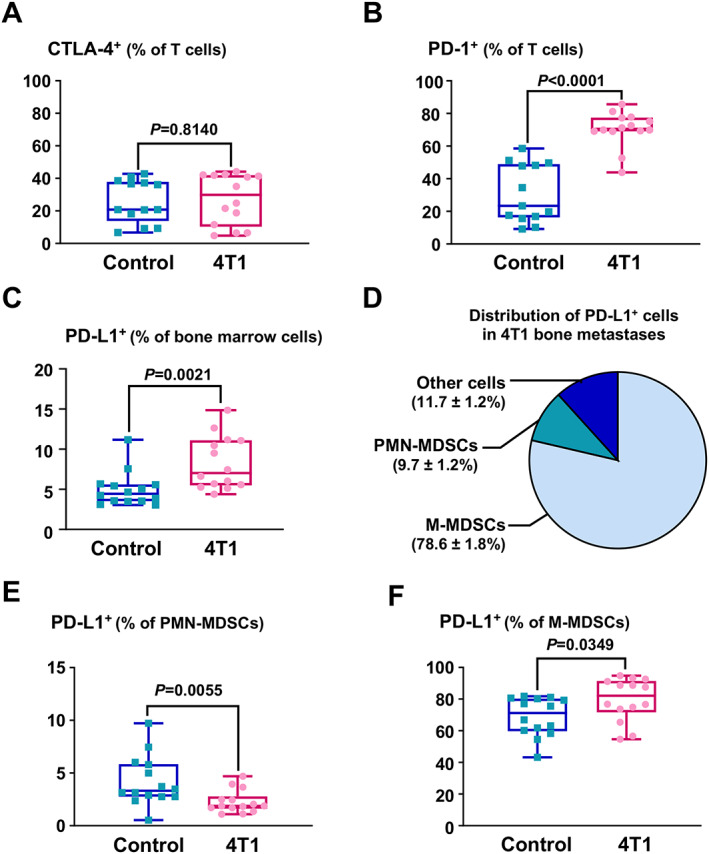
Immunotherapies use components of the immune system, such as T cells, to fight cancer cells, and are changing cancer treatment, causing durable responses in some patients. Bone metastases are a debilitating complication in advanced breast and prostate cancer patients. Approved treatments fail to cure bone metastases or increase patient survival and it remains unclear whether immunotherapy could benefit patients. The bone microenvironment combines various immunosuppressive factors, and combined with T cell products could increase bone resorption fueling the vicious cycle of bone metastases. Using syngeneic mouse models, our study revealed that bone metastases from 4T1 breast cancer contain tumor-infiltrating lymphocyte (TILs) and their development is increased in normal mice compared to immunodeficient and T-cell depleted mice. This effect seemed caused by the TILs specifically in bone, because T-cell depletion increased 4T1 orthotopic tumors and did not affect bone metastases from RM-1 prostate cancer cells, which lack TILs. T cells increased osteoclast formation ex vivo and in vivo contributing to bone metastasis vicious cycle. This pro-osteoclastic effect is specific to unactivated T cells, because activated T cells, secreting interferon γ (IFNγ) and interleukin 4 (IL-4), actually suppressed osteoclastogenesis, which could benefit patients. However, non-activated T cells from bone metastases could not be activated in ex vivo cultures. 4T1 bone metastases were associated with an increase of functional polymorphonuclear and monocytic myeloid-derived suppressor cells (MDSCs), potent T-cell suppressors. Although effective in other models, sildenafil and zoledronic acid did not affect MDSCs in bone metastases. Seeking other therapeutic targets, we found that monocytic MDSCs are more potent suppressors than polymorphonuclear MDSCs, expressing programmed cell death receptor-1 ligand (PD-L1)+ in bone, which could trigger T-cell suppression because 70% express its receptor, programmed cell death receptor-1 (PD-1). Collectively, our findings identified a new mechanism by which suppressed T cells increase osteoclastogenesis and bone metastases. Our results also provide a rationale for using immunotherapy because T-cell activation would increase their anti-cancer and their anti-osteoclastic properties. © 2022 The Authors. Journal of Bone and Mineral Research published by Wiley Periodicals LLC on behalf of American Society for Bone and Mineral Research (ASBMR).
Keywords: BONE METASTASIS; IMMUNOSUPRESSION; IMMUNOTHERAPY; MDSC; OSTEOCLAST; T CELLS.
© 2022 The Authors. Journal of Bone and Mineral Research published by Wiley Periodicals LLC on behalf of American Society for Bone and Mineral Research (ASBMR).
Conflict of interest statement
The authors declare no conflict of interest regarding this work.
Figures


Similar articles
-
Interleukin-10 overexpression in 4T1 cells: A gateway to suppressing mammary carcinoma growth.Int Immunopharmacol. 2024 Dec 5;142(Pt A):113089. doi: 10.1016/j.intimp.2024.113089. Epub 2024 Sep 7. Int Immunopharmacol. 2024. PMID: 39244897
-
CD8+ T cells from experimental in situ breast carcinoma interfere with bone homeostasis.Bone. 2021 Sep;150:116014. doi: 10.1016/j.bone.2021.116014. Epub 2021 May 20. Bone. 2021. PMID: 34022456
-
Dendritic cells development into osteoclast-type APCs by 4T1 breast tumor T cells milieu boost bone consumption.Bone. 2021 Feb;143:115755. doi: 10.1016/j.bone.2020.115755. Epub 2020 Nov 18. Bone. 2021. PMID: 33217627
-
Osteoclast Immunosuppressive Effects in Multiple Myeloma: Role of Programmed Cell Death Ligand 1.Front Immunol. 2018 Aug 10;9:1822. doi: 10.3389/fimmu.2018.01822. eCollection 2018. Front Immunol. 2018. PMID: 30147691 Free PMC article. Review.
-
Molecular mechanisms of tumor-bone interactions in osteolytic metastases.Crit Rev Eukaryot Gene Expr. 2000;10(2):159-78. Crit Rev Eukaryot Gene Expr. 2000. PMID: 11186331 Review.
Cited by
-
Osteoimmunology in bone malignancies: a symphony with evil.J Natl Cancer Cent. 2024 Sep 14;4(4):354-368. doi: 10.1016/j.jncc.2024.09.001. eCollection 2024 Dec. J Natl Cancer Cent. 2024. PMID: 39735445 Free PMC article. Review.
-
The emerging role of osteoclasts in the treatment of bone metastases: rationale and recent clinical evidence.Front Oncol. 2024 Aug 1;14:1445025. doi: 10.3389/fonc.2024.1445025. eCollection 2024. Front Oncol. 2024. PMID: 39148909 Free PMC article. Review.
-
Immunotherapy in the Battle Against Bone Metastases: Mechanisms and Emerging Treatments.Pharmaceuticals (Basel). 2024 Nov 26;17(12):1591. doi: 10.3390/ph17121591. Pharmaceuticals (Basel). 2024. PMID: 39770433 Free PMC article. Review.
-
The role and mechanisms of exosome microRNA in regulating metastasis within the tumor microenvironment of prostate cancer.Front Oncol. 2025 Jun 10;15:1580314. doi: 10.3389/fonc.2025.1580314. eCollection 2025. Front Oncol. 2025. PMID: 40556678 Free PMC article. Review.
-
Immune checkpoint inhibitors in bone metastasis: Clinical challenges, toxicities, and mechanisms.J Bone Oncol. 2023 Sep 30;43:100505. doi: 10.1016/j.jbo.2023.100505. eCollection 2023 Dec. J Bone Oncol. 2023. PMID: 37842554 Free PMC article. Review.
References
-
- Sung H, Ferlay J, Siegel RL, et al. Global Cancer Statistics 2020: GLOBOCAN estimates of incidence and mortality worldwide for 36 cancers in 185 countries. CA Cancer J Clin. 2021;71(3):209‐249. - PubMed
-
- Coleman RE, Croucher PI, Padhani AR, et al. Bone metastases. Nat Rev Dis Prim. 2020;6(1):83. - PubMed
-
- Tesfamariam Y, Jakob T, Wockel A, et al. Adjuvant bisphosphonates or RANK‐ligand inhibitors for patients with breast cancer and bone metastases: a systematic review and network meta‐analysis. Crit Rev Oncol Hematol. 2019;137:1‐8. - PubMed
Publication types
MeSH terms
Grants and funding
LinkOut - more resources
Full Text Sources
Medical
Research Materials
