. 2022 Aug;49(8):5423-5438.
doi: 10.1002/mp.15785. Epub 2022 Jun 8.

Patient-derived heterogeneous breast phantoms for advanced dosimetry in mammography and tomosynthesis

Affiliations

Patient-derived heterogeneous breast phantoms for advanced dosimetry in mammography and tomosynthesis

Marco Caballo et al. Med Phys. 2022 Aug.

Abstract

Background: Understanding the magnitude and variability of the radiation dose absorbed by the breast fibroglandular tissue during mammography and digital breast tomosynthesis (DBT) is of paramount importance to assess risks versus benefits. Although homogeneous breast models have been proposed and used for decades for this purpose, they do not accurately reflect the actual heterogeneous distribution of the fibroglandular tissue in the breast, leading to biases in the estimation of dose from these modalities.

Purpose: To develop and validate a method to generate patient-derived, heterogeneous digital breast phantoms for breast dosimetry in mammography and DBT.

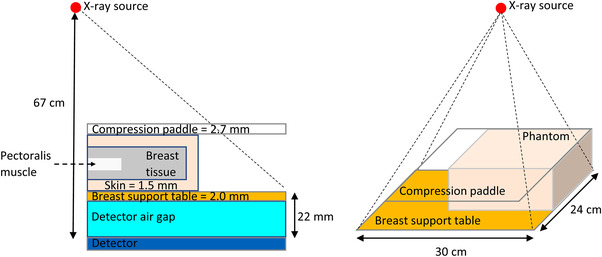
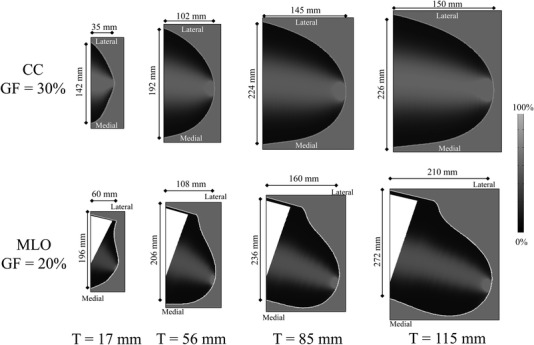
Methods: The proposed phantoms were developed starting from patient-based models of compressed breasts, generated for multiple thicknesses and representing the two standard views acquired in mammography and DBT, that is, cranio-caudal (CC) and medio-lateral-oblique (MLO). Internally, the breast phantoms were defined as consisting of an adipose/fibroglandular tissue mixture, with a nonspatially uniform relative concentration. The parenchyma distributions were obtained from a previously described model based on patient breast computed tomography data that underwent simulated compression. Following these distributions, phantoms with any glandular fraction (1%-100%) and breast thickness (12-125 mm) can be generated, for both views. The phantoms were validated, in terms of their accuracy for average normalized glandular dose (Dg N) estimation across samples of patient breasts, using 88 patient-specific phantoms involving actual patient distribution of the fibroglandular tissue in the breast, and compared to that obtained using a homogeneous model similar to those currently used for breast dosimetry.

Results: The average Dg N estimated for the proposed phantoms was concordant with that absorbed by the patient-specific phantoms to within 5% (CC) and 4% (MLO). These Dg N estimates were over 30% lower than those estimated with the homogeneous models, which overestimated the average Dg N by 43% (CC), and 32% (MLO) compared to the patient-specific phantoms.

Conclusions: The developed phantoms can be used for dosimetry simulations to improve the accuracy of dose estimates in mammography and DBT.

Keywords: breast density; breast dosimetry; digital breast tomosynthesis; digital phantoms; mammography.


Conflict of interest statement

The authors declare that there is no conflict of interest that could be perceived as prejudicing the impartiality of the research reported.

Figures

FIGURE 1
FIGURE 1
Initial step of the development of the cranio‐caudal (CC) phantoms. The input compressed breast shape (panel a, three‐dimensional [3D] rendering and central slice) was used to generate three initial breast density maps (panels b–d), each obtained by replicating the respective fibroglandular tissue probability density function within the shape.
FIGURE 2
FIGURE 2
Three‐dimensional probability map of the fibroglandular tissue concentration (shown for two views), obtained by the product and the normalization of the three separate distributions shown in Figure 1
FIGURE 3
FIGURE 3
Initial step of the development of the medio‐lateral‐oblique (MLO) phantoms. The breast volume from the input compressed shape was first separated from the chest wall and rotated by the angle between the pectoral muscle line and the vertical axis (panel a). The reoriented shape was then used to generate three initial breast distribution maps (panels b–d), each obtained by replicating the fibroglandular tissue distributions within the shape.
FIGURE 4
FIGURE 4
(a) Schematics of the pectoral muscle developed and included in the medio‐lateral‐oblique (MLO) phantoms, modeled by a pyramidal shape, with the width varying according to the defined ratio between the muscle and the breast volume thickness. Parts (b) and (c) show the schematic examples of two different pectoral muscles, defined for large and small values of this ratio.
FIGURE 5
FIGURE 5
(a) The pectoral muscle was generated by first identifying the pectoral midline (dotted line), defined as the line that joins the lowest point of the chest wall with the center of its upper cross‐section. (b) The pectoral muscle was then created around this midline (represented as a dot in the cross‐sectional images), with the width in the lateral–medial direction set according to the desired input ratio between the muscle and the breast thickness. (c) The remaining chest wall tissue voxels not occupied by the added pectoral muscle were filled with breast tissue, by extrapolating the normalized probability along the anterior–posterior direction.
FIGURE 6
FIGURE 6
Three‐dimensional probability maps of the fibroglandular tissue concentration (shown for two views), obtained by the product and normalization of the three separate distributions shown in Figure 3, with the pectoral muscle included
FIGURE 7
FIGURE 7
Schematics of the side and top views of the geometry defined in the Monte Carlo (MC) simulations
FIGURE 8
FIGURE 8
Examples of phantoms (central slice) used in the Monte Carlo (MC) simulations to estimate the DgN values for (a) patient‐based, (b) heterogeneous, and (c) homogeneous phantoms. All three examples contain the same overall glandular fraction (17%).
FIGURE 9
FIGURE 9
Central slices through eight different examples of cranio‐caudal (CC) (top row) and medio‐lateral‐oblique (MLO) phantoms (bottom row) generated for four compressed breast thicknesses (T), and two overall glandular fractions (GF)
FIGURE 10
FIGURE 10
Dg as a function of the pectoral muscle thickness (defined as the percentage of the thickest portion of the muscle relative to the total breast tissue thickness) in the phantom for different configurations of breast thickness (in mm)/glandularity (in %)
FIGURE 11
FIGURE 11
Normalized deviation of the Dg as a function of the maximum thickness of pectoral muscle (defined as the percentage of the total breast thickness occupied by the pectoral muscle at its thickest section) included in the phantom for different configurations of breast thickness and glandularity. The smooth curves are the quadratic fits for each normalized deviation of the Dg as a function of the pectoral muscle thickness.
FIGURE 12
FIGURE 12
Top row: (a) comparison of the estimated DgN values for the homogeneous and heterogeneous models to the corresponding DgN of the patient‐based breast computed tomography (CT) phantoms for the cranio‐caudal (CC) view, (b) box–whisker plot of the DgN ratios of the homogeneous and heterogeneous model to patient DgN for the CC view. Bottom row: (c) comparison of the estimated DgN values for the homogeneous and heterogeneous model to the corresponding DgN of the patient‐based breast CT phantoms for the medio‐lateral‐oblique (MLO) view; (d) box–whisker plot of the DgN ratios of the homogeneous and heterogeneous model to patient DgN for the MLO view

References

    1. Ewton J, Shalek R, Egan R. Estimated radiation dose during mammography. Cancer Bull. 1962;14:116‐117.
    1. Hammerstein GR, Miller DW, White DR, Masterson ME, Woodard HQ, Laughlin JS. Absorbed radiation dose in mammography. Radiology. 1979;130:485‐491. - PubMed
    1. Dance DR. Monte Carlo calculation of conversion factors for the estimation of mean glandular breast dose. Phys Med Biol. 1990;35:1211‐1219. - PubMed
    1. Wu X, Gingold EL, Barnes GT, Tucker DM. Normalized average glandular dose in molybdenum target‐rhodium filter and rhodium target‐rhodium filter mammography. Radiology. 1994;193:83‐89. - PubMed
    1. Boone JM. Glandular breast dose for monoenergetic and high‐energy x‐ray beams: Monte Carlo assessment. Radiology. 1999;213:23‐37. - PubMed