. 2022 Jul:53:102334.
doi: 10.1016/j.redox.2022.102334. Epub 2022 May 19.

Inhibition of nuclear deacetylase Sirtuin-1 induces mitochondrial acetylation and calcium overload leading to cell death

Affiliations

Inhibition of nuclear deacetylase Sirtuin-1 induces mitochondrial acetylation and calcium overload leading to cell death

Yue Sun et al. Redox Biol. 2022 Jul.

Abstract

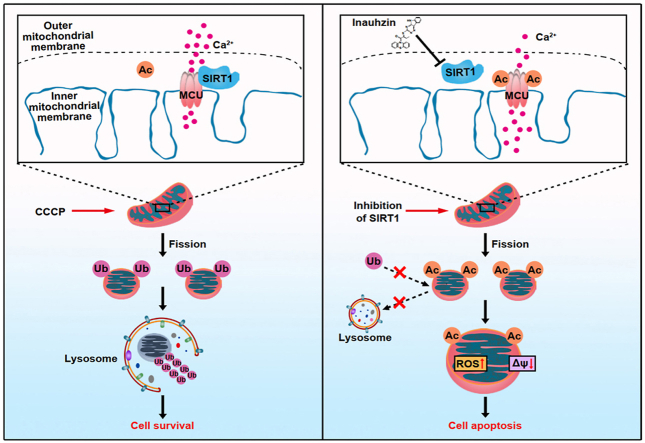
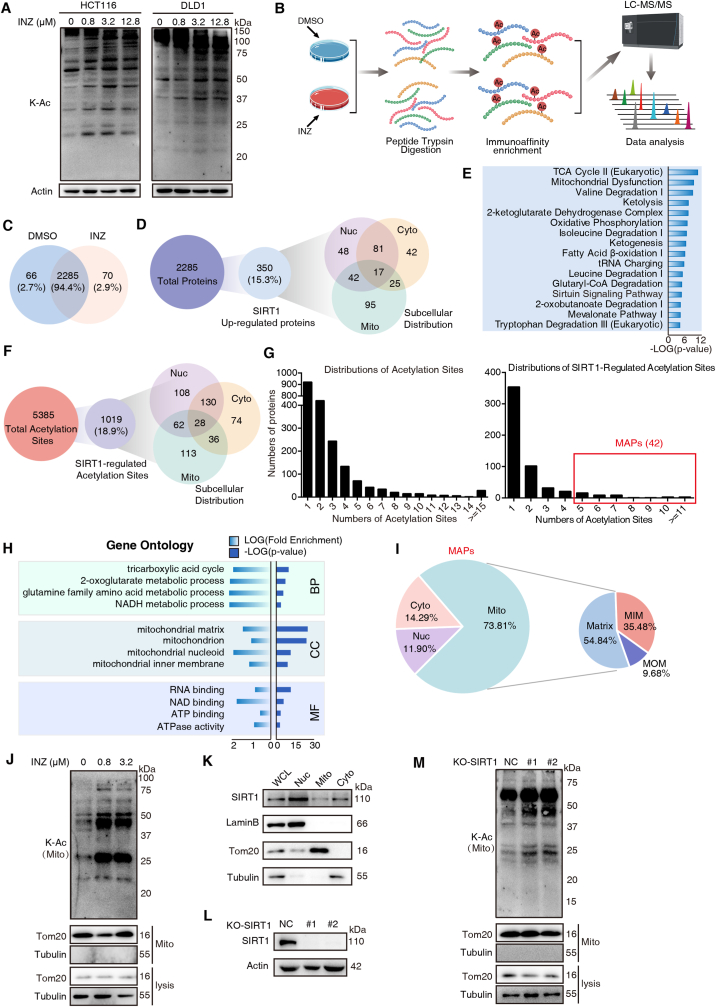
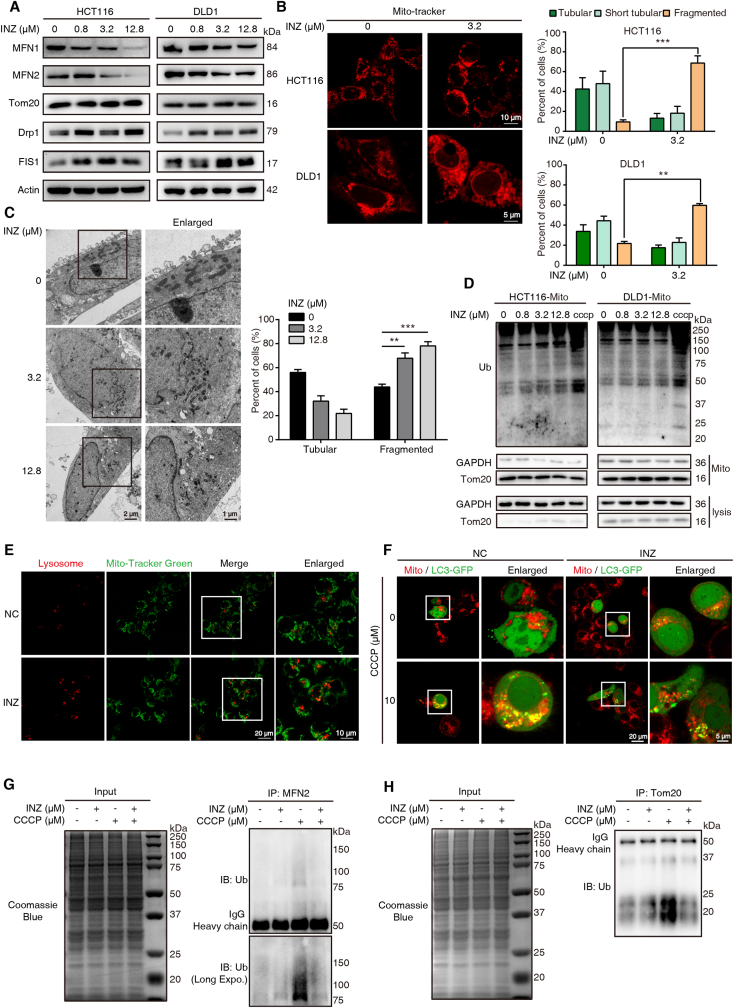
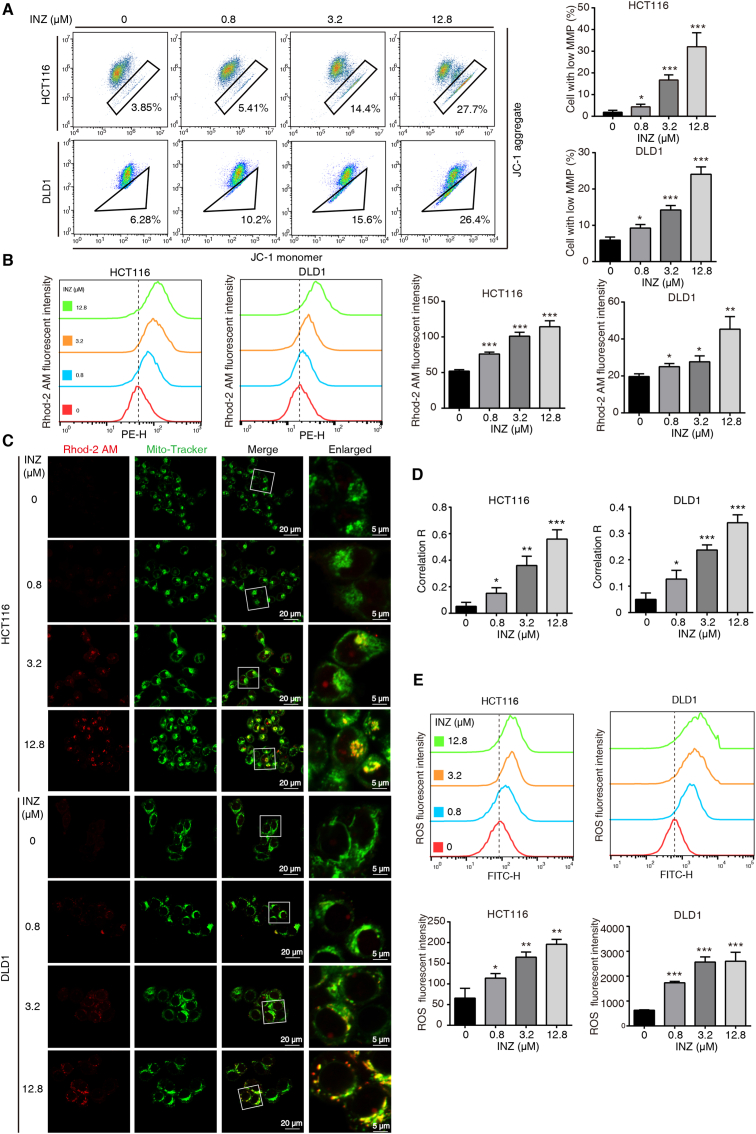
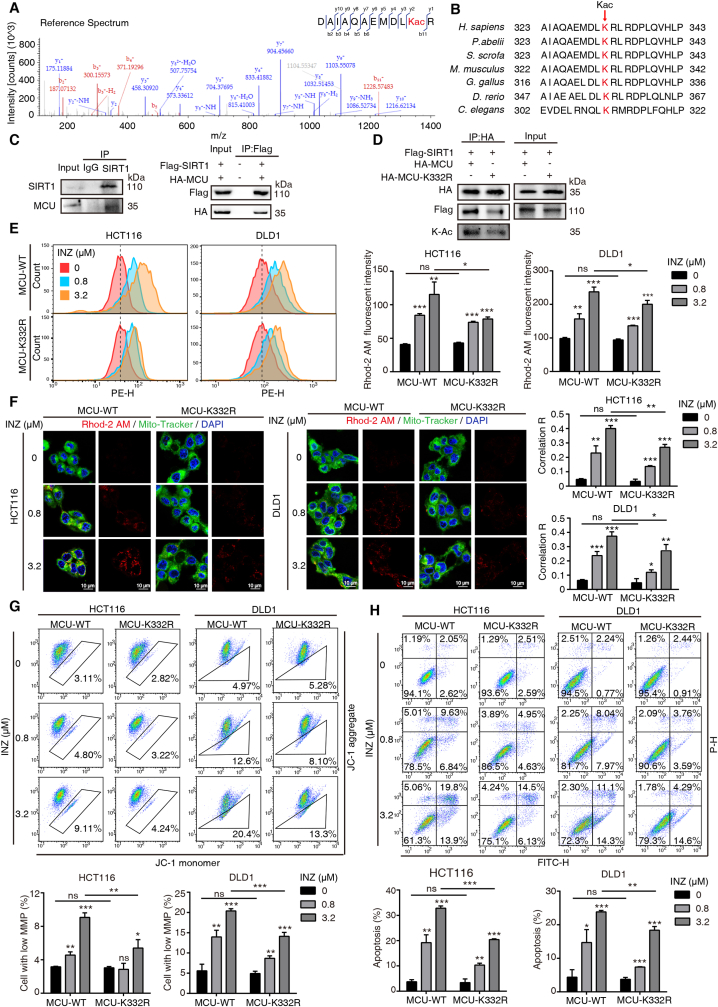
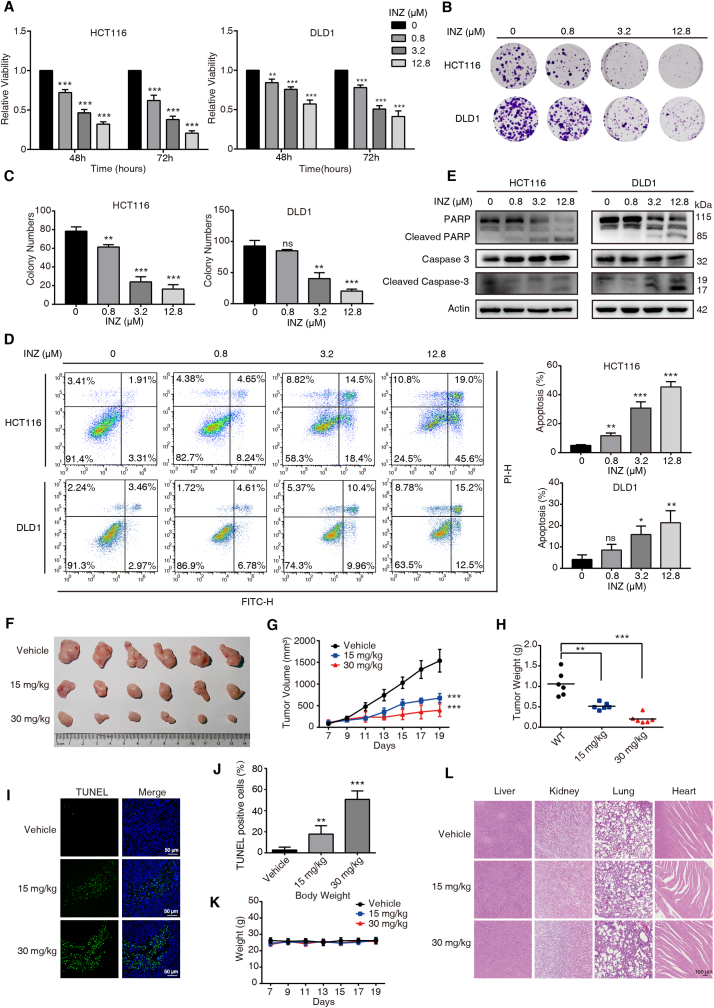
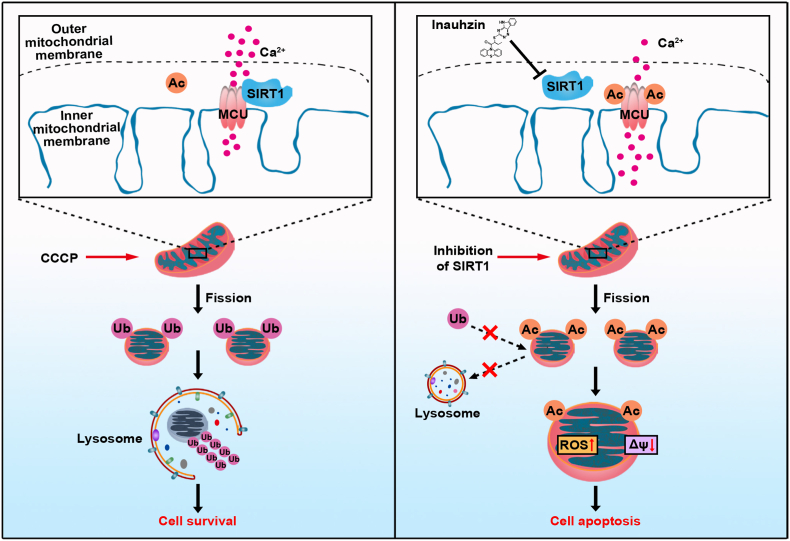
Sirtuin-1 (SIRT1) is a critical nuclear deacetylase that participates in a wide range of biological processes. We hereby employed quantitative acetyl-proteomics to globally reveal the landscape of SIRT1-dependent acetylation in colorectal cancer (CRC) cells stimulated by specific SIRT1 inhibitor Inauhzin (INZ). We strikingly observed that SIRT1 inhibition enhances protein acetylation levels, with the multisite-acetylated proteins (acetyl sites >4/protein) mainly enriched in mitochondria. INZ treatment increases mitochondrial fission and depolarization in CRC cells. The acetylation of mitochondrial proteins promoted by SIRT1 inhibition prevents the recruitment of ubiquitin and LC3 for mitophagic degradation. We then found that, SIRT1 inhibition increases the acetylation of mitochondrial calcium uniporter (MCU) at residue K332, resulting in mitochondrial Ca2+ overload and depolarization, and ultimately CRC apoptosis. Arginine substitution of the K332 (K332R) dramatically decreases the mitochondrial Ca2+ influx, mitochondrial membrane potential loss and ROS burst induced by INZ. This finding uncovers a non-canonical role of SIRT1 in regulating mitochondrial function and implicates a possible way for anticancer intervention through SIRT1 inhibition.

Keywords: Acetylation; Calcium; Inauhzin; MCU; Mitochondria; SIRT1.


Conflict of interest statement

The authors declare that they have no competing interests.

Figures

Image 1
Graphical abstract
Fig. 1
Fig. 1
SIRT1 inhibition promotes mitochondrial acetylation. (A) Western blot analysis of lysine-acetylation (K–Ac) expressions in whole-cell lysates of HCT116 and DLD1 cells treated with increasing concentrations of INZ (up to 12.8 μM) for 48 h. (B) Schematic representation of experimental workflow for the identification of acetyl-lysine-modified peptides regulated by SIRT1 inhibition. Lysates from HCT116 cells incubated with or without INZ (0.8 μM) were subjected to trypsin digestion and acetylation antibody-based enrichment, and followed by MS analysis. (C) Venn diagram showing the overlap of protein numbers in DMSO-treated and INZ-treated groups. (D) The number of SIRT1 up-regulated proteins and their subcellular distribution as determined by the COMPARTMENTS database. (E) Ingenuity Pathway Analysis (IPA) of the acetylated proteins regulated by SIRT1 (fold change ≥1.5, P < 0.05). The bar graphs showing the top 15 canonical pathways enriched by IPA. (F) Description of the SIRT1-regulated acetylation sites and their subcellular distribution. (G) Histogram showing the distributions of the number of acetylation sites (left) and SIRT1-regulated sites (right) per protein. Multisite-acetylated proteins (MAPs) with more than 4 acetylation sites are indicated in red pane. (H) DAVID Gene Ontology (GO) analysis of hyperacetylated proteins regulated by SIRT1 inhibition. Significantly enriched pathways (FDR <0.01) were categorized by GO different modules for visualization (BP: biological process; CC: cellular component; MF: molecular function). (I) Pie chart showing the proportion of MAPs in mitochondrial, nuclear and cytoplasmic fractions according to cellular component analysis, as well as the distribution of MAPs in mitochondria inner membrane (MIM), mitochondria outer membrane (MOM) and matrix. (J) The acetylation level of mitochondria extracted from HCT116 cells treated with 0.8 and 3.2 μM of INZ. Tom20 and Tubulin were used as markers for mitochondria and cytoplasma, respectively. (K) The expression level of SIRT1 in different cellular components extracted from HCT116 cells, respectively. Nuc, nucleus; mito, mitochondria; cyto, cytosol. (L) Western blot analysis confirming the effect of SIRT1 knockout in HCT116 cells. (M) Western blot analysis of the acetylation level of mitochondria in HCT116 cells after knockout of SIRT1. (For interpretation of the references to color in this figure legend, the reader is referred to the Web version of this article.)
Fig. 2
Fig. 2
Inhibition of SIRT1 leads to mitochondrial dysfunction and mitophagy suppression. (A) Western blot analysis of the expression of mitochondrial dynamics-related proteins, MFN1, MFN2, Tom20, Drp1 and FIS1, in HCT116 and DLD1 cells treated with different concentration of INZ (0, 0.8, 3.2 and 12.8 μM) for 48 h. (B) Mitochondrial morphology of HCT116 and DLD1 with or without INZ treatment (3.2 μM, 48 h) was determined by confocal microscope (n = 3). Cells were labeled with Mito-tracker (red) for visualization, mitochondria in tubular, short tubular and fragment were statistically analyzed. Scale bars, 10 μm for HCT116 and 5 μm for DLD1. (C) Representative TEM images of DLD1 treated with INZ (up to 12.8 μM) for 48 h, and the mitochondrial morphology with tubular and fragment were statistically analyzed (n = 3). Scale bars, 1 μm and 2 μm. (D) Western blot determining the ubiquitin level of mitochondria from HCT116 and DLD1cells treated with INZ (for 48 h) or CCCP (for 2 h, positive control). (E) The localization of mitochondria and lysosome in HCT116 cells treated with INZ (12.8 μM, 48 h) was visualized by confocal microscope (n = 3). Green, Mito-tracker; Red, Lyso-Tracker. Scale bars, 10 μm and 20 μm. (F) Confocal microscopy determining the recruitment of LC3 to mitochondria in HCT116 with indicated treatment (n = 3). Green, LC3-GFP; Red, Mito-Tracker. Scale bars, 5 μm and 20 μm. (G, H) Effects of CCCP-induced ubiquitination of MFN2 and Tom20 with or without INZ treatment. HCT116 cells were pretreated with 12.8 μM INZ for 24 h and then treated with CCCP (10 μM) for 6 h, then the ubiquitination of MFN2 and Tom20 was analyzed. Bars, SD; **P < 0.01; ***P < 0.001. (For interpretation of the references to color in this figure legend, the reader is referred to the Web version of this article.)
Fig. 3
Fig. 3
Inhibition of SIRT1 induces mitochondrial calcium influx and ROS burst. (A) JC-1 assay evaluation of the mitochondrial membrane potential level of HCT116 and DLD1 cells treated with the indicated concentrations of INZ (up to 12.8 μM) for 48 h. (B) The alteration of mitochondrial calcium level in HCT116 and DLD1 cells treated with different concentrations of INZ (0, 0.8, 3.2 and 12.8 μM) for 48 h was determined by flow cytometry with Rhod-2AM staining. (C, D) Confocal images of mitochondrial calcium in HCT116 and DLD1 cells treated with INZ (up to 12.8 μM) for 48 h (n = 3). Red, Rhod-2AM; Green, Mito-Tracker. The location overlap between Rhod-2 AM and mitochondria was determined by the correlation R (Pearson's correlation coefficient). Scale bars, 5 μm and 20 μm. (E) Representative flow cytometric analysis of ROS production in HCT116 and DLD1 treated with INZ (up to 12.8 μM) for 48 h. Bars, SD; *P < 0.05; **P < 0.01; ***P < 0.001. (For interpretation of the references to color in this figure legend, the reader is referred to the Web version of this article.)
Fig. 4
Fig. 4
SIRT1 regulates the acetylation of MCU at K332 and influences mitochondrial calcium influx. (A) MS/MS spectra of MCU acetyl-Lys332 peptides derived from HCT116 cells by SIRT1 inhibition. (B) Lys332 in MCU is conserved in various species. (C) CO-IP assay was performed to determine the interaction of SIRT1 and MCU. Expression of MCU was determined in SIRT1 immuonprecipitates by Western blotting in HCT116 cells (left). HA-MCU and Flag-SIRT1 were co-transfected into 293T cells, and co-immunoprecipitated by anti-Flag antibody. (D) The interaction of MCU and SIRT1 was decreased in mutant K332R of MCU. CO-IP assay was performed in HCT116 cells expressed with Flag-SIRT1 and HA-MCU or HA-MCU-K332R plasmid. (E) Representative flow cytometric analysis of mitochondrial Ca2+ signal by Rhod-2AM staining in HCT116 and DLD1, which was transfected with wild-type or K332R MCU plasmids and treated with INZ for 48 h. (F) HCT116 and DLD1 cells transfected with wild-type or K332R MCU plasmids were incubated with INZ (up to 3.2 μM) for 48 h, respectively. Then the cells loaded with 1 μM Rhod-2AM (Red), and 100 nM Mito-Tracker (Green) were observed under confocal microscopy (n = 3). Blue, DAPI. The location overlap between Rhod-2 AM and mitochondria was determined by the correlation R (Pearson's correlation coefficient). Scale bar, 10 μm. (G) JC-1 assay analysis of mitochondrial membrane potential in HCT116 and DLD1 cells with indicated treatment. Cells with low mitochondrial membrane potential were quantified. (H) Annexin V/PI assay analysis of the apoptotic cells with indicated treatment. The apoptotic cells including early apoptosis and late apoptosis were statistically presented. Bars, SD; *P < 0.05; **P < 0.01; ***P < 0.001; ns P > 0.05. (For interpretation of the references to color in this figure legend, the reader is referred to the Web version of this article.)
Fig. 5
Fig. 5
SIRT1 inhibitor INZ suppresses tumor growth of CRC in vivo and in vitro. (A) HCT116 and DLD1 cells were incubated with indicated concentrations of INZ for 48 and 72 h, the cell viability was determined by WST-1 assay. (B, C) INZ inhibited the colony formation of HCT116 and DLD1 cells. (D) HCT116 and DLD1 cells were treated with INZ for 48 h, and apoptotic cells were detected by flow cytometry. (E) Western blotting analysis of the expression levels of PARP, cleaved PARP, caspase-3 and cleaved caspase-3 in INZ-treated CRC cells. (FL) Representative image of tumors with or without INZ treatment (F). HCT116 cells were subcutaneously injected into nude mice to establish tumor xenograft. In the seventh day, the mice were randomized into three groups to receive oral gavage of INZ (15 mg/kg or 30 mg/kg) or vehicle every two days, respectively. (G, H) Tumor curves showing the inhibitory effect of INZ on tumor growth, and the tumor weight was statistically presented. (I, J) Cell apoptosis in tumor tissues was analyzed by TUNEL assay (I), and statistically presented (J). (K) The body weight of nude mice during the experimental period was shown. (L) Hematoxylin and eosin (H&E) staining of the livers, kidneys, lung and heart collected from treatment and control groups. Scale bar, 100 μm. Bars, SD; *P < 0.05; **P < 0.01; ***P < 0.001; ns P > 0.05.
Fig. 6
Fig. 6
Schematic diagram of the action mechanism SIRT1 inhibition on mitochondrial dysfunction. The inhibition of SIRT1 induces acetylation of mitochondrial Ca2+ transporter, MCU, promoting mitochondrial Ca2+ overload, ROS burst and loss of mitochondrial membrane potential. Global acetylation of mitochondrial proteins due to SIRT1 inhibition obstructs their ubiquitin and LC3-labeling, preventing mitophagy-associated clearance, and ultimately causing cell apoptosis.

References

    1. Baeza J., Smallegan M.J., Denu J.M. Mechanisms and dynamics of protein acetylation in mitochondria. Trends Biochem. Sci. 2016;41:231–244. - PMC - PubMed
    1. Zhang J., Xiang H., Liu J., Chen Y., He R.R., Liu B. Mitochondrial Sirtuin 3: new emerging biological function and therapeutic target. Theranostics. 2020;10:8315–8342. - PMC - PubMed
    1. Carrico C., Meyer J.G., He W., Gibson B.W., Verdin E. The mitochondrial acylome emerges: proteomics, regulation by sirtuins, and metabolic and disease implications. Cell Metabol. 2018;27:497–512. - PMC - PubMed
    1. Michishita E., Park J.Y., Burneskis J.M., Barrett J.C., Horikawa I. Evolutionarily conserved and nonconserved cellular localizations and functions of human SIRT proteins. Mol. Biol. Cell. 2005;16:4623–4635. - PMC - PubMed
    1. Wang C., Wang Y., Shen L. Mitochondrial proteins in heart failure: the role of deacetylation by SIRT3. Pharmacol. Res. 2021;172 - PubMed

Publication types

LinkOut - more resources