. 2022 Jul;607(7919):578-584.
doi: 10.1038/s41586-022-04890-z. Epub 2022 May 30.

Brain motor and fear circuits regulate leukocytes during acute stress

Affiliations

Brain motor and fear circuits regulate leukocytes during acute stress

Wolfram C Poller et al. Nature. 2022 Jul.

Abstract

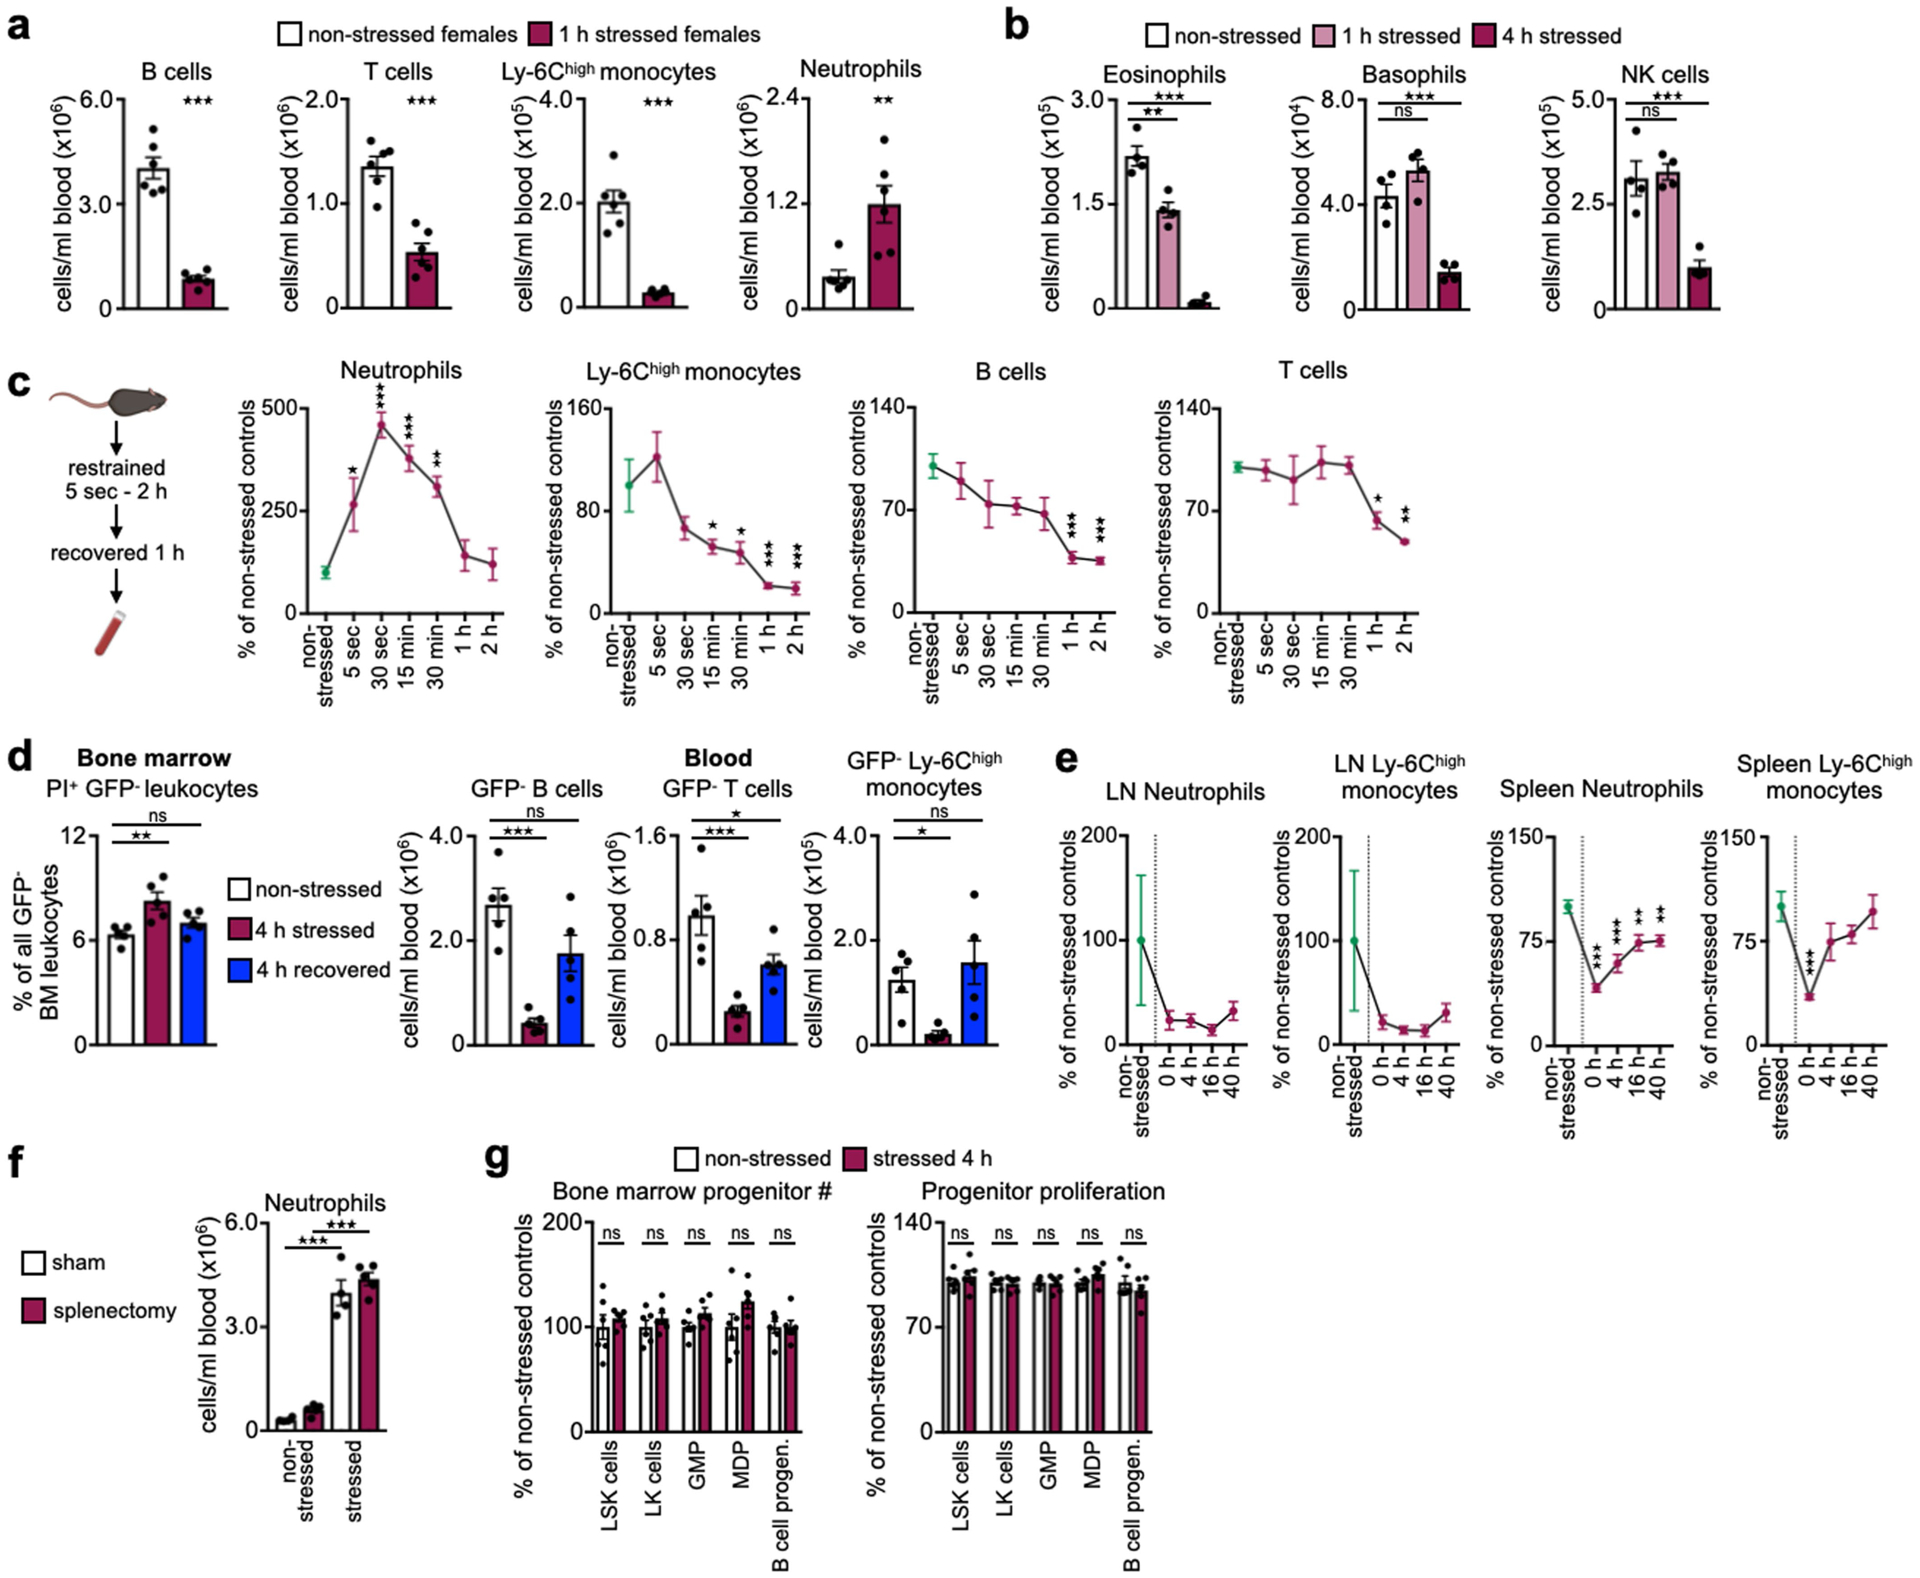
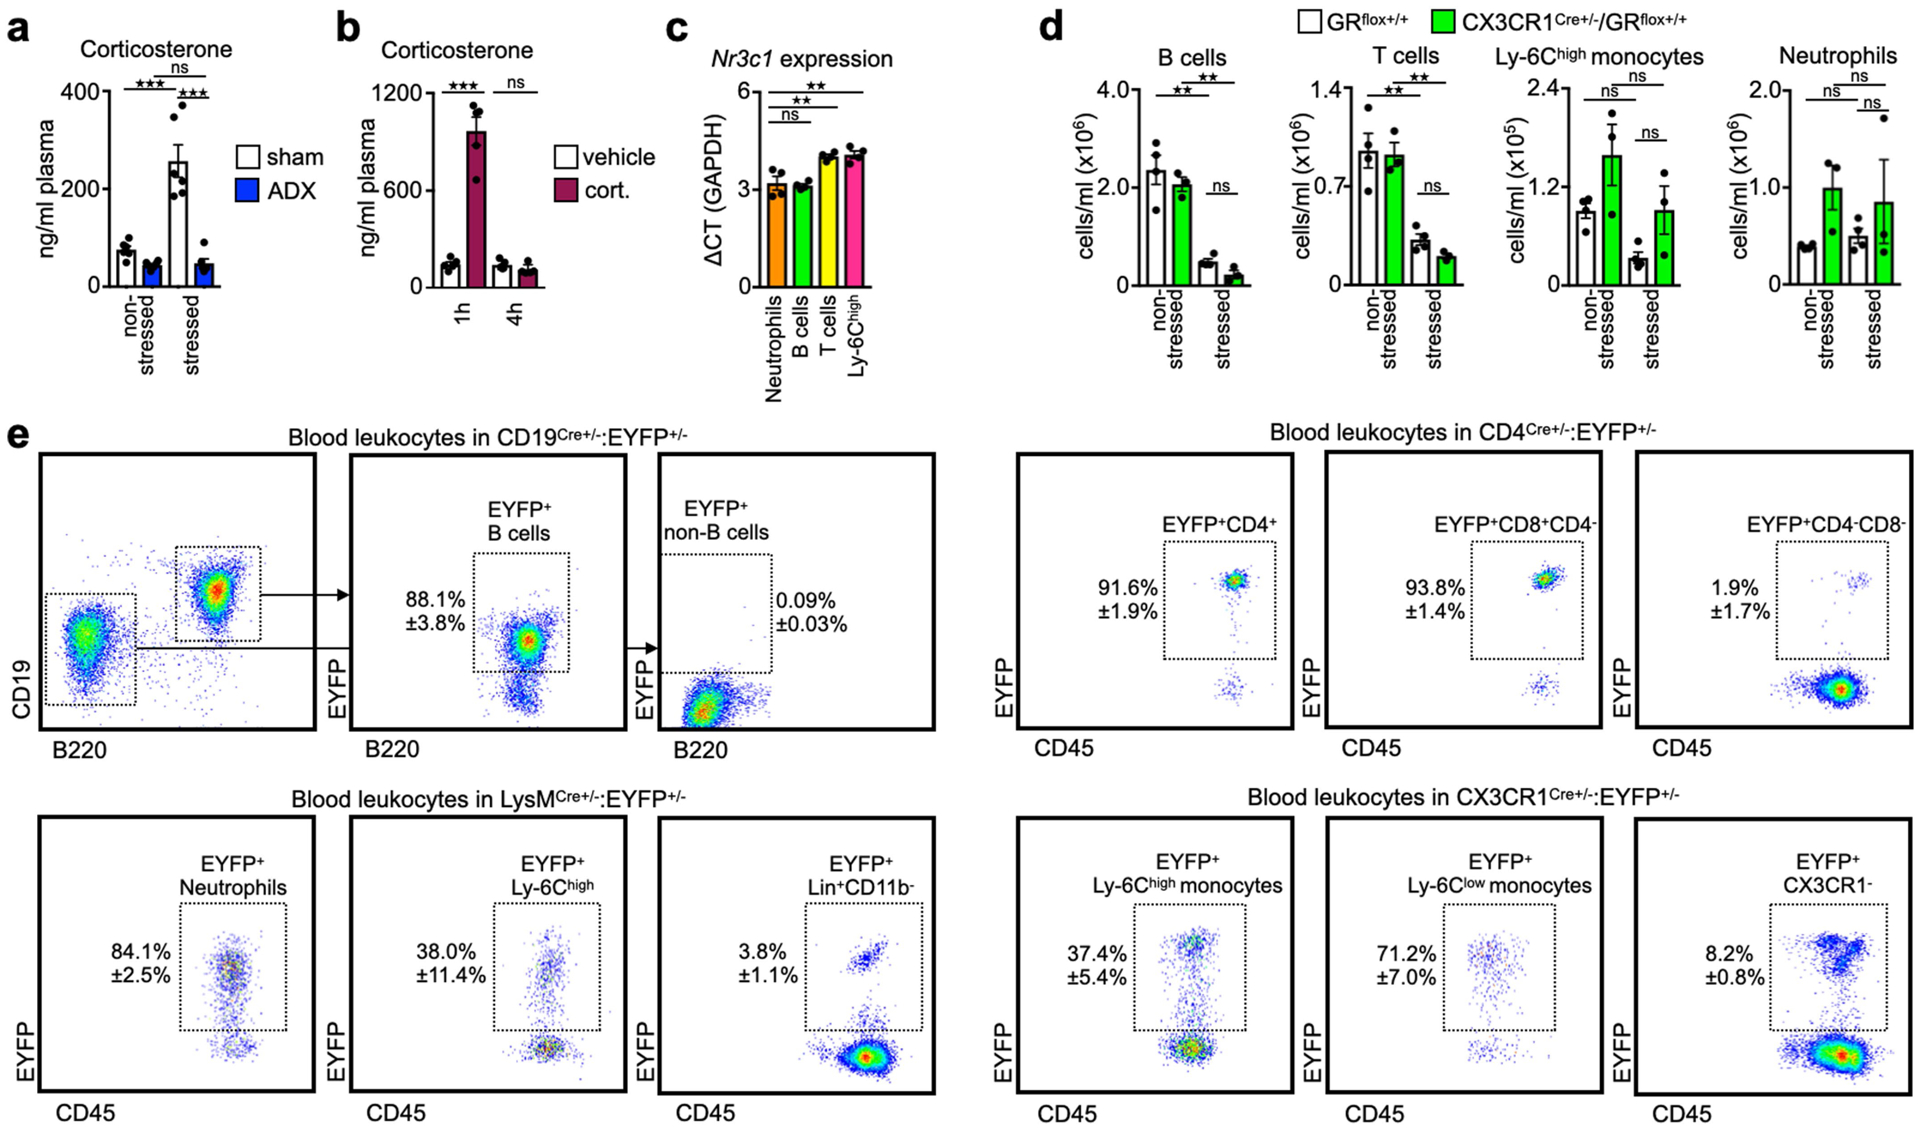
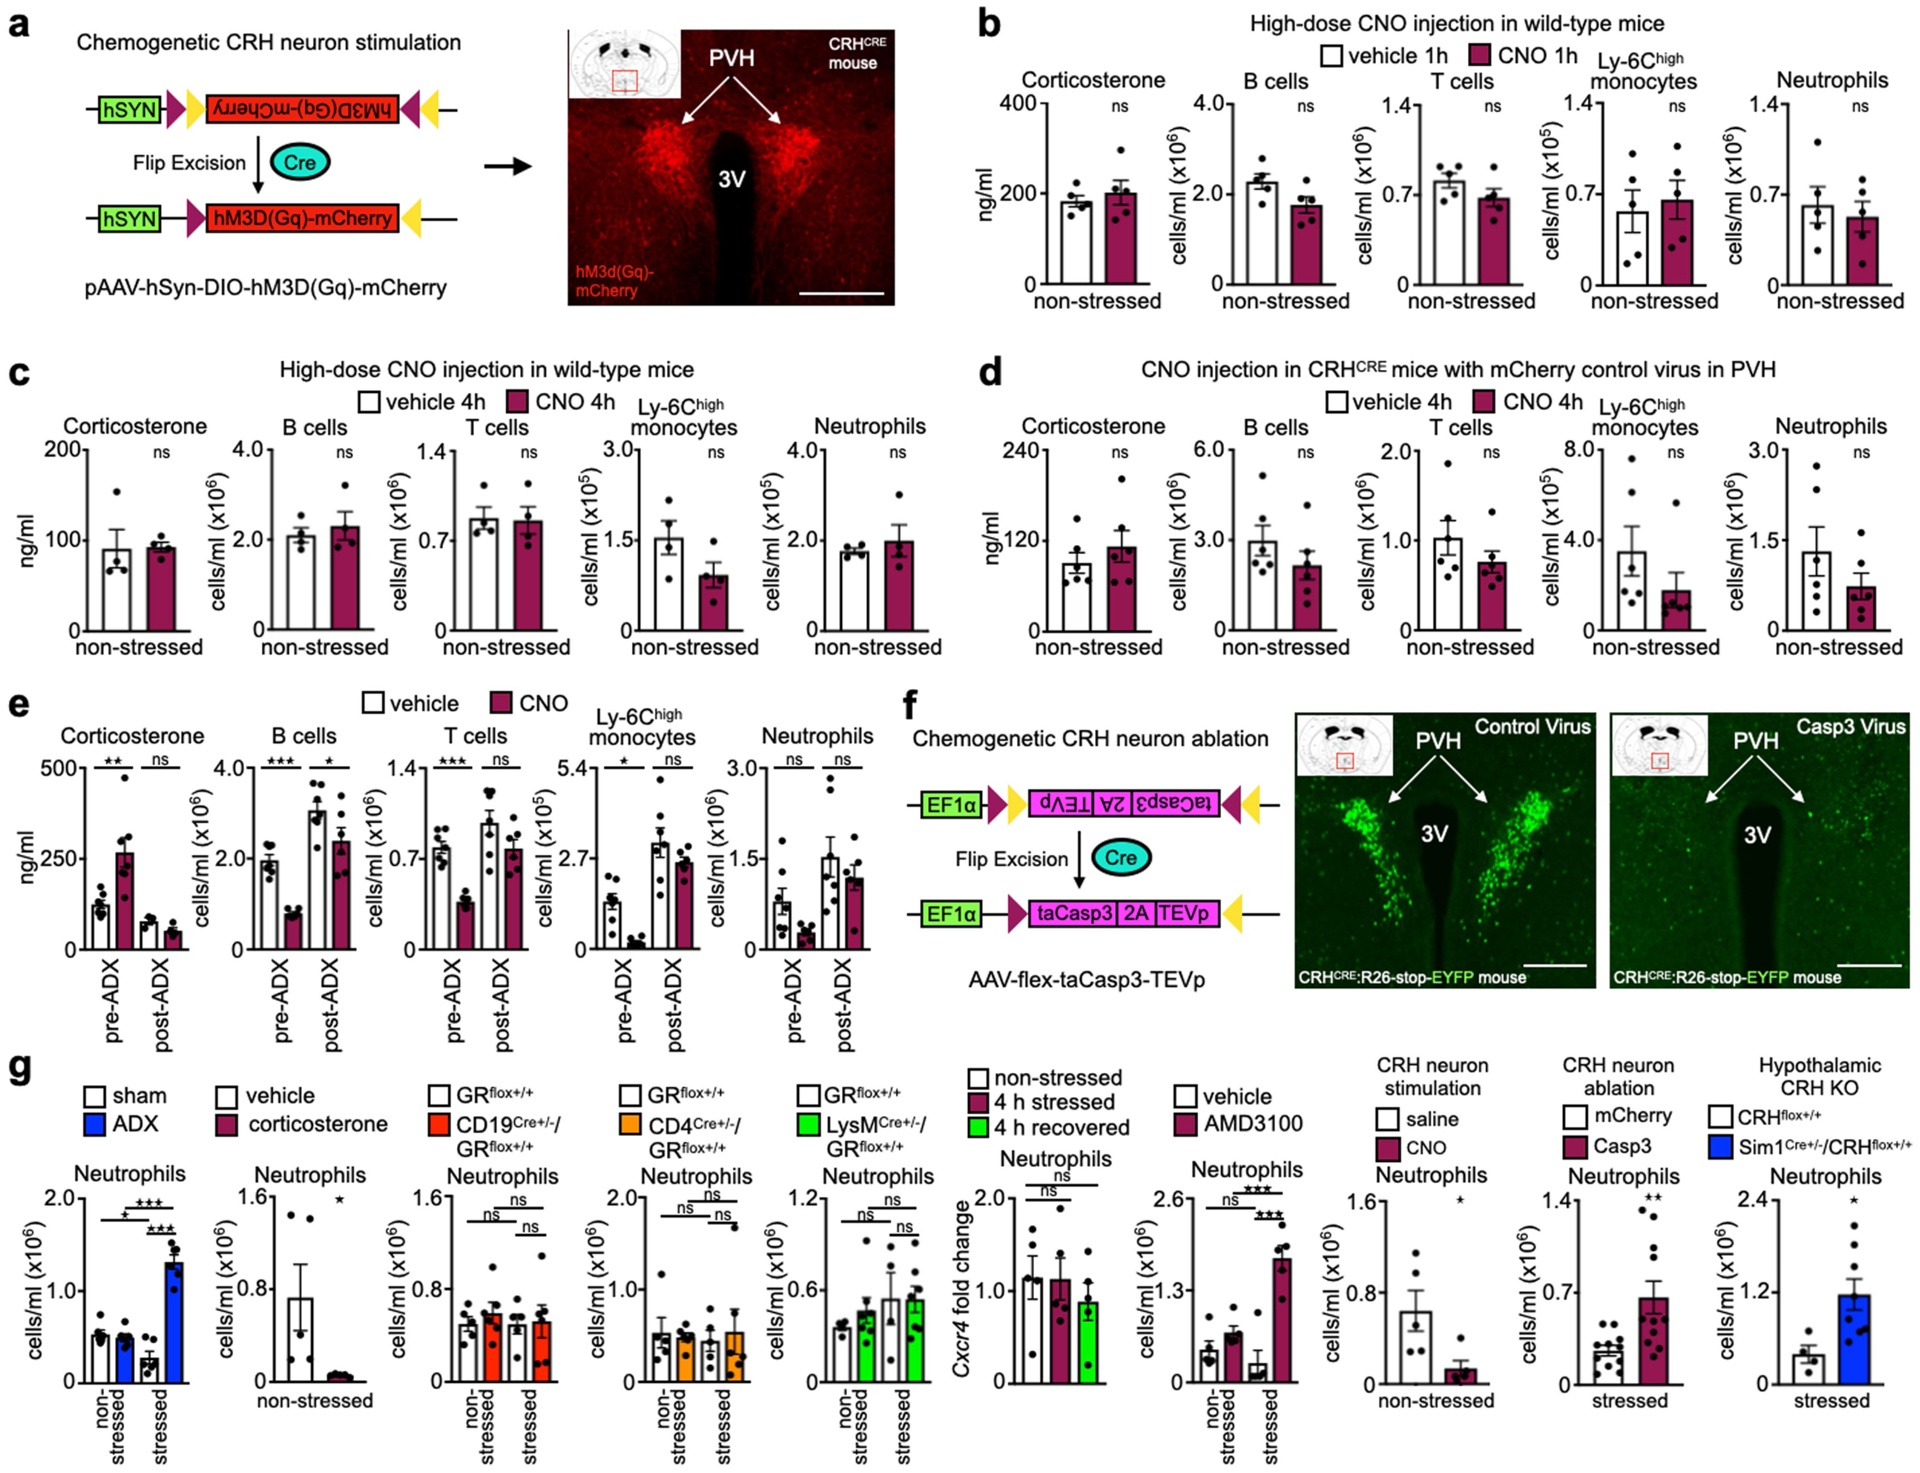
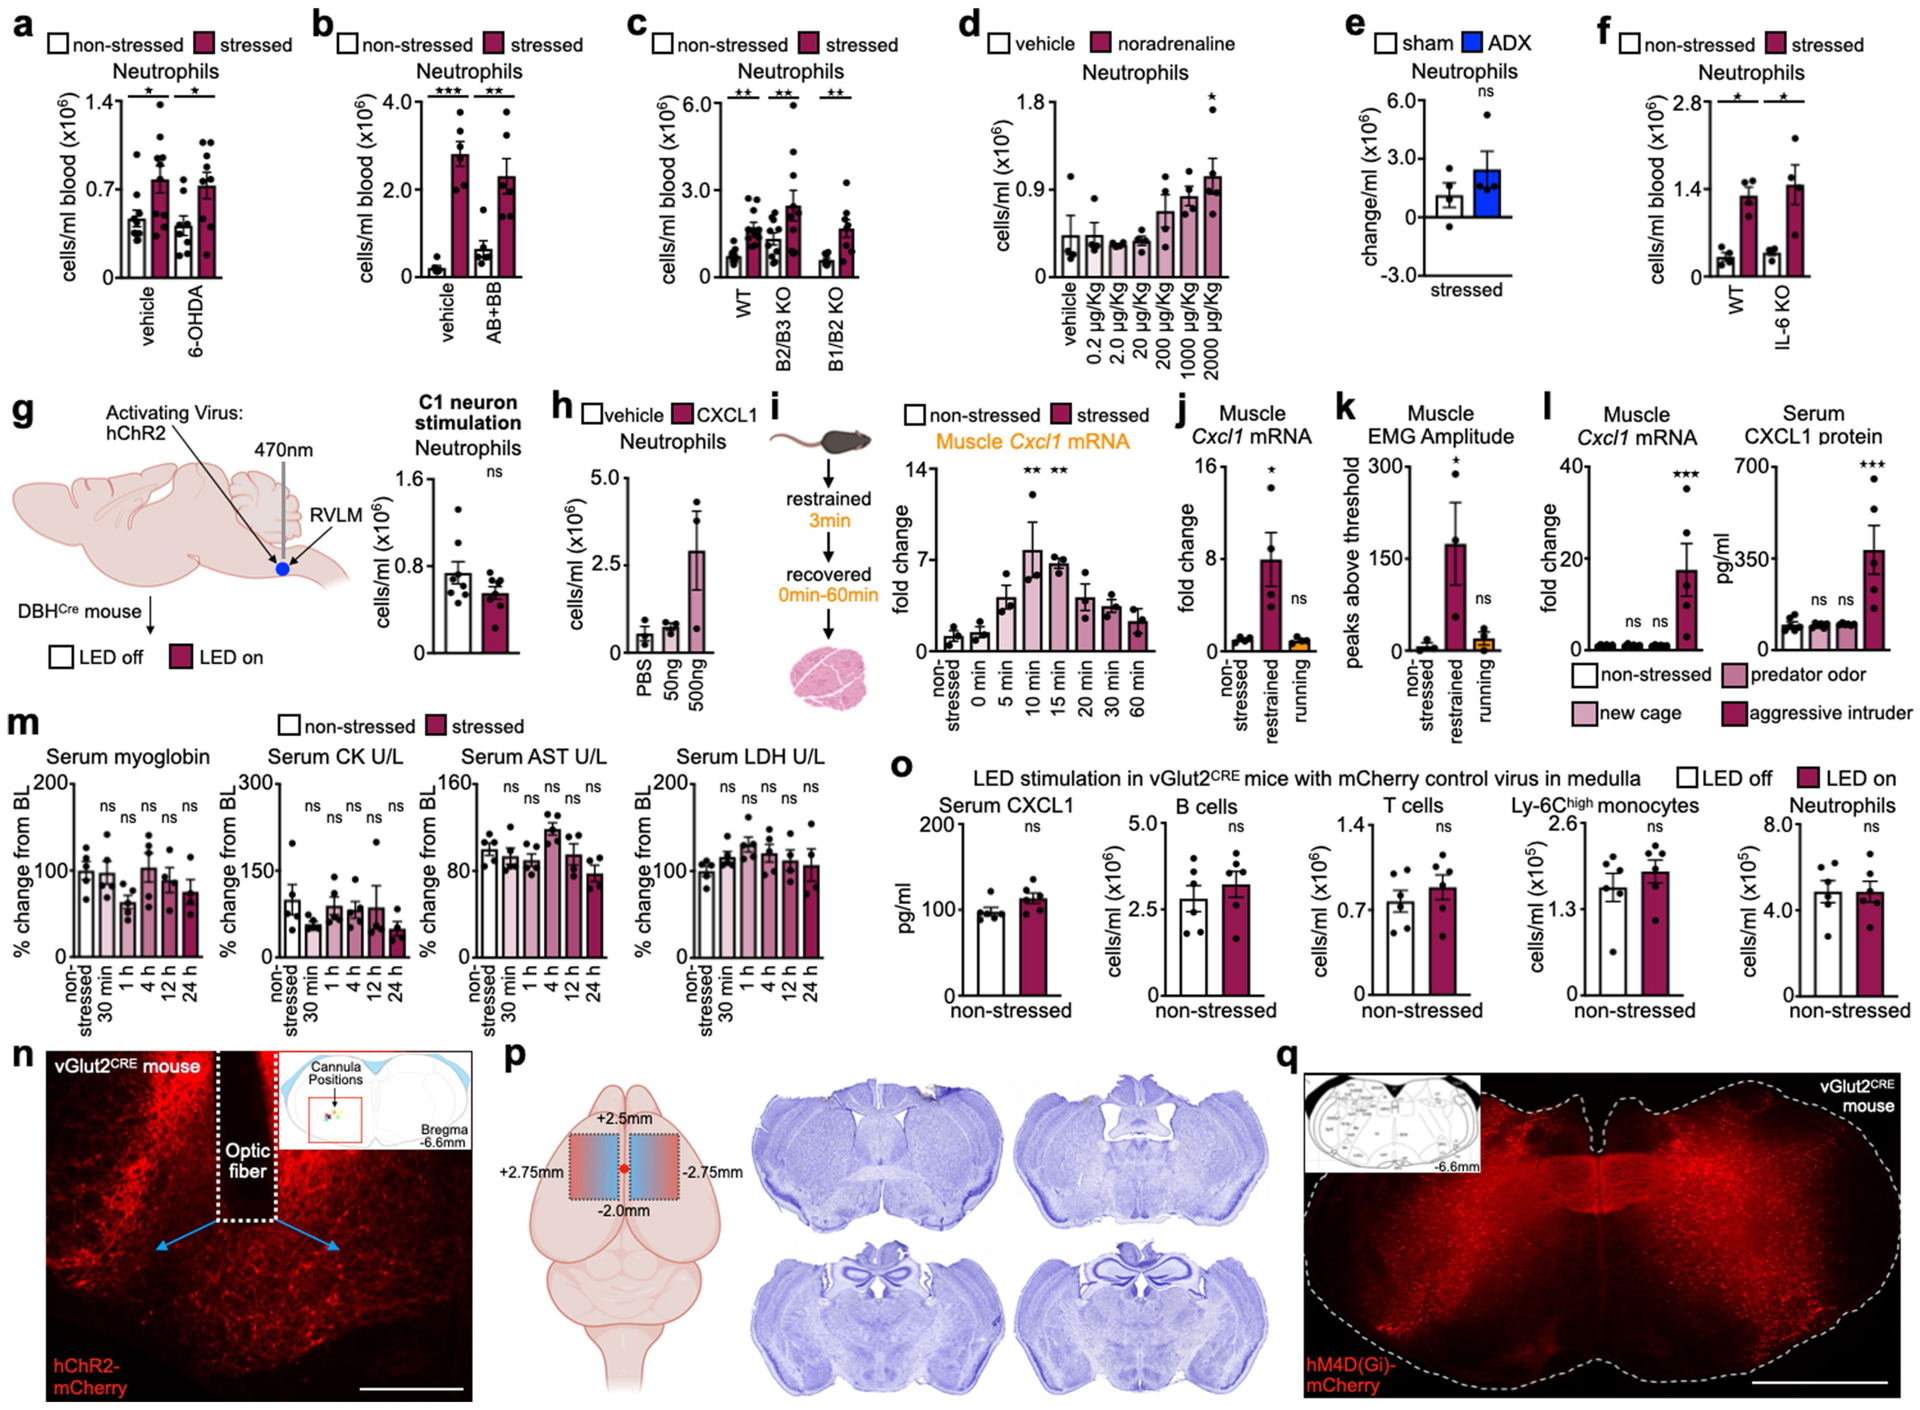
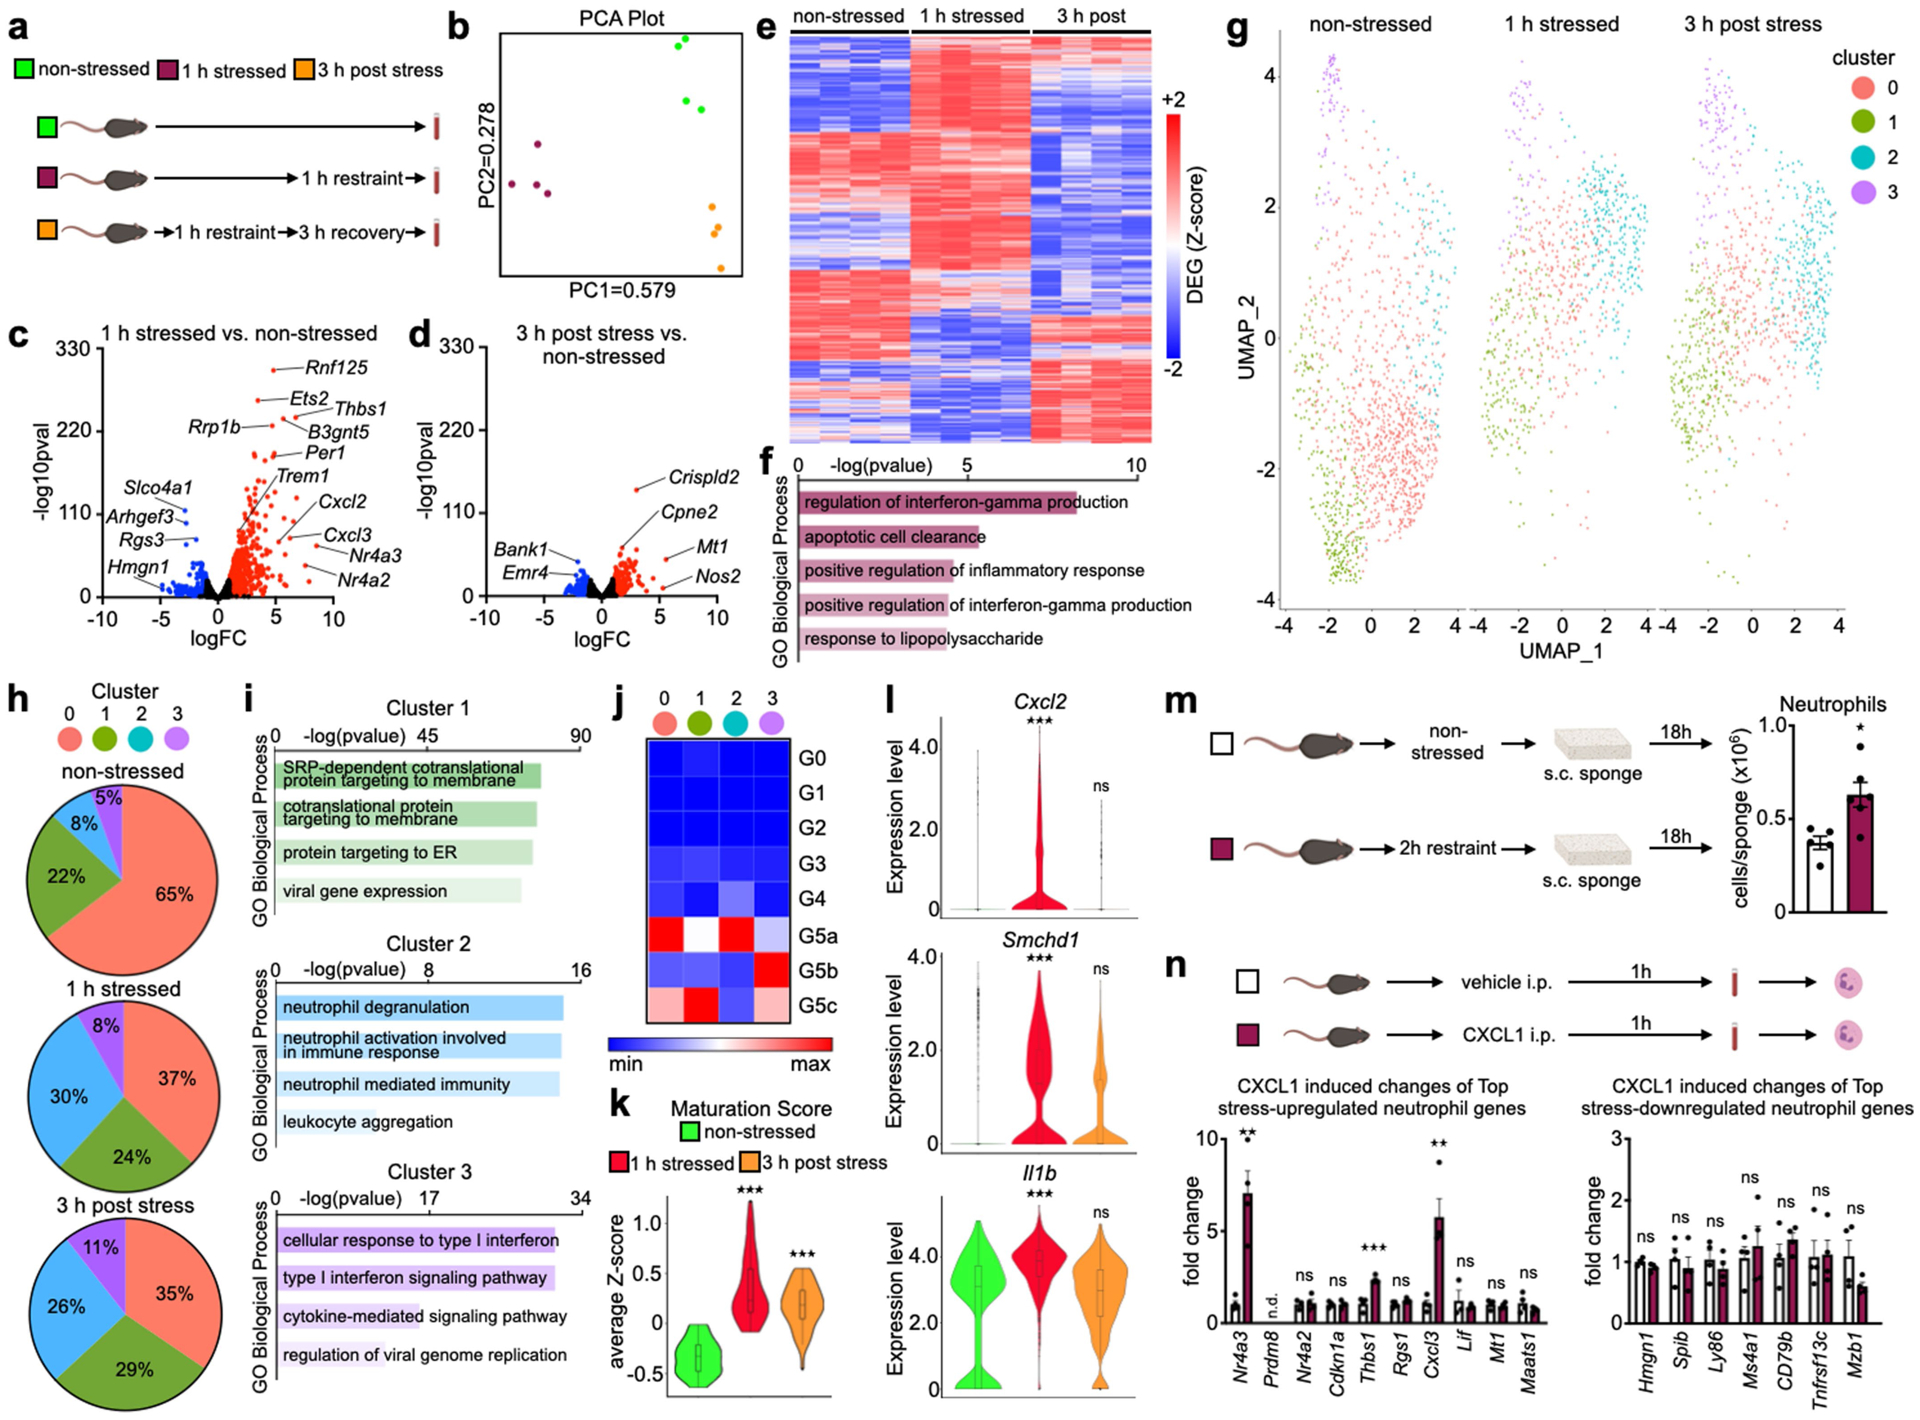
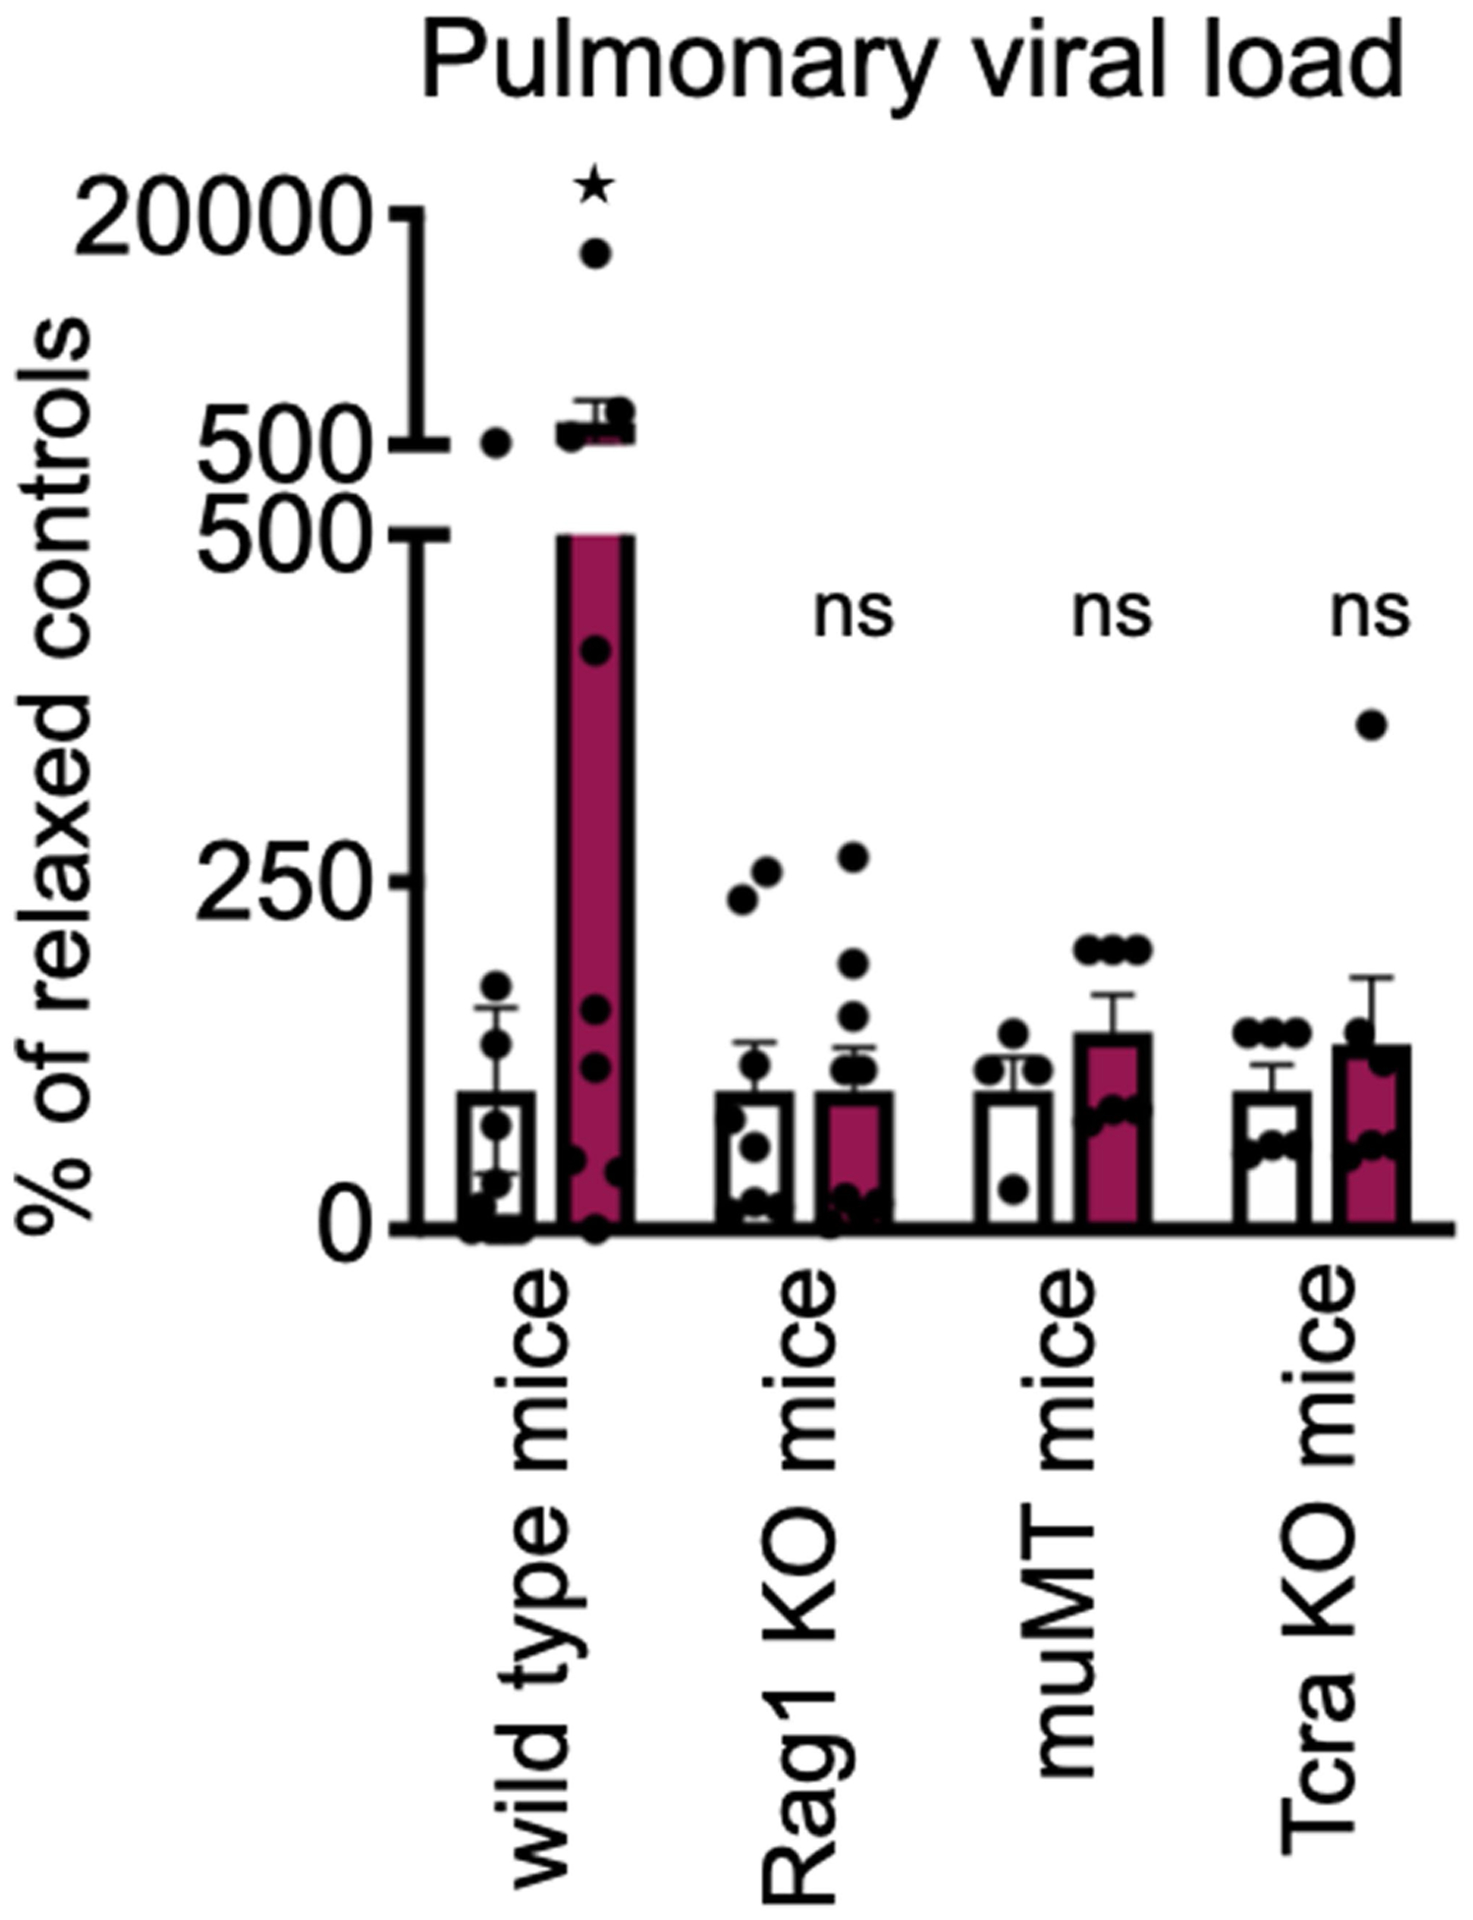
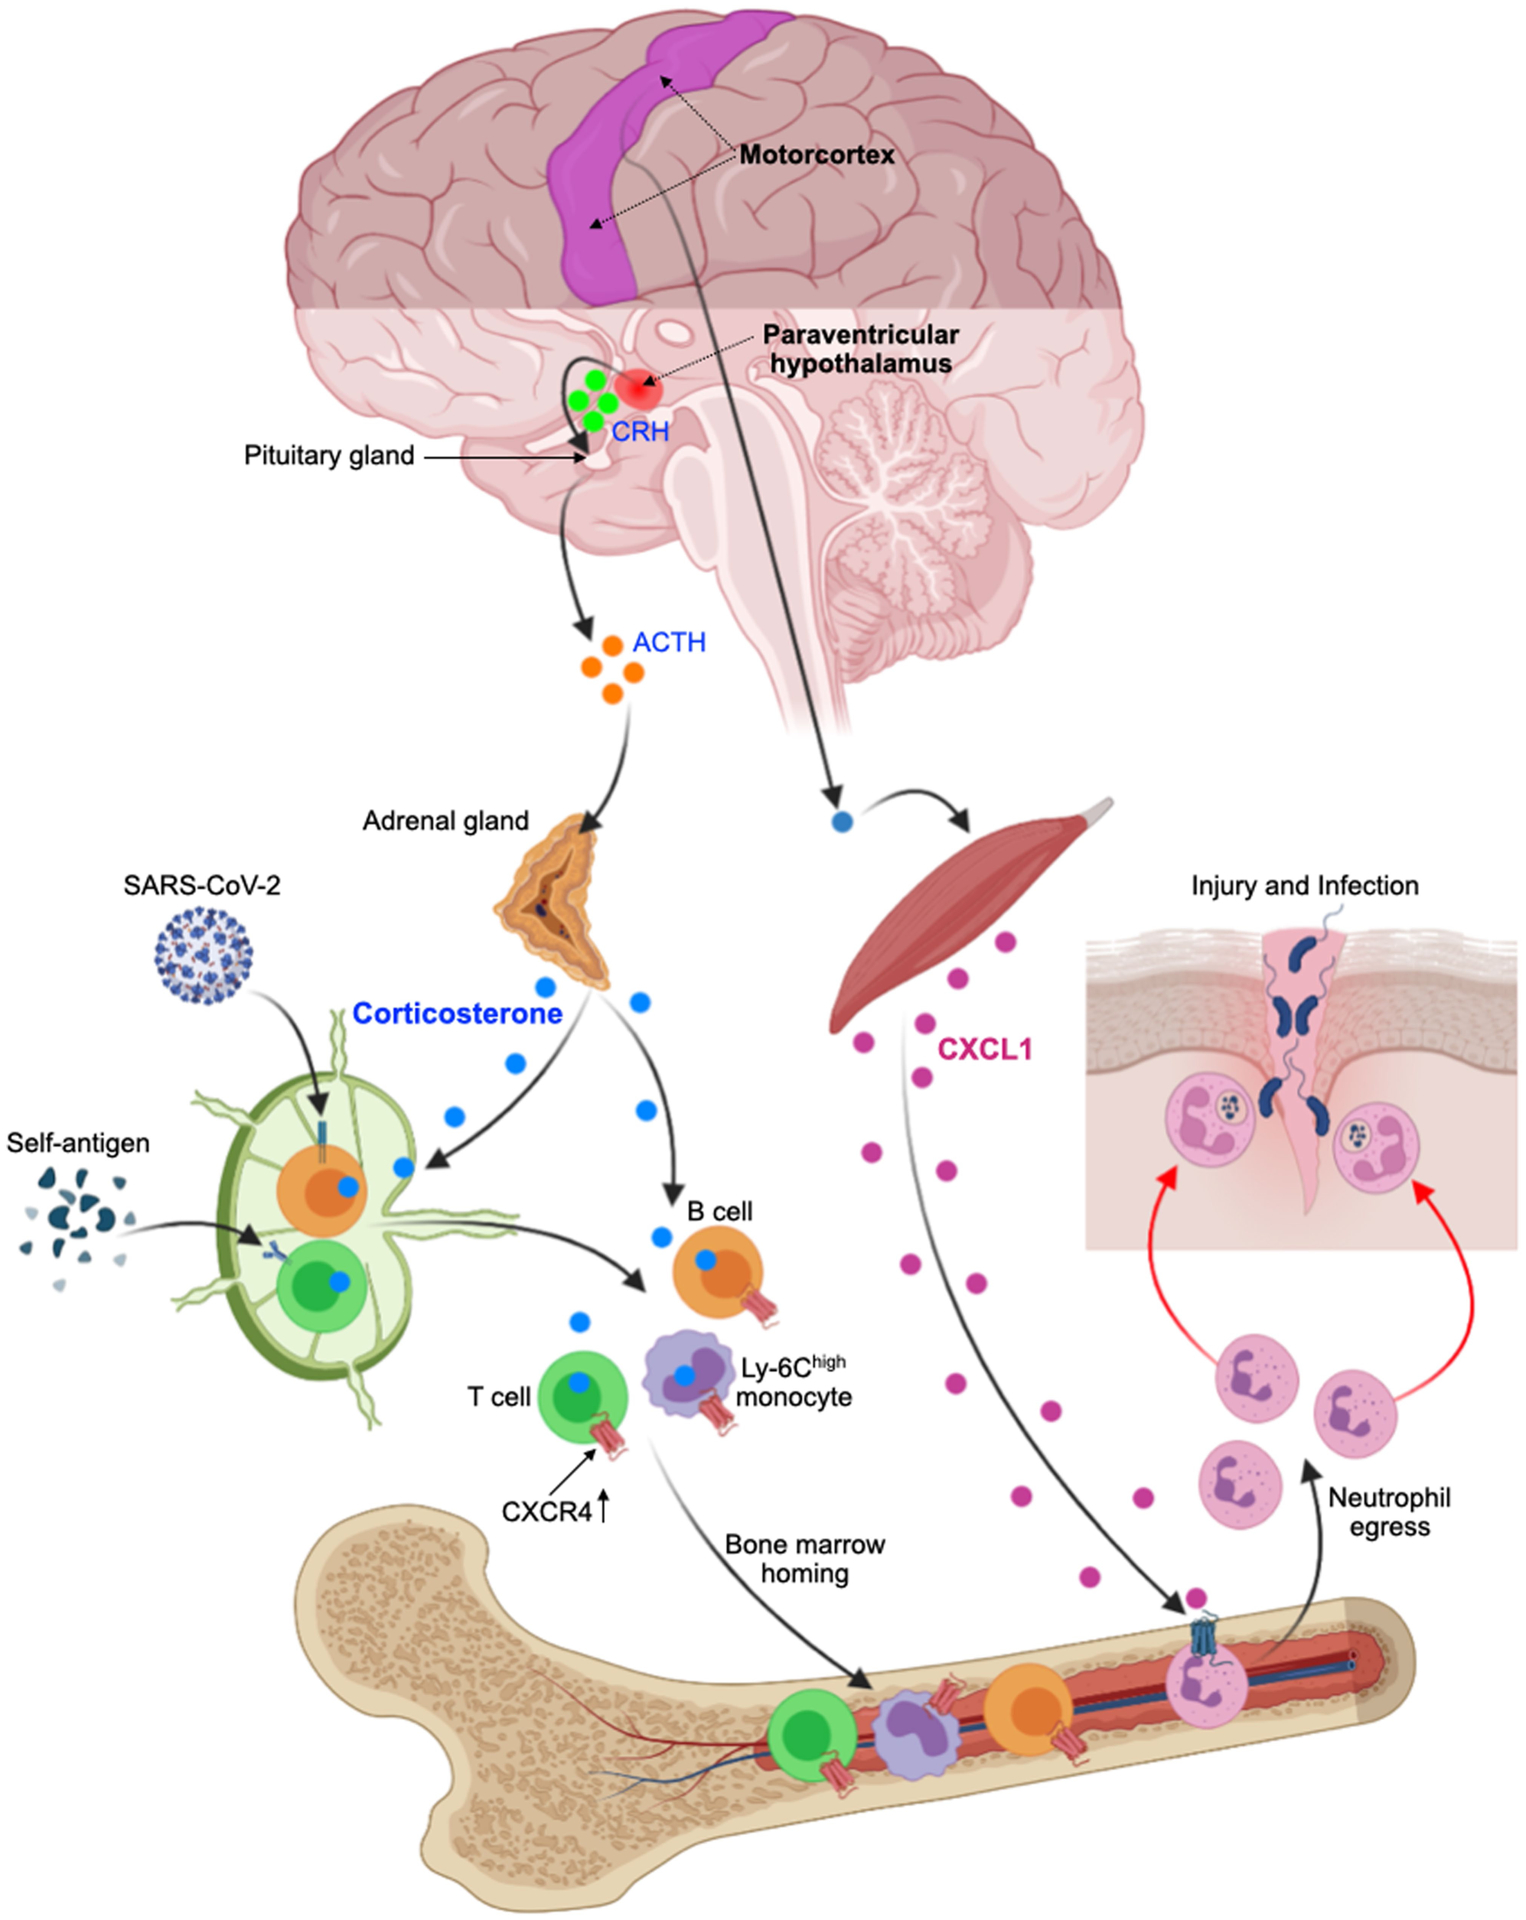
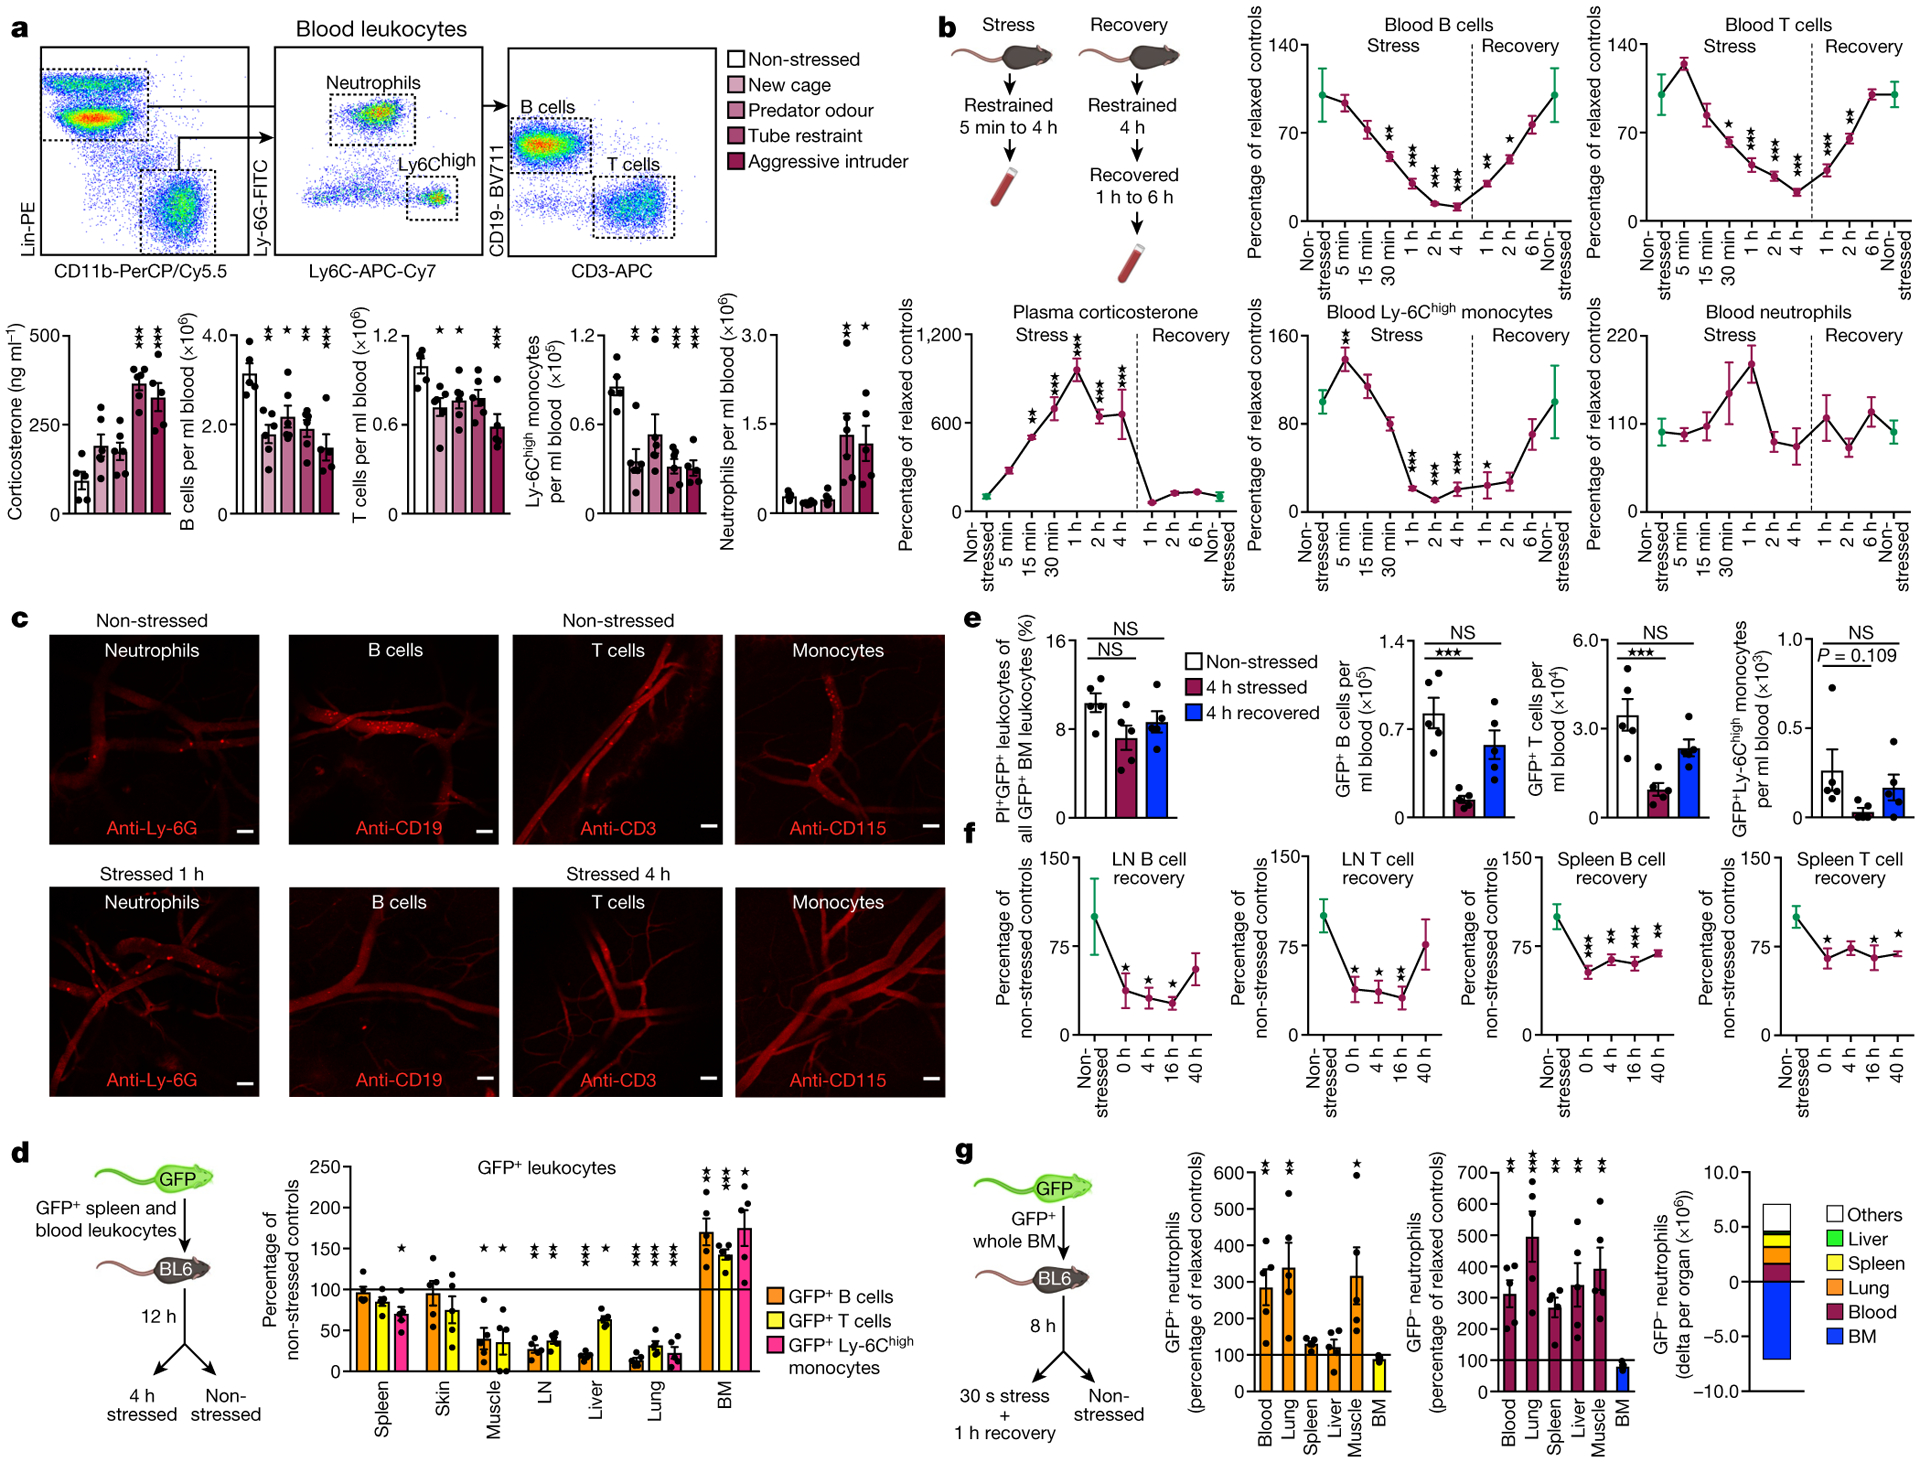
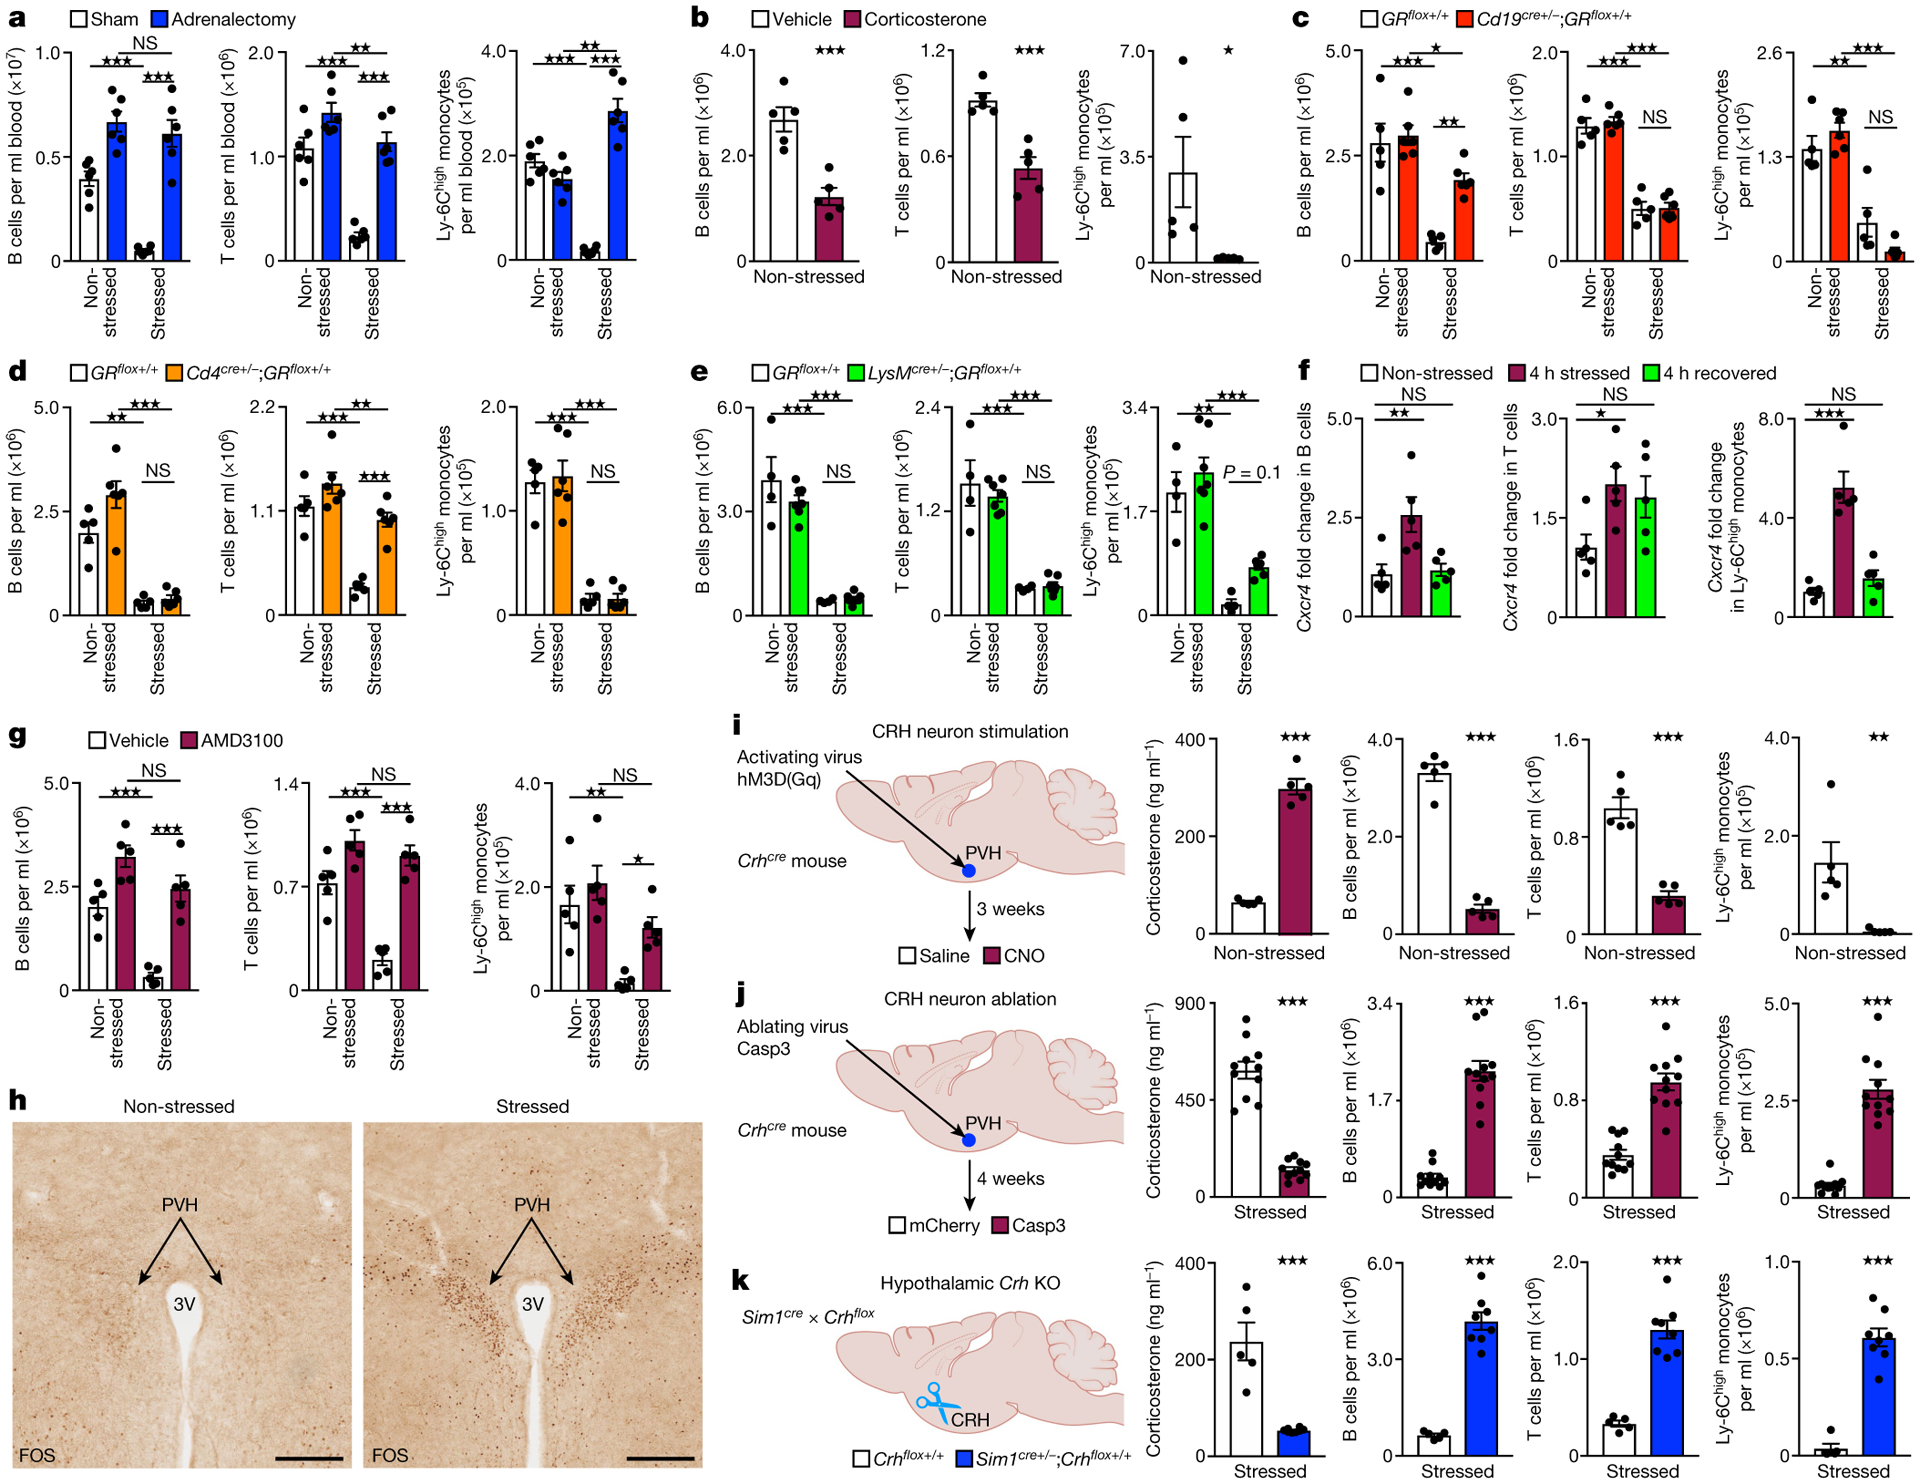
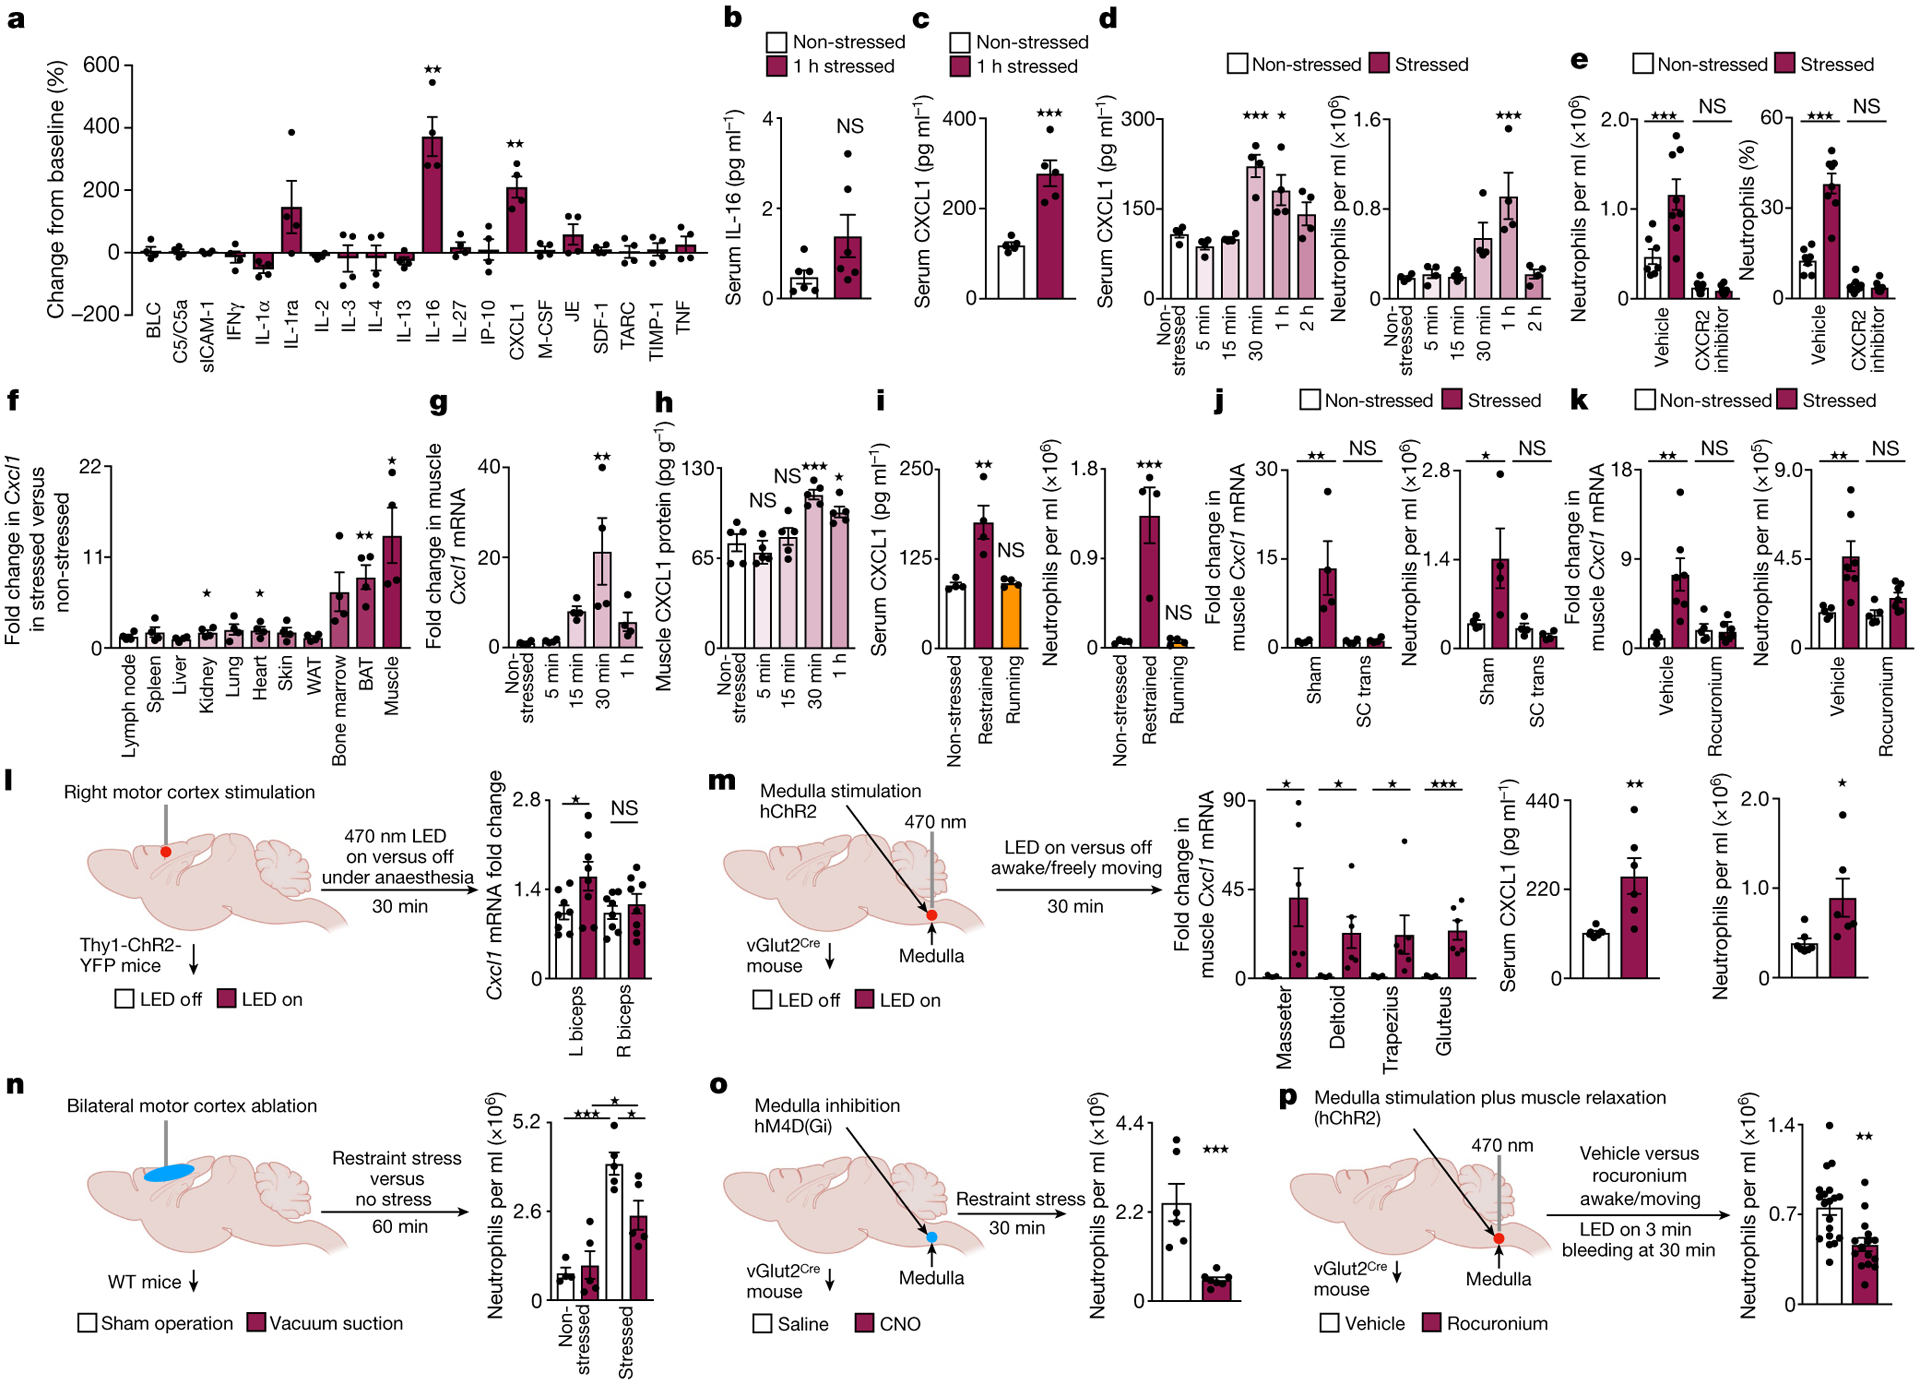
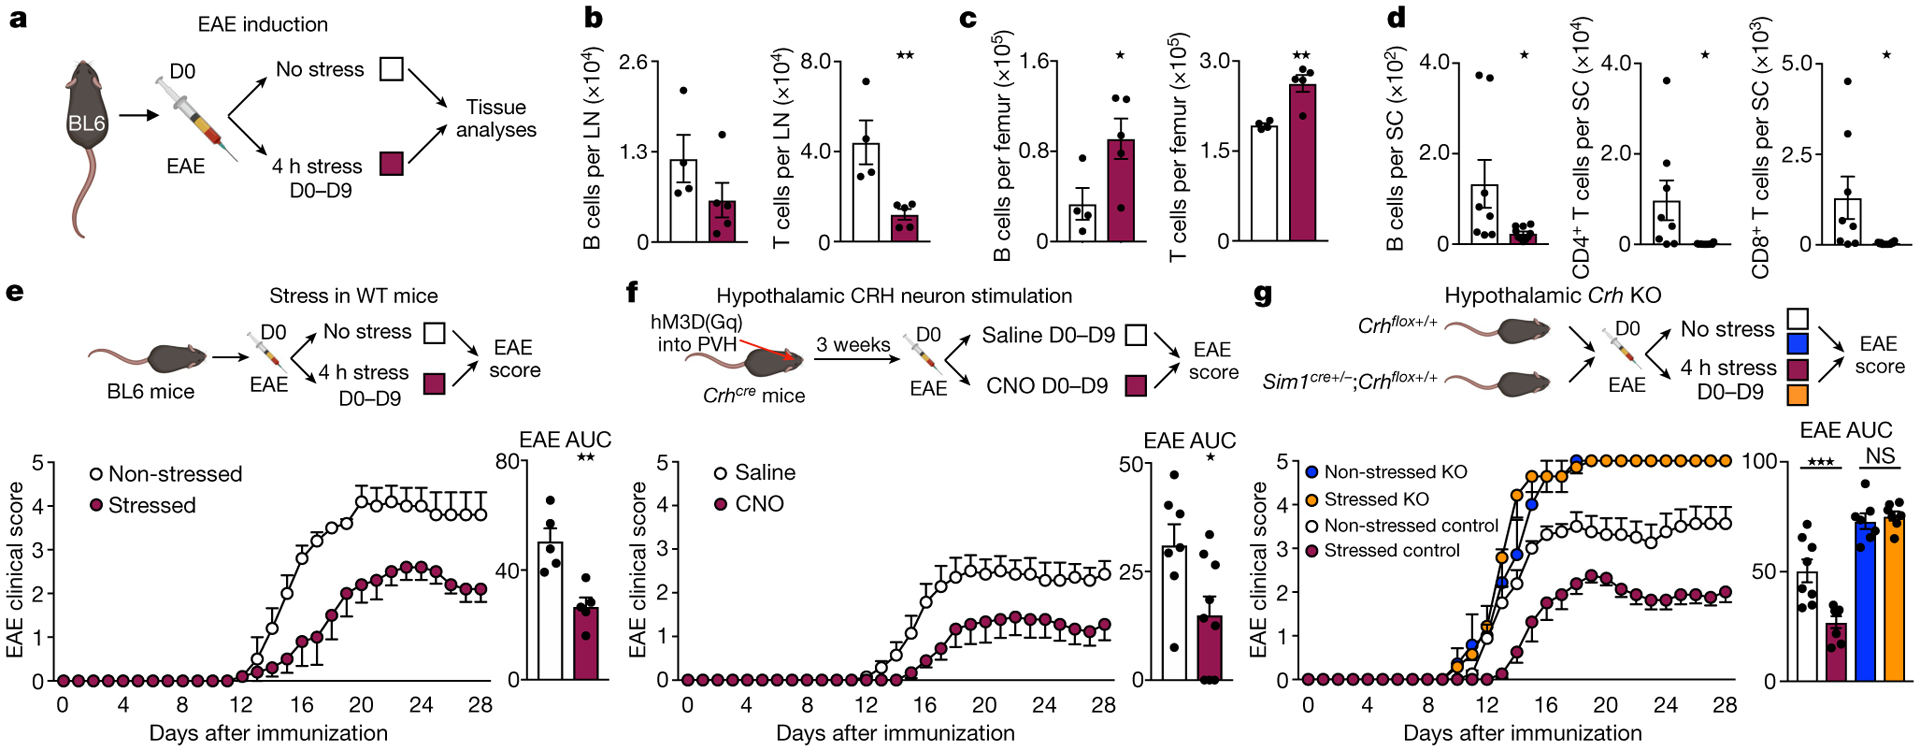
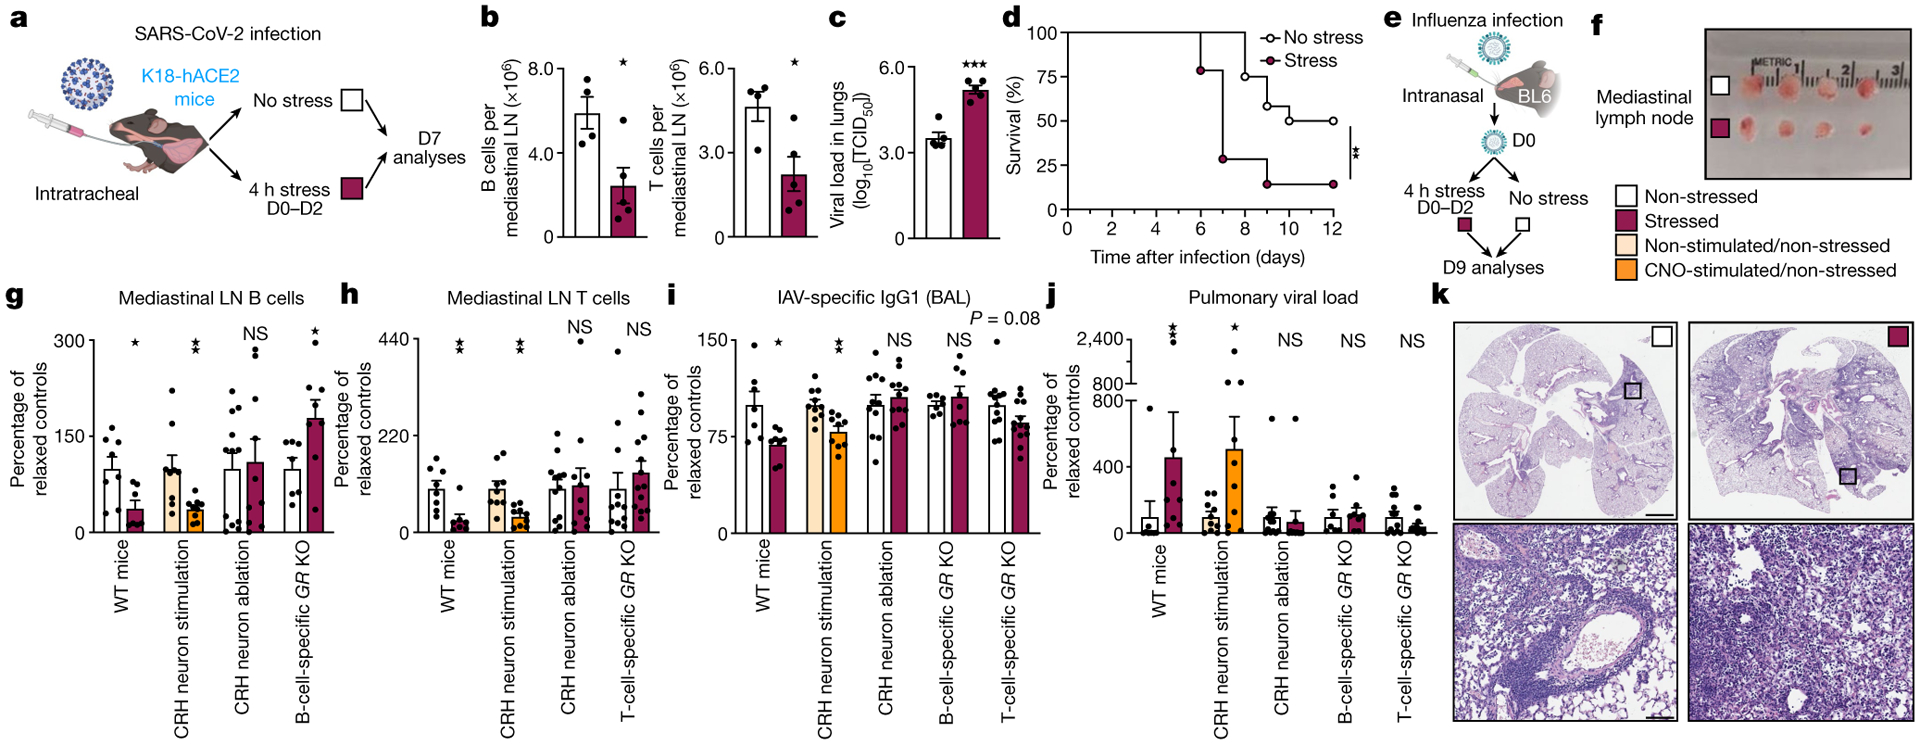
The nervous and immune systems are intricately linked1. Although psychological stress is known to modulate immune function, mechanistic pathways linking stress networks in the brain to peripheral leukocytes remain poorly understood2. Here we show that distinct brain regions shape leukocyte distribution and function throughout the body during acute stress in mice. Using optogenetics and chemogenetics, we demonstrate that motor circuits induce rapid neutrophil mobilization from the bone marrow to peripheral tissues through skeletal-muscle-derived neutrophil-attracting chemokines. Conversely, the paraventricular hypothalamus controls monocyte and lymphocyte egress from secondary lymphoid organs and blood to the bone marrow through direct, cell-intrinsic glucocorticoid signalling. These stress-induced, counter-directional, population-wide leukocyte shifts are associated with altered disease susceptibility. On the one hand, acute stress changes innate immunity by reprogramming neutrophils and directing their recruitment to sites of injury. On the other hand, corticotropin-releasing hormone neuron-mediated leukocyte shifts protect against the acquisition of autoimmunity, but impair immunity to SARS-CoV-2 and influenza infection. Collectively, these data show that distinct brain regions differentially and rapidly tailor the leukocyte landscape during psychological stress, therefore calibrating the ability of the immune system to respond to physical threats.


Conflict of interest statement

Competing interests The authors declare no competing interests.

Figures

Extended Data Fig. 1 |
Extended Data Fig. 1 |. Acute psychological stress induces large-scale bidirectional leukocyte shifts.
a, Quantification of circulating blood leukocytes after 1 h of restraint stress in female WT mice (n = 6 per group). Two-tailed unpaired t-test. b, Quantification of circulating blood eosinophils, basophils, and NK cells after 1h and 4h of restraint stress (n = 4 per group). One-way ANOVA. c, Quantification of circulating blood neutrophils, Ly-6Chigh monocytes, B cells, and T cells 1 h after cessation of a restraint stress episode with the indicated duration (expressed as percentage of the mean of non-stressed control mice, n = 4 mice per time point). One-way ANOVA. d, Analyses of endogenous GFP leukocytes from the GFP+ leukocyte transfer experiment shown in Fig. 1e. Assessment of cell death of endogenous GFP leukocytes in the bone marrow of recipient mice under non-stressed conditions, after restraint stress, and during stress recovery (PI+ GFP leukocytes in % of all bone marrow leukocytes; PI - propidium iodide). Quantification of endogenous GFP leukocytes in the blood of recipient mice under non-stressed conditions, after restraint stress, and during stress recovery (n = 5 mice per group). One-way ANOVA. e, Neutrophil and Ly-6Chigh monocyte numbers in inguinal lymph nodes (LN) and spleen measured after the indicated time of recovery from one 4 h restraint stress episode (expressed as percentage of the mean of non-stressed control mice, n = 4 mice in non-stressed LN analyses, otherwise n = 5 mice). One-way ANOVA. B cell and T cell data from the same experiment are shown in Fig. 1f. f, Quantification of circulating blood neutrophils under non-stressed baseline conditions and 40 min after cessation of a 20-min restraint stress episode in splenectomized versus sham-operated mice (n = 4 sham-operated mice, n = 5 splenectomized mice). Two-way ANOVA. g, Quantification of bone marrow progenitor cell numbers under non-stressed conditions and after one 4 h restraint stress episode expressed as percentage of the mean cell number of non-stressed control mice (n = 6 per group). Determination of bone marrow progenitor cell proliferation (4h BrdU pulse) under non-stressed conditions and after one 4 h restraint stress episode expressed as percentage of the mean proliferation rate of non-stressed control mice (n = 6 per group). Two-tailed unpaired t-test. Data are mean ±s.e.m.; P < 0.05, ★★P < 0.01, ★★★P < 0.001, statistical tests used as indicated.
Extended Data Fig. 2 |
Extended Data Fig. 2 |. The paraventricular hypothalamus controls leukocyte homing to the bone marrow during stress.
a, Quantification of plasma corticosterone levels in adrenalectomized (ADX) and sham-operated mice at baseline and after 4 h of restraint stress (n = 6 mice per group). Two-way ANOVA. b, Quantification of plasma corticosterone levels 1 h and 4 h after intraperitoneal injection of vehicle or corticosterone (5mg/kg) into WT mice (n = 5 mice per group). Two-way ANOVA. c, Transcript expression of Nr3c1 (GR) on sorted blood leukocytes expressed as ΔCT compared to the house-keeping gene Gapdh (CTmean Nr3c1 - CTmean Gapdh) (sorted cells from n = 4 samples, each sample pooled from n = 4 WT mice). One-way ANOVA. d, Quantification of circulating blood leukocytes in mice with CX3CR1Cre-driven knockout of the glucocorticoid receptor (CX3CR1Cre+/−:GRflox+/+) and control mice (GRflox+/+) at baseline and after 4 h of restraint stress (n = 3 CX3CR1Cre+/−:GRflox+/+ mice, and n = 4 GRflox+/+ mice). Two-way ANOVA. e, Gating strategies and percentages of cells expressing enhanced yellow fluorescent protein (EYFP+) within the indicated blood leukocyte populations in CD19Cre+/−:EYFP+/− reporter mice (n = 4), LysMCre+/−:EYFP+/− reporter mice (n = 12), CD4Cre+/−:EYFP+/− reporter mice (n = 3), and CX3CR1Cre+/−:EYFP+/− reporter mice (n = 2). Data are mean ±s.e.m.; P < 0.05, ★★P < 0.01, ★★★P < 0.001, statistical tests used as indicated.
Extended Data Fig. 3 |
Extended Data Fig. 3 |. Leukocyte homing during stress.
a, Schematic of Cre-mediated flip-excision activation of the activating chemogenetic virus pAAV-hSyn-DIO-hM3D(Gq)-mCherry. Representative injection site of pAAV-hSyn-DIO-hM3D(Gq)-mCherry in the PVH of a CRHCre mouse stained with anti-mCherry primary antibody and AF594-labelled secondary antibody (PVH, paraventricular hypothalamus; 3V, third ventricle). Scale bar indicates 400 μm. b, Determination of plasma corticosterone levels and quantification of circulating blood leukocytes 1 h after high-dose intraperitoneal injection of clozapine-N-oxide (CNO) versus vehicle in WT mice (n = 5 mice per group). Two-tailed unpaired t-test. c, Determination of plasma corticosterone levels and quantification of circulating blood leukocytes 4 h after high-dose intraperitoneal injection of clozapine-N-oxide (CNO) versus vehicle in WT mice (n = 4 mice per group). Two-tailed unpaired t-test. d, Determination of plasma corticosterone levels and quantification of circulating blood leukocytes 4 h after intraperitoneal injection of clozapine-N-oxide (CNO) versus vehicle in CRHCre mice that had previously received an mCherry control virus injection into the PVH (two experiments with changed groups combined, total of n = 6 mice per group). Two-tailed unpaired t-test. e, Determination of plasma corticosterone levels and quantification of circulating blood leukocytes 5 h after injection of vehicle or CNO into CRHCre mice that had received an hM3D(Gq) injection into the PVH 3 weeks prior, pre- and post adrenalectomy (ADX) (leukocyte analyses: n = 7 pre-ADX vehicle, n = 6 pre-ADX CNO, n = 7 post-ADX vehicle, n = 6 post-ADX CNO; corticosterone analyses: n = 7 pre-ADX vehicle, n = 7 pre-ADX CNO, n = 3 post-ADX vehicle, n = 4 post-ADX CNO)Two-way ANOVA. f, Schematic of Cre-mediated flip-excision activation of the apoptosis-inducing virus AAV-flex-taCasp3-TEVp. Representative images of the PVH of CRHCre:R26-stop-EYFP mice injected with either pAAV-hSyn-DIO-hM3D(Gq)-mCherry control virus (left image) or AAV-flex-taCasp3-TEVp ablating virus (right image) stained with anti-GFP primary antibody and AF488-labelled secondary antibody (PVH, paraventricular hypothalamus; 3V, third ventricle). Scale bars indicate 250 μm. g, Quantification of circulating blood neutrophils in the experiments presented in Fig. 2a–2g and 2i–2k (n numbers indicated in Fig. 2a–2g and 2i–2k). Two-way ANOVA or unpaired t-test as appropriate. Data are mean ±s.e.m.; P < 0.05, ★★P < 0.01, ★★★P < 0.001, statistical tests used as indicated.
Extended Data Fig. 4 |
Extended Data Fig. 4 |. Central motor circuits control neutrophil egress from the bone marrow during acute stress.
a, Quantification of circulating blood neutrophils under non-stressed conditions and after 1 h of restraint stress in sympathectomized (6-OHDA) vs. vehicle-treated mice (2 experiments combined, n = 10 non-stressed vehicle-treated mice, n = 10 non-stressed 6-OHDA-treated mice, n = 8 stressed vehicle-treated mice, n = 8 stressed 6-OHDA-treated mice). Two-way ANOVA. b, Quantification of circulating blood neutrophils under non-stressed conditions and 40 min after a 20 min restraint stress episode in high-dose alpha-(phentolamine, 30mg/Kg) and beta-adrenergic receptor blocker (propranolol, 30mg/Kg) vs. vehicle-treated mice (n = 6 per group). The non-stressed baseline was collected 75 min after the i.p. injection of vehicle or alpha-/−and beta-blocker. Two-way ANOVA. c, Quantification of circulating blood neutrophils under non-stressed conditions and after 1 h of restraint stress in WT mice, beta 2/beta 3 adrenergic receptor double knockout mice (B2/B3 KO), and beta 1/beta 2 adrenergic receptor double knockout mice (B1/B2 KO) (n = 11 WT mice, n = 10 B2/B3 KO mice, n = 8 B1/B2 KO mice). The non-stressed baseline was collected from the same mice one week apart from the actual stress experiment, at the same time of the day. Data from the B1/B2 KO mice were generated in an independent experiment. Two-way ANOVA. d, Quantification of circulating blood neutrophils in WT mice 1 h after injection of vehicle or the indicated doses of noradrenaline (n = 5 in the 2000μg/Kg group, n = 4 in all other groups). One-way ANOVA. e, Change in circulating blood neutrophil numbers induced by 1 h of restraint stress in adrenalectomized (ADX) vs. sham-operated WT mice (calculated as neutrophil number after 1h h of stress - leukocyte number at baseline; n = 4 mice per group). Unpaired t-test. f, Quantification of circulating blood neutrophils under non-stressed conditions and after 1 h of restraint stress in WT mice vs. interleukin-6 (IL-6) knockout mice (n = 4 per group). Two-way ANOVA. g, Schematic of optogenetic approach used to stimulate hChR2-expressing neurons in the rostroventrolateral medulla (RVLM) of DBH Cre mice. Quantification of circulating blood neutrophils 55 min after a 5 min LED stimulation period compared to hChR2-injected DBHCre mice without light stimulation (cross-over design with each mouse analysed with and without LED stimulation 1d apart, total of n = 8 per group). Two-tailed unpaired t-test. h, Quantification of circulating blood neutrophils in WT mice 1 h after injection of vehicle or the indicated doses of CXCL1 (n = 3 per group). i, Cxcl1 transcript expression in the gluteal muscle measured after the indicated time of recovery from a 3 min restraint stress episode (expressed as fold change from non-stressed control mice, n = 3 mice per time point). One-way ANOVA. j, Cxcl1 transcript expression in the gluteal muscle measured immediately after 1 h of restraint stress vs voluntary running on a running wheel compared to non-stressed control mice without a running wheel (n = 4 per group). One-way ANOVA. k, Wireless EMG telemetry recordings from the gluteal and upper leg musculature in WT mice under conditions of restraint stress vs voluntary running on a running wheel compared to non-stressed controls without a running wheel (each mouse was recorded under each condition on subsequent days during their active period, data expressed as number of amplitude peaks above a mouse-specific threshold of 0.2 mV (2 mice) or 0.4 mV (1 mouse) during the first 10min of restraint) (n = 3 mice total, each recorded under each condition as outlined above). One-way ANOVA. l, Cxcl1 transcript expression in the gluteal muscle and CXCL1 protein levels in the serum measured in WT mice immediately after 1 h of exposure to the indicated stressor compared to non-stressed controls (Cxcl1 transcript expression expressed as fold change from non-stressed control mice (n = 5 in the aggressive intruder group, n = 6 in all other groups). One-way ANOVA. m, Muscle damage parameters in blood serum at different time points after the onset of a 30 min restraint stress episode, compared to non-stressed controls. Serum myoglobin measured by ELISA. Serum creatine kinase (CK), aspartate aminotransferase (AST), and lactate dehydrogenase (LDH) activities in units/liter (U/L) were determined by IDEXX BioAnalytics (n = 5 non-stressed mice, n = 5 mice 30min post stress onset, n = 5 mice 1h post stress onset, n = 5 mice 4h post stress onset, n = 4 mice 12h post stress onset, n = 4 mice 24h post stress onset). One-way ANOVA. n, Representative injection site of the channelrhodopsin encoding virus pAAV-EF1a-double floxed-hChR2(H134R)-mCherry-WPRE-HGHpA with optic fibre position in the medulla of a vGlut2Cre mouse stained with anti-mCherry primary antibody and AF594-labelled secondary antibody. Optic cannula positions indicated in the inset. Scale bar indicates 500 μm. o, CXCL1 protein levels in the serum and circulating blood leukocyte numbers measured immediately after 30 min of LED stimulation (LED on) compared no-LED stimulation (LED off) in vGlut2Cre mice that had previously received an mCherry control virus injection with cannula implantation into the medulla (two experiments with changed groups combined, total of n = 6 mice per group). Two-tailed unpaired t-test. p, Schematic of the bilateral motor cortex ablation approach with coordinates indicated as distance from Bregma. Representative Cresyl Violet stained brain sections showing the extend of ablation. q, Representative bilateral injection sites of the inhibitory DREADD encoding virus pAAV-hSyn-DIO-hM4D(Gi)-mCherry in the medulla of a vGlut2Cre mouse stained with anti-mCherry primary antibody and AF594-labelled secondary antibody. Scale bar indicates 1000 μm. Data are mean ±s.e.m.; P < 0.05, ★★P < 0.01, ★★★P < 0.001, statistical tests used as indicated.
Extended Data Fig. 5 |
Extended Data Fig. 5 |. Acute stress induces neutrophil reprogramming and their recruitment to wounds.
a, Schematic of experimental approach. b, Principal component analysis (PCA) plot of RNAseq data of blood neutrophils (CD45+; Lin; CD11b+; Ly-6G+) sorted from WT mice under non-stressed conditions, after 1 h of restraint stress, and 3 h after a 1 h restraint stress episode (n = 4 samples per group, each sample pooled from 3 mice, total 36 mice). c, Volcano plot indicating differentially regulated genes (FC > 2.0, FDR < 0.05, p < 0.05) in blood neutrophils from 1 h stressed versus non-stressed mice. d, Volcano plot indicating differentially regulated genes (FC > 2.0, FDR < 0.05, p < 0.05) in blood neutrophils from mice 3 h post stress versus non-stressed mice. e, Heatmap of differentially expressed genes in blood neutrophils sorted from WT mice under non-stressed conditions, after 1 h of restraint stress, and 3 h after a 1 h restraint stress episode (n = 4 mice per group). f, Pathway analysis of significantly regulated genes between 1 h stressed versus non-stressed (FC > 2.0, FDR < 0.05, p < 0.05) using the Enricher with GO Biological Process 2018. g, Uniform manifold approximation and projection (UMAP) plots of single-cell RNAseq data of blood neutrophils (CD45+; Lin; CD11b+; Ly-6G+) sorted from non-stressed as well as 1 h-stressed and 1h-stressed plus 3 h-recovered mice revealing 4 different neutrophil clusters. h, The four neutrophil clusters’ relative contributions to the overall blood neutrophil population under non-stressed conditions and in response to stress and recovery. i, Pathway analysis of the different clusters based on the top 50 cluster-defining genes using the Enricher with GO Biological Process 2018. j, Heatmap comparing the similarities between the four peripheral blood neutrophil clusters defined in our study with those described in a recent single-cell analysis of neutrophil heterogeneity in blood (G5a-G5c) and bone marrow (G0-G4). k, Neutrophil maturation score determined based on the expression of maturation-related genes. One-way ANOVA. Violin plots show l, Violin plots showing the expression levels of key neutrophil products including Cxcl2, Smchd1, and Il1b under non-stressed conditions and in response to stress and recovery. One-way ANOVA. Violin plots show m, Schematic of experimental approach used to test the effect of acute stress on neutrophil recruitment into a sterile subcutaneous sponge. Quantification of neutrophils in the sponge (18h after implantation) in WT mice that were either stressed for 2h immediately prior to the sponge implantation or remained non-stressed (n = 5 non-stressed, n = 6 restraint stressed). n, Schematic of experimental approach used to sort blood neutrophils 1 h after intraperitoneal injection of CXCL1 (500 ng) or vehicle. Transcript expression analyses of the top up- and down-regulated genes in response to stress identified in the bulk RNA sequencing experiment (non-stressed vs. 1h stressed) 1 h after injection of CXCL1 versus vehicle in non-stressed mice (transcript expression expressed as fold change from vehicle-injected control mice; n = 4 samples per group, each pooled from 3 WT mice, total 24 mice). Unpaired t-test. Data are mean ±s.e.m.; P < 0.05, ★★P < 0.01, ★★★P < 0.001, statistical tests used as indicated.
Extended Data Fig. 6 |
Extended Data Fig. 6 |. Requirement of B and T cells in stress-induced changes in viral titres after IAV infection.
Standard MDCK plaque assay determined viral load in the lungs of stressed versus non-stressed (stress scheme outlined in Fig. 5e) WT mice, Rag1 KO mice, muMT mice, and Tcra KO mice on day 9 post IAV infection, expressed as percentage of the average of the respective non-stressed control mice (n = 11 non-stressed WT mice and n = 9 stressed WT mice, two experiments compiled; n = 8 non-stressed Rag1 KO mice and n = 9 stressed Rag1 KO mice, two experiments compiled; n = 4 non-stressed muMT mice and n = 6 stressed muMT mice, n = 6 non-stressed Tcra KO mice and n = 6 stressed Tcra KO mice). Two-tailed Mann-Whitney test.
Extended Data Fig. 7 |
Extended Data Fig. 7 |. Brain motor and fear circuits differentially regulate leukocyte distribution and function during acute stress.
Model of brain-immune interactions and their consequences during acute stress. The motor cortex induces rapid neutrophil mobilization from the bone marrow to peripheral tissues and atherosclerotic plaques via skeletal muscle derived neutrophil-attracting chemokine CXCL1. Conversely, the paraventricular hypothalamus controls lymphocyte and monocyte migration from blood and secondary lymphoid organs to the bone marrow through leukocyte-intrinsic glucocorticoid signalling, thereby altering the acquisition of adaptive immunity to viral infections and self antigens. Figure created with BioRender. com. Abbreviations: CRH - corticotropin releasing hormone; ACTH - adrenocorticotropic hormone; CXCR4 - C-X-C chemokine receptor type 4; CXCL1 - chemokine (C-X-C motif) ligand 1.
Fig. 1 |
Fig. 1 |. Acute psychological stress induces leukocyte shifts.
a, The gating strategy and the indicated measurements in mice exposed to psychological stressors for 1 h. n = 5 (non-stressed and aggressive intruder) and n = 6 (new cage, predator odour and tube restraint) mice. b, Blood leukocytes and plasma corticosterone levels measured at the indicated times. ‘Stress’ indicates the timepoint directly after restraint stress. n = 4 mice per timepoint. ‘Recovery’ indicates the timepoint after the indicated time of recovery from a 4 h restraint. n = 4 mice per timepoint. c, Intravital microscopy of blood leukocyte populations after the indicated stress durations. Scale bar, 50 μm. d, Experimental schematic and quantification of transferred GFP+ leukocytes in different organs. n = 5 mice per group. e, Assessment of cell death of transferred GFP+ leukocytes in the bone marrow and quantification of GFP+ leukocytes in the blood of recipient mice under the indicated conditions. n = 5 mice per group. f, B cell and T cell numbers in inguinal lymph nodes (LN) and spleen measured after the indicated time of recovery from one 4 h restraint stress episode. n = 4 (non-stressed LN analyses) and n = 5 (other analyses) mice. g, Experimental schematic and quantification of transferred GFP+ and endogenous GFP neutrophils in different organs expressed as a percentage of the mean neutrophil number in the respective organ in non-stressed control mice. n = 6 (non-stressed) and n = 5 (stressed) mice. Estimated body-wide total loss of endogenous GFP neutrophils from the bone marrow plotted against estimated total gain of endogenous GFP neutrophils in most relevant peripheral destinations. For a, b and dg, data are mean ± s.e.m. Statistical analysis was performed using one-way analysis of variance (ANOVA) (a, b, e and f) and two-tailed unpaired t-tests (d and g); P < 0.05, ★★P < 0.01, ★★★P < 0.001.
Fig. 2 |
Fig. 2 |. The PVH controls leukocyte homing to the bone marrow during stress.
a, Blood leukocytes in the indicated groups at the baseline and after 4 h of restraint. n = 6 mice per group. b, Blood leukocytes after injection of vehicle or corticosterone into wild-type (WT) mice. n = 5 mice per group. ce, Blood leukocytes of mice with B-cell-specific (n = 5 (control) and n = 6 (KO) mice) (c), T-cell-specific (n = 5 (controls) and n = 6 (KO) mice) (d) and myeloid-specific (n = 4 (control) and n = 7 (KO) mice) (e) KO of the GR at the baseline and after 4 h of restraint. f, Transcript expression of Cxcr4 in sorted blood leukocytes of WT mice under the indicated conditions. n = 5 mice per group. g, Blood leukocytes in WT mice that were injected with CXCR4 inhibitor versus vehicle under the indicated conditions. n = 4 groups, n = 5 mice per group. AMD3100 or vehicle was injected intraperitoneally 30 min before stress onset. Control mice injected with AMD3100 and vehicle remained non-stressed until bleeding at 4.5 h after injection. h, Immunohistological staining of FOS+ neurons in the PVH of non-stressed control mice and restraint-stressed mice. 3V, third ventricle. Scale bars, 200 μm. i, Experimental schematic, plasma corticosterone and circulating leukocytes 5 h after intraperitoneal injection of clozapine-N-oxide (CNO) or vehicle. n = 5 mice per group. j, Experimental schematic, plasma corticosterone and circulating leukocytes in response to a 4 h restraint episode in mice injected with Caspase-3 virus versus mCherry-control virus. Total from two combined experiments; n = 11 mice per group. k, Experimental schematic, plasma corticosterone and circulating leukocytes in response to a 4 h restraint episode in hypothalamic Crh-KO mice (n = 8 (Sim1cre+/;Crhflox+/+)) and control mice (n = 5 (Crhflox+/+)). For ag and ik, data are mean ± s.e.m. Statistical analysis was performed using one-way (f) and two-way (a, c, d, e and g) ANOVA, and two-tailed unpaired t-tests (b and ik); P < 0.05, ★★P < 0.01, ★★★P < 0.001.
Fig. 3 |
Fig. 3 |. Central motor circuits control neutrophil egress from the bone marrow during acute stress.
a, Plasma cytokines after 1 h restraint. n = 4 mice per group. b, IL-16 serum levels. n = 6 mice per group. c, CXCL1 serum levels. n = 5 mice per group. d, CXCL1 serum levels and blood neutrophil numbers after restraint. n = 4 mice per group. e, Blood neutrophils in mice treated with vehicle versus CXCR2 inhibitor under non-stressed conditions and after 1 h restraint. n = 7–8 mice per group. f, Transcript expression of Cxcl1 in different organs after 30 min of restraint. n = 4 mice per group. g, Cxcl1 expression in gluteal muscle after the indicated restraint durations. n = 4 mice per group. h, CXCL1 protein in skeletal muscle. n = 5 mice per group. i, Serum CXCL1 and blood neutrophil numbers after 1 h restraint versus voluntary running. n = 4 mice per group. j, Cxcl1 expression in gluteal muscle and blood neutrophil numbers in spinal-cord-transected (SC trans) mice after 30 min restraint. n = 4 mice per group. k, Cxcl1 expression in gluteal muscle and blood neutrophil numbers in mice that were treated with muscle relaxant (rocuronium) 15 min after a 3 min restraint stress episode. n = 4–7 per group. l, Experimental schematic and Cxcl1 expression in the left (L) and right (R) biceps muscles in the indicated groups. Two experiments combined; total n = 8 mice per group. m, Experimental schematic, Cxcl1 expression in the indicated muscles, serum CXCL1 protein and blood neutrophil numbers in the indicated groups. n = 6–7 per group. n, Experimental schematic and blood neutrophil numbers under the indicated conditions. n = 4–5 per group. o, Experimental schematic and neutrophil numbers in the indicated groups. n = 6–7 per group. p, Experimental schematic and neutrophil numbers in the indicated groups. Two experiments with changed groups combined; n = 15 and 19 mice per group. For ap, data are mean ± s.e.m. Statistical analysis was performed using one-way (d and gi) and two-way (e, jl and n) ANOVA, and two-tailed unpaired t-tests (ac, f, m, o and p); P < 0.05, ★★P < 0.01, ★★★P < 0.001.
Fig. 4 |
Fig. 4 |. Acute stress protects against the acquisition of autoimmunity.
a, Experimental schematic. b,c, Quantification of IgD+ B cells and T cells in the inguinal lymph nodes (b) and bone marrow (c) in the indicated groups. n = 4 (non-stressed) and n = 5 (stressed) mice. d, Quantification of leukocytes in the spinal cord (SC) in the indicated groups 14 d after EAE induction. n = 8 (non-stressed) and n = 10 (stressed) mice. e, Experimental schematic and EAE clinical score in the indicated groups. n = 5 (non-stressed) and n = 5 (stressed) mice. Area under the curve (AUC) of the EAE clinical score. f, Experimental schematic and EAE clinical score in the indicated groups. n = 7 (saline-injected) and n = 9 (CNO-injected) mice; two experiments combined. AUC of the EAE clinical score. g, Experimental schematic and EAE clinical score in the indicated groups. n = 8 (non-stressed Crhflox+/+ control), n = 8 (stressed Crhflox+/+ control), n = 7 (non-stressed Sim1cre+/;Crhflox+/+ KO) and n = 7 (stressed Sim1cre+/;Crhflox+/+ KO) mice. AUC of the EAE clinical score. For bg, data are mean ± s.e.m. Statistical analysis was performed using two-way ANOVA (g)) and two-tailed unpaired t-tests (b–f); P < 0.05, ★★P < 0.01, ★★★P < 0.001.
Fig. 5 |
Fig. 5 |. Acute stress impairs the acquisition of immunity to SARS-CoV-2 and influenza.
a, Experimental schematic. b, Lymphocytes in the lymph nodes. n = 4–5 mice per group. c, Pulmonary viral loads. n = 5 mice per group. d, Survival curves. n = 12 (non-stressed) and n = 14 (stressed) mice; two experiments. ek, Mice were infected with a sublethal dose of IAV. e, Experimental schematic. f, Images of the mediastinal lymph nodes. g, B cells in the mediastinal lymph nodes of WT, PVH CRH-neuron-ablated and B-cell-specific GR-KO mice, as well as of mice with chemogenetic PVH-CRH neuron stimulation (dark orange) or vehicle injection (light orange). n = 7–12 mice per group. h, T cells in the mediastinal lymph nodes in mice as described above and indicated, except for T-cell-specific GR-KO mice. n = 7–13 mice per group. i,j, IAV-specific IgG1 in the BAL (i) and pulmonary viral loads (j) of mice as described above and as indicated. n = 7–13 mice per group. k, Haematoxylin and eosin-stained lung cross-sections of mice under the indicated conditions. Scale bars, 1 mm (low magnification) and 41 μm (high magnification). For b, c and gj, data are mean ± s.e.m. Statistical analysis was performed using two-tailed unpaired t-tests (b, c and gi), log-rank (Mantel–Cox) tests (d) and two-tailed unpaired t-tests and Mann–Whitney U-tests (j); P < 0.05, ★★P < 0.01, ★★★P < 0.001.

Similar articles

Cited by

References

    1. Schiller M, Ben-Shaanan TL & Rolls A Neuronal regulation of immunity: why, how and where. Nat. Rev. Immunol 21, 20–36 (2021). - PubMed
    1. Dhabhar FS, Malarkey WB, Neri E & McEwen BS Stress-induced redistribution of immune cells–from barracks to boulevards to battle ields: a tale of three hormones–Curt Richter Award winner. Psychoneuroendocrinology 37, 1345–1368 (2012). - PMC - PubMed
    1. Poller WC, Nahrendorf M & Swirski FK Hematopoiesis and cardiovascular disease. Circ. Res 126, 1061–1085 (2020). - PMC - PubMed
    1. Chervenick PA, Boggs DR, Marsh JC, Cartwright GE & Wintrobe MM Quantitative studies of blood and bone marrow neutrophils in normal mice. Am. J. Physiol 215, 353–360 (1968). - PubMed
    1. Colvin GA et al. Murine marrow cellularity and the concept of stem cell competition: geographic and quantitative determinants in stem cell biology. Leukemia 18, 575–583 (2004). - PubMed

MeSH terms