. 2022 Jul 12;55(7):1200-1215.e6.
doi: 10.1016/j.immuni.2022.05.003. Epub 2022 May 27.

BCL6-dependent TCF-1+ progenitor cells maintain effector and helper CD4+ T cell responses to persistent antigen

Affiliations

BCL6-dependent TCF-1+ progenitor cells maintain effector and helper CD4+ T cell responses to persistent antigen

Yu Xia et al. Immunity. .

Abstract

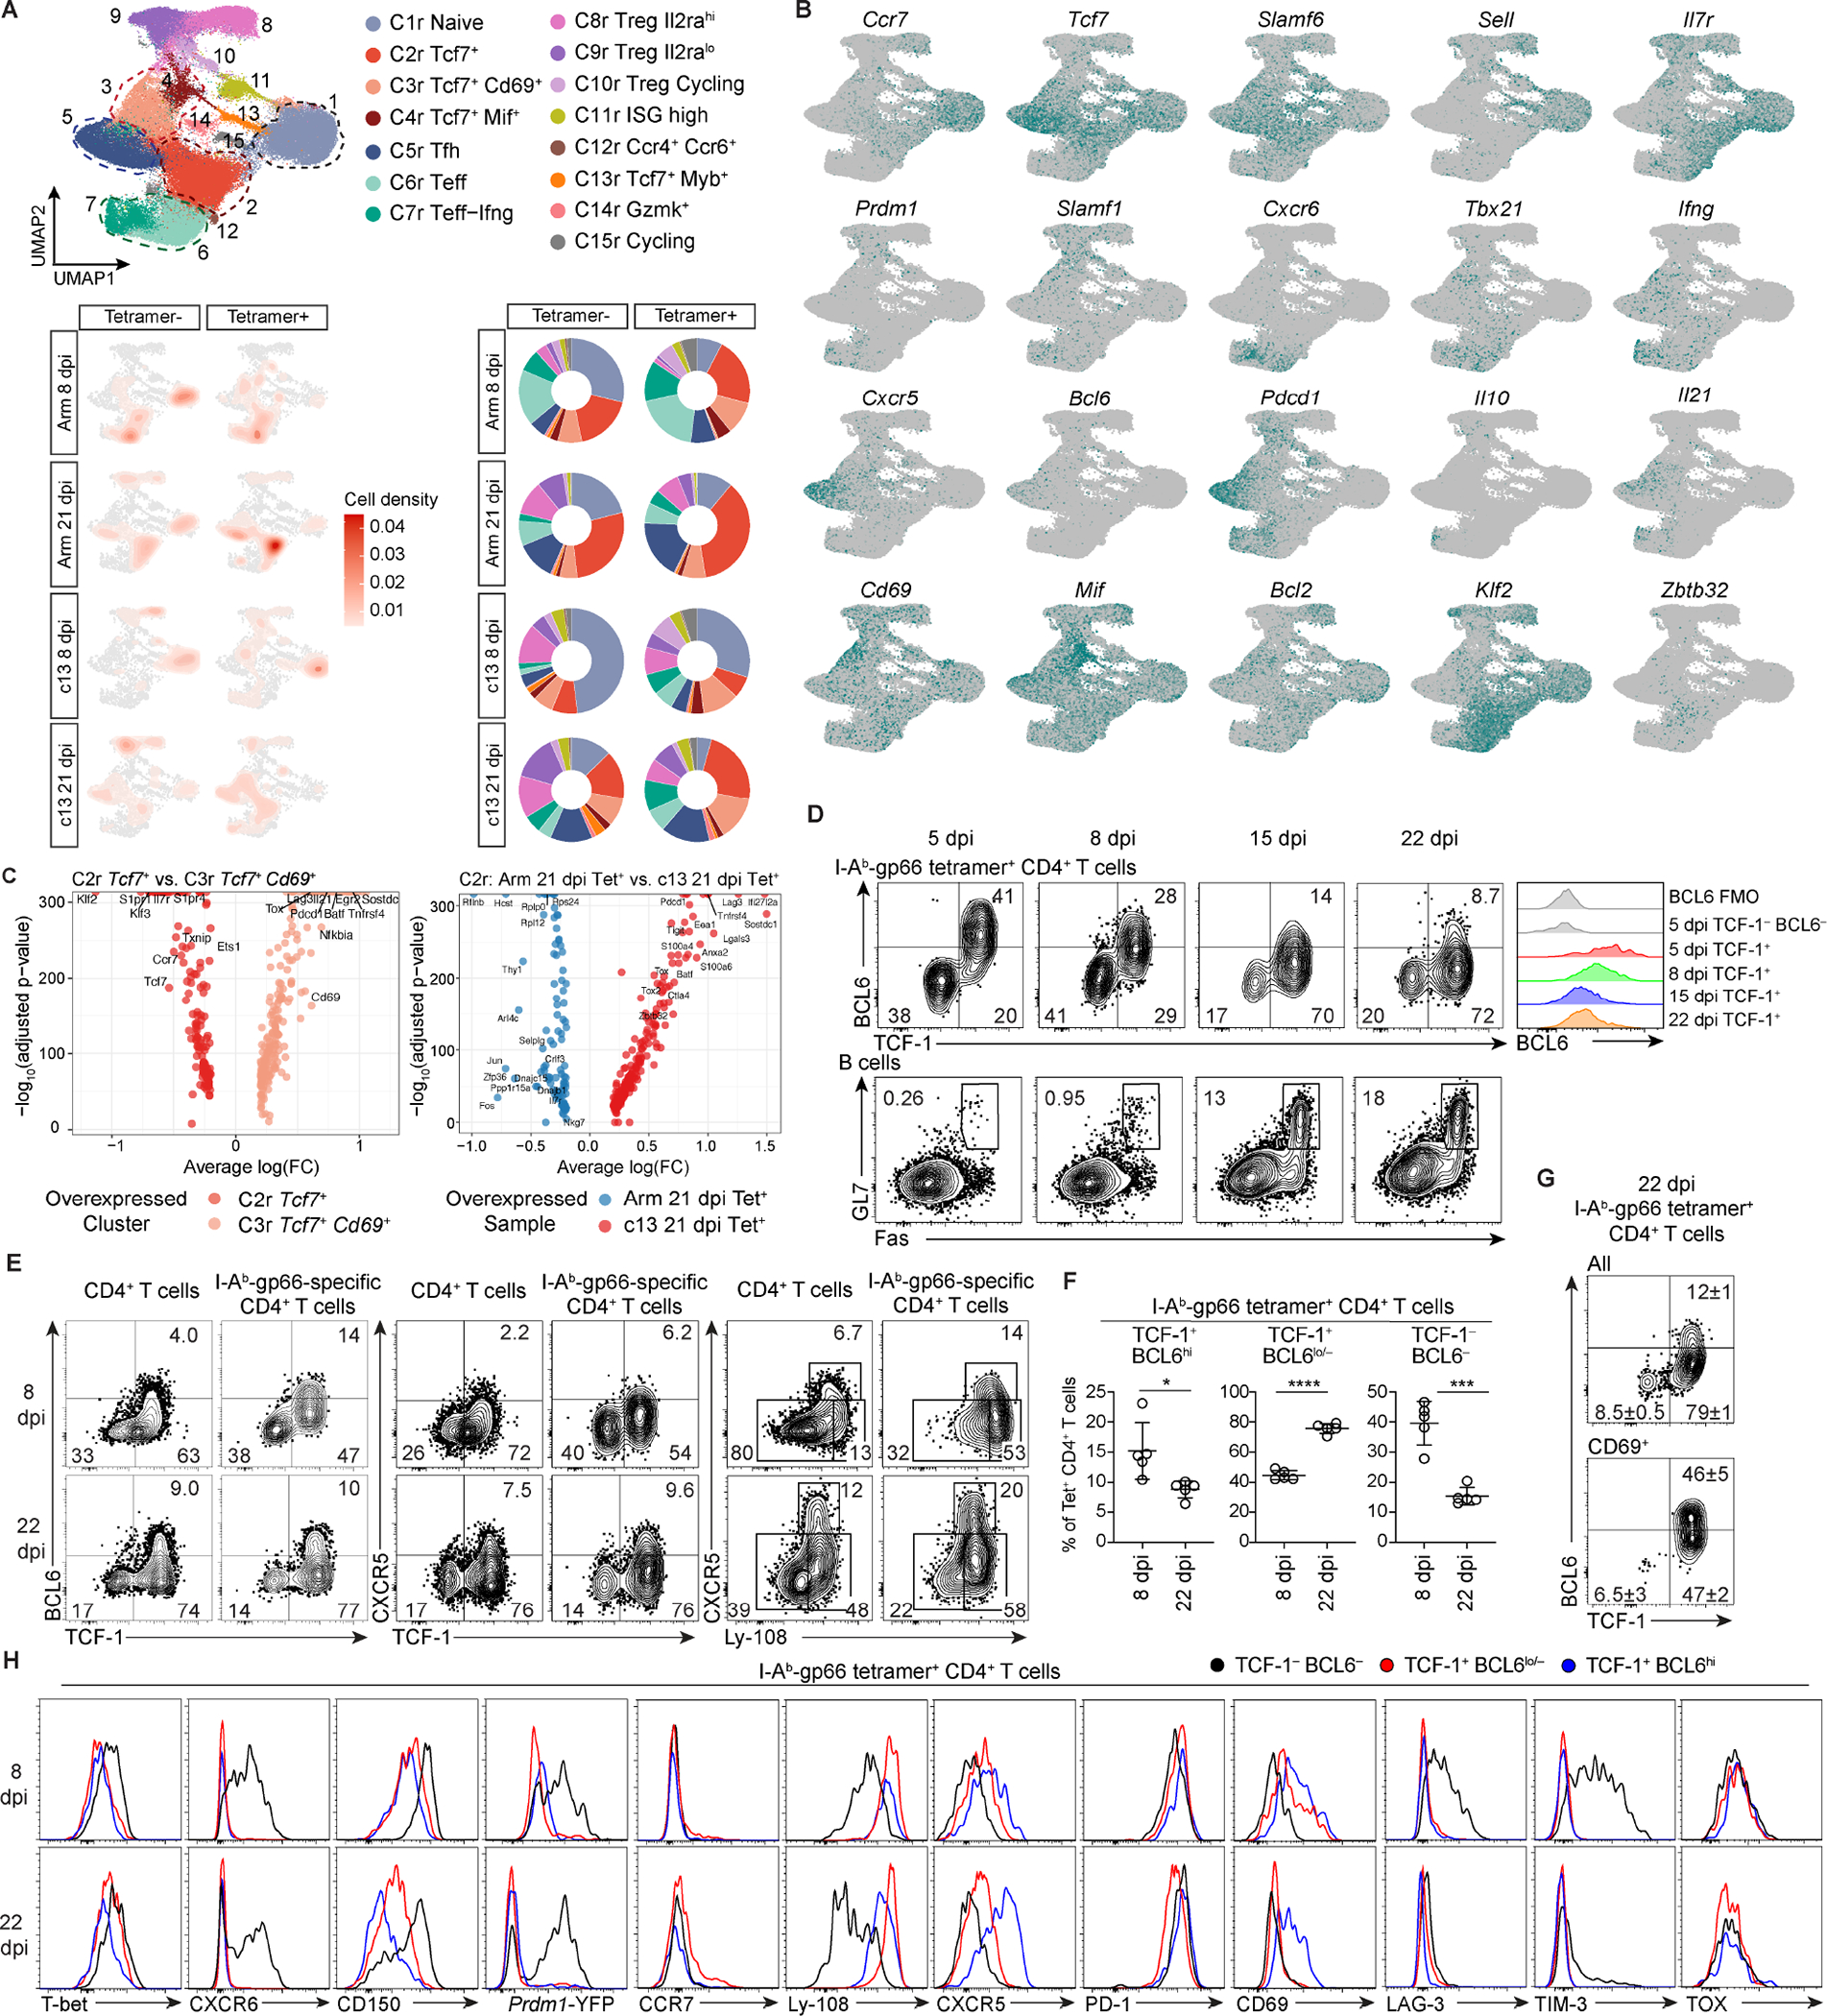
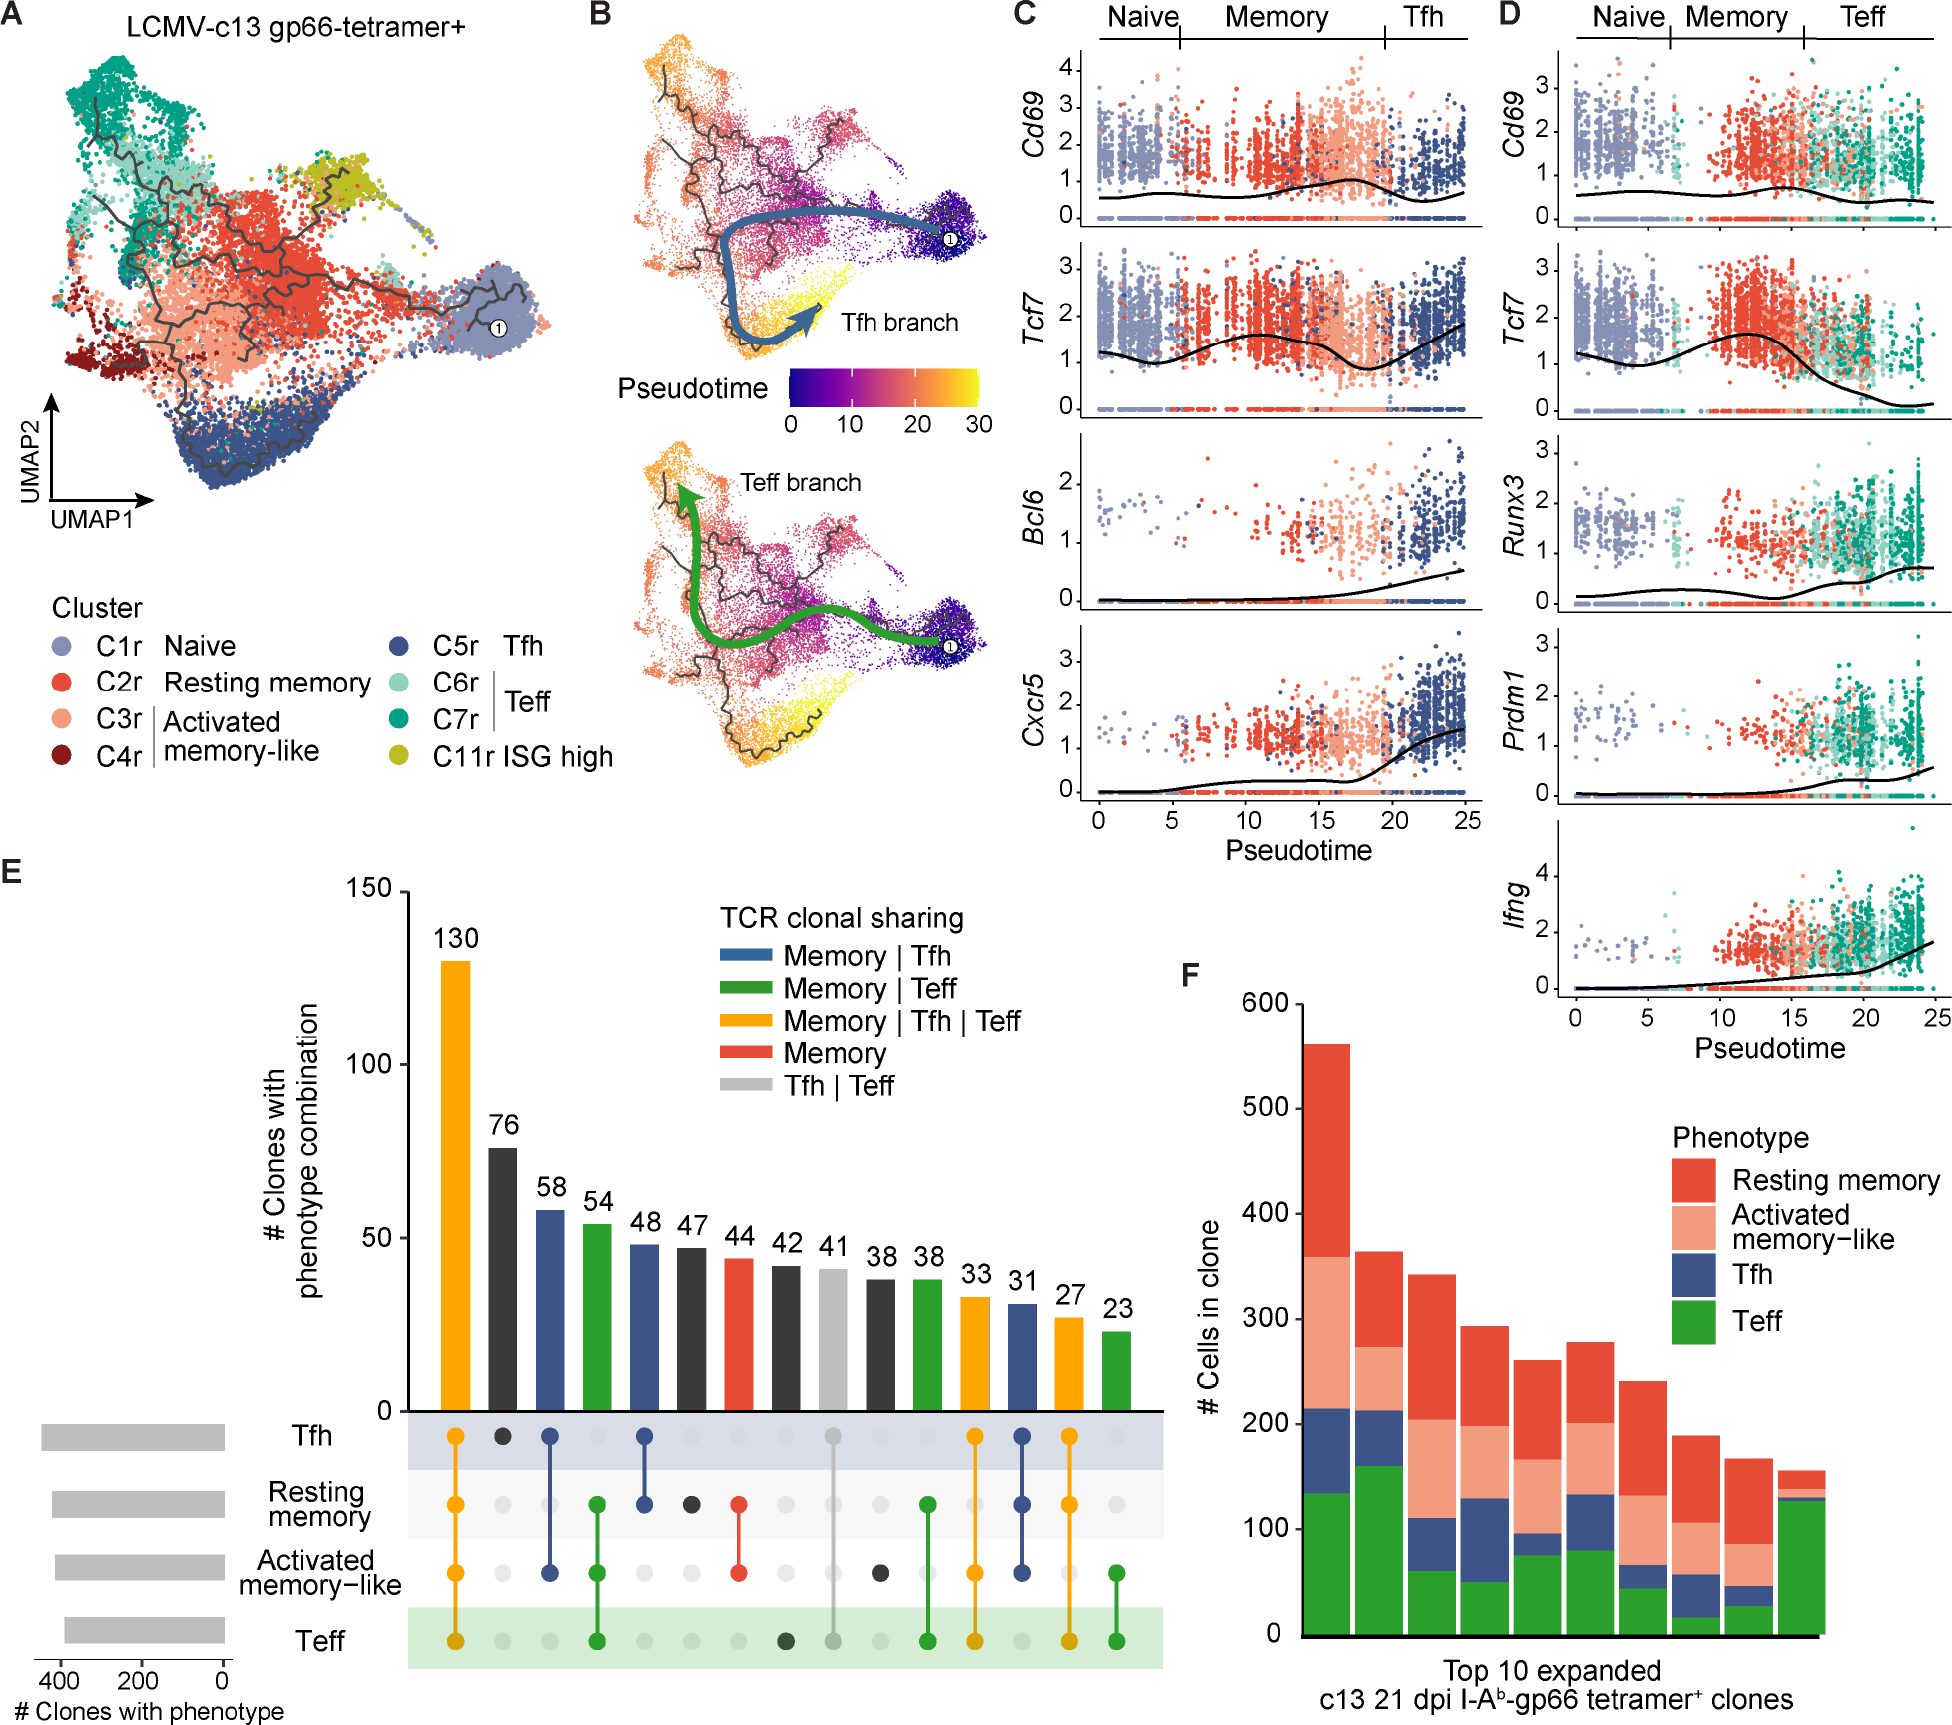
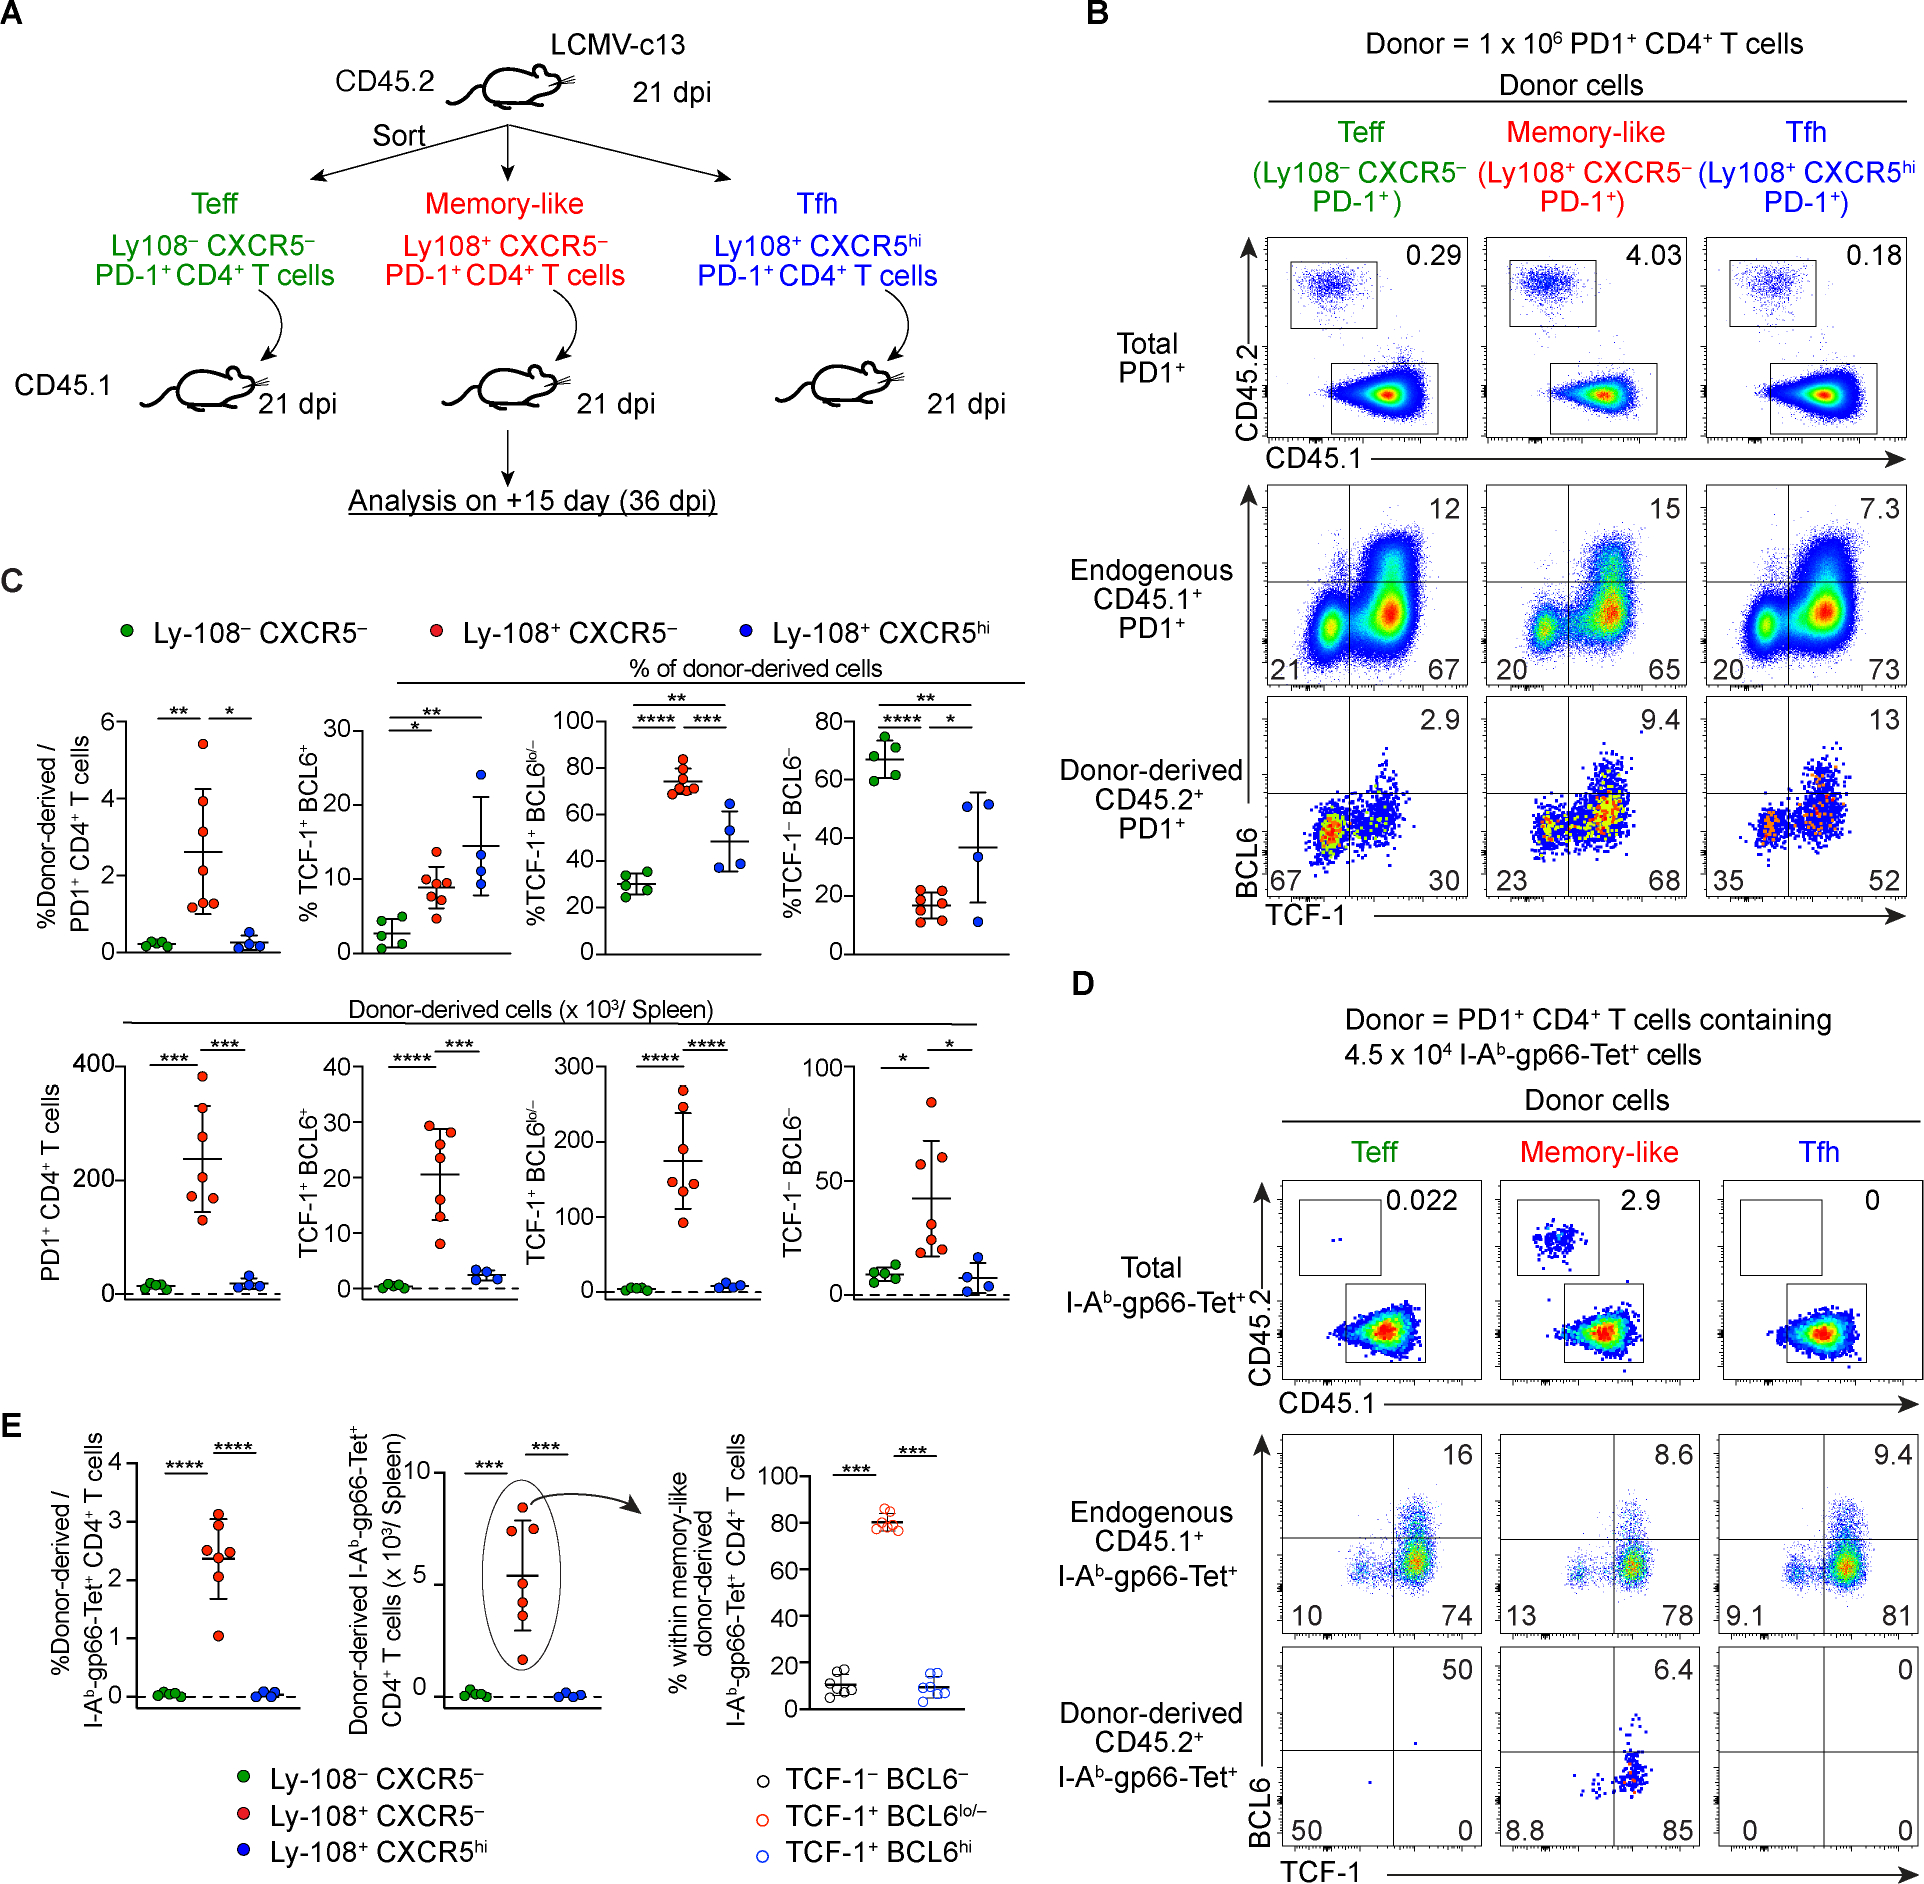
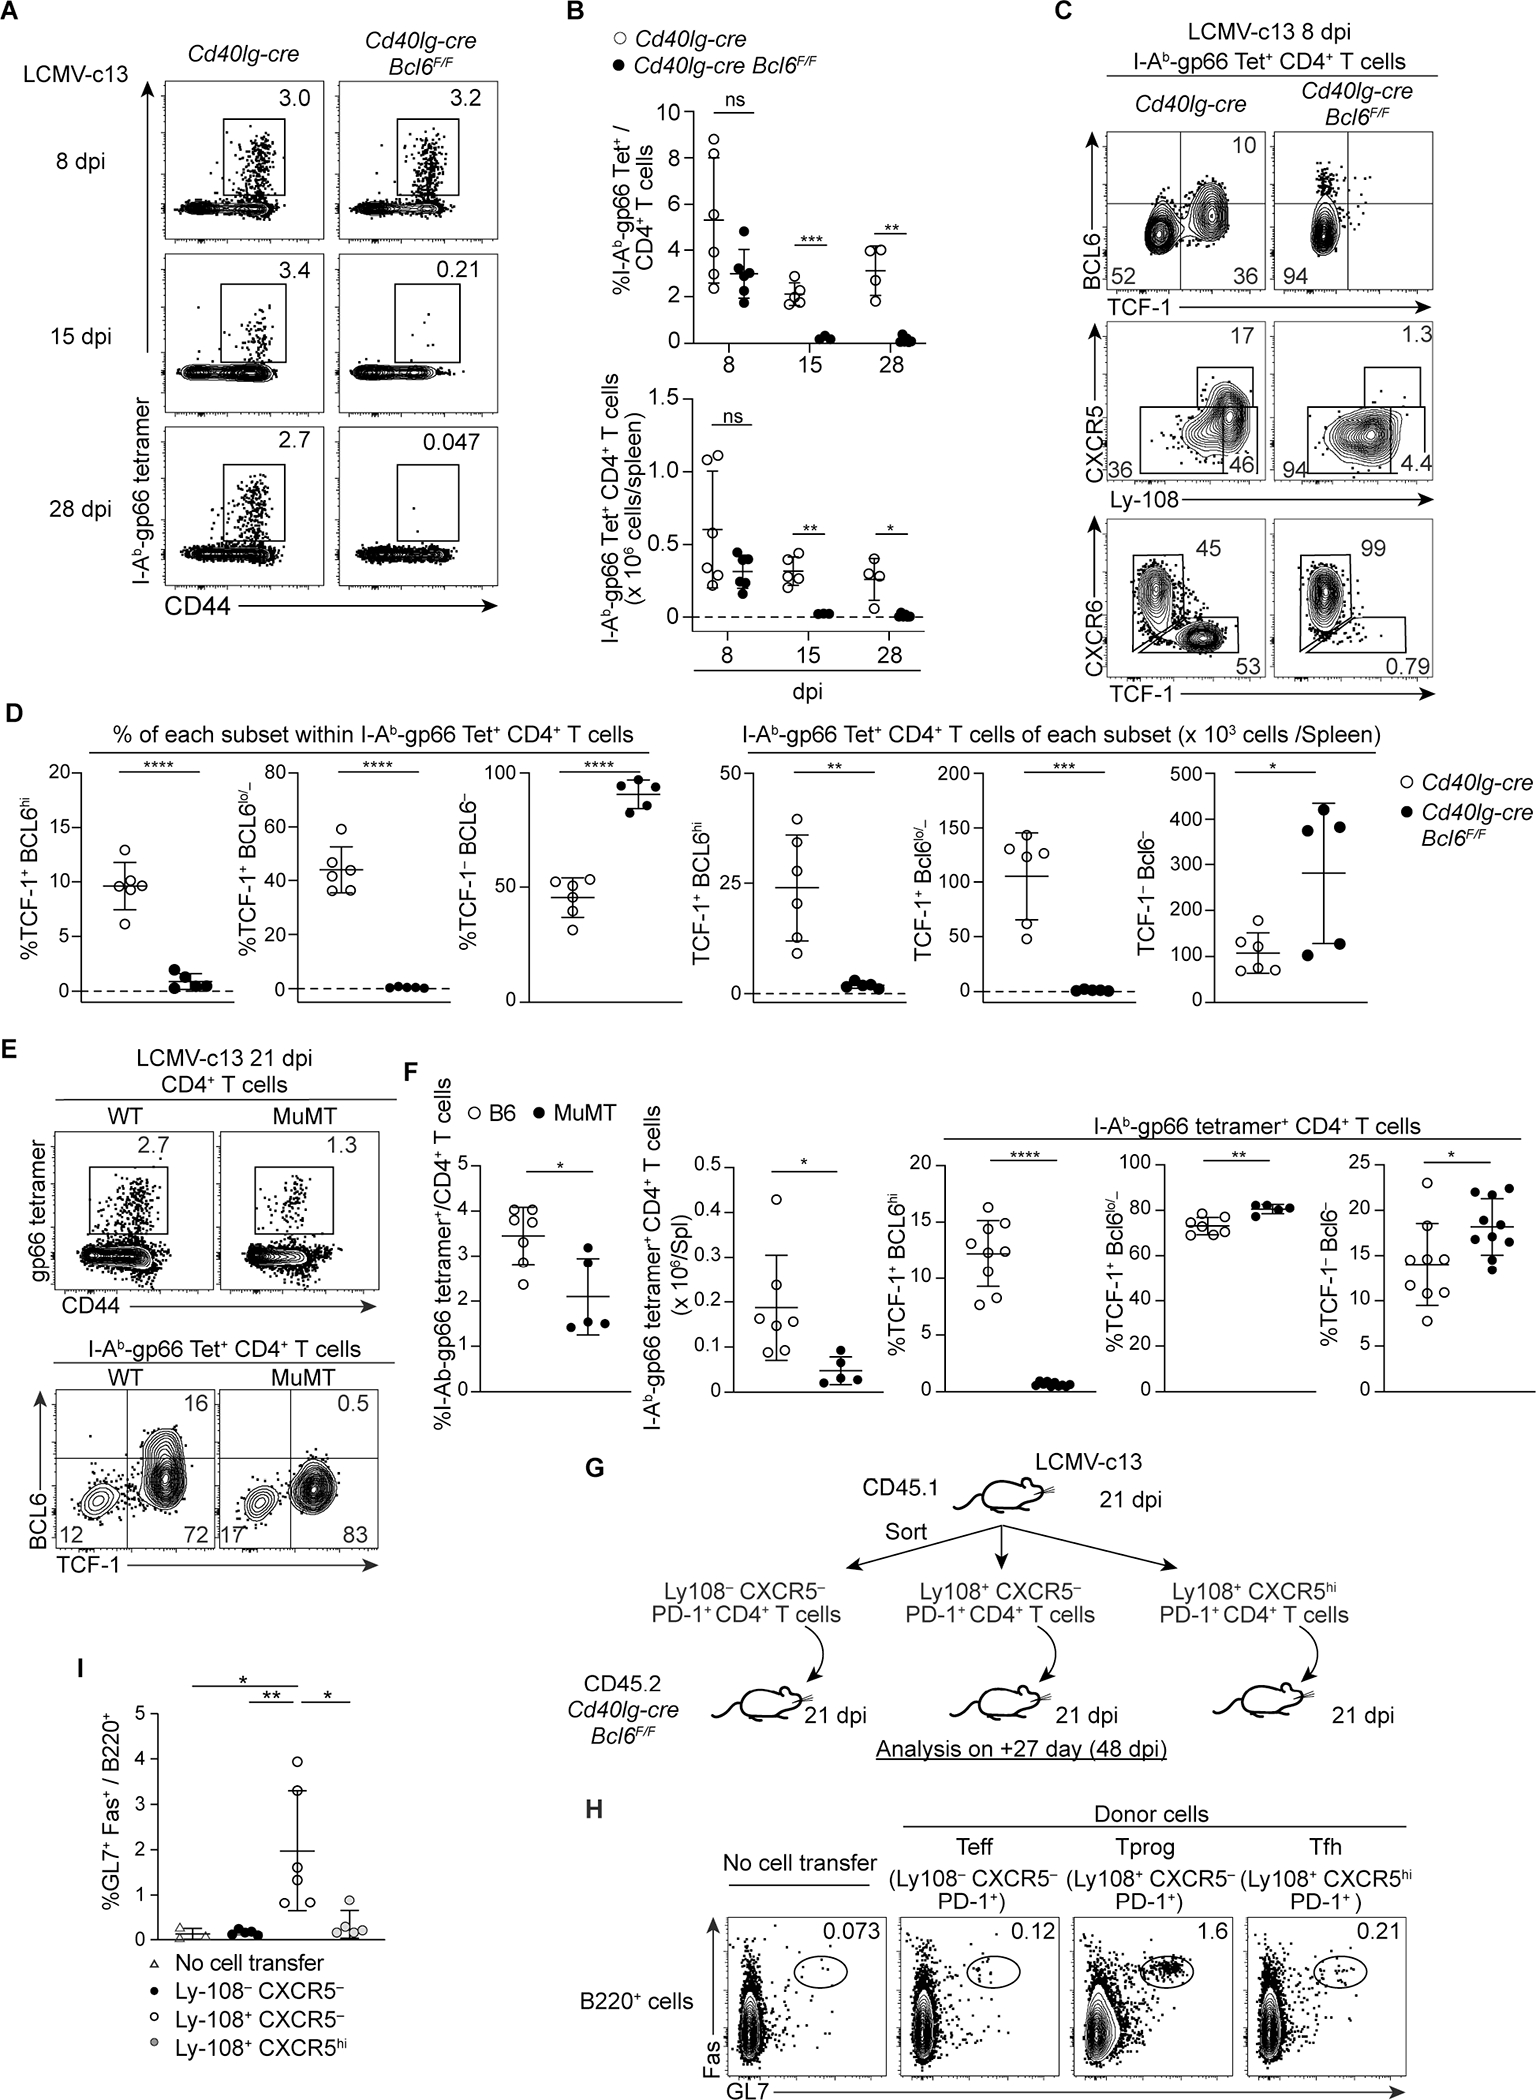
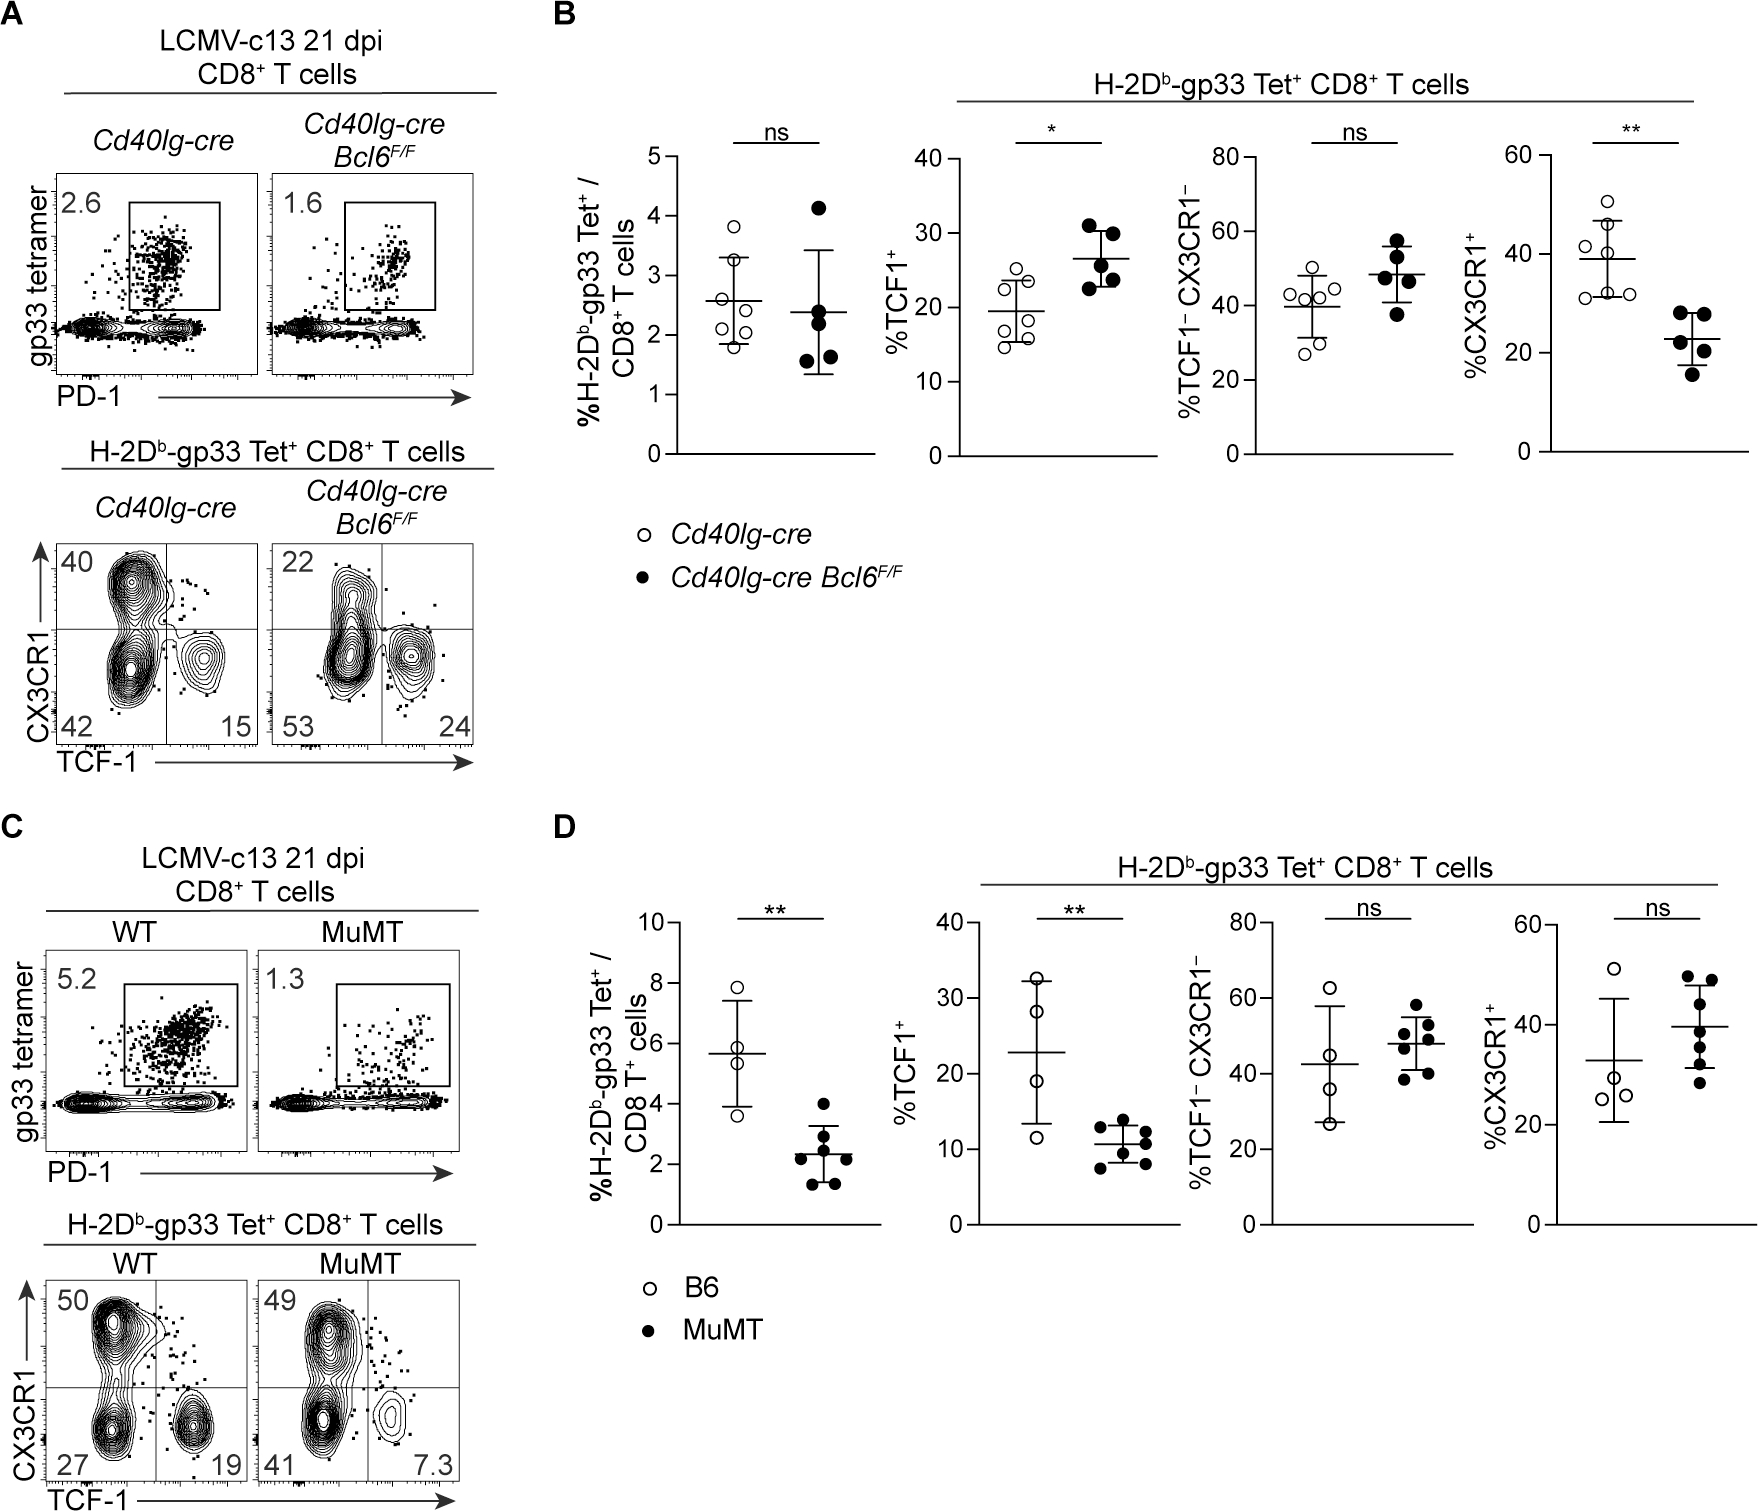
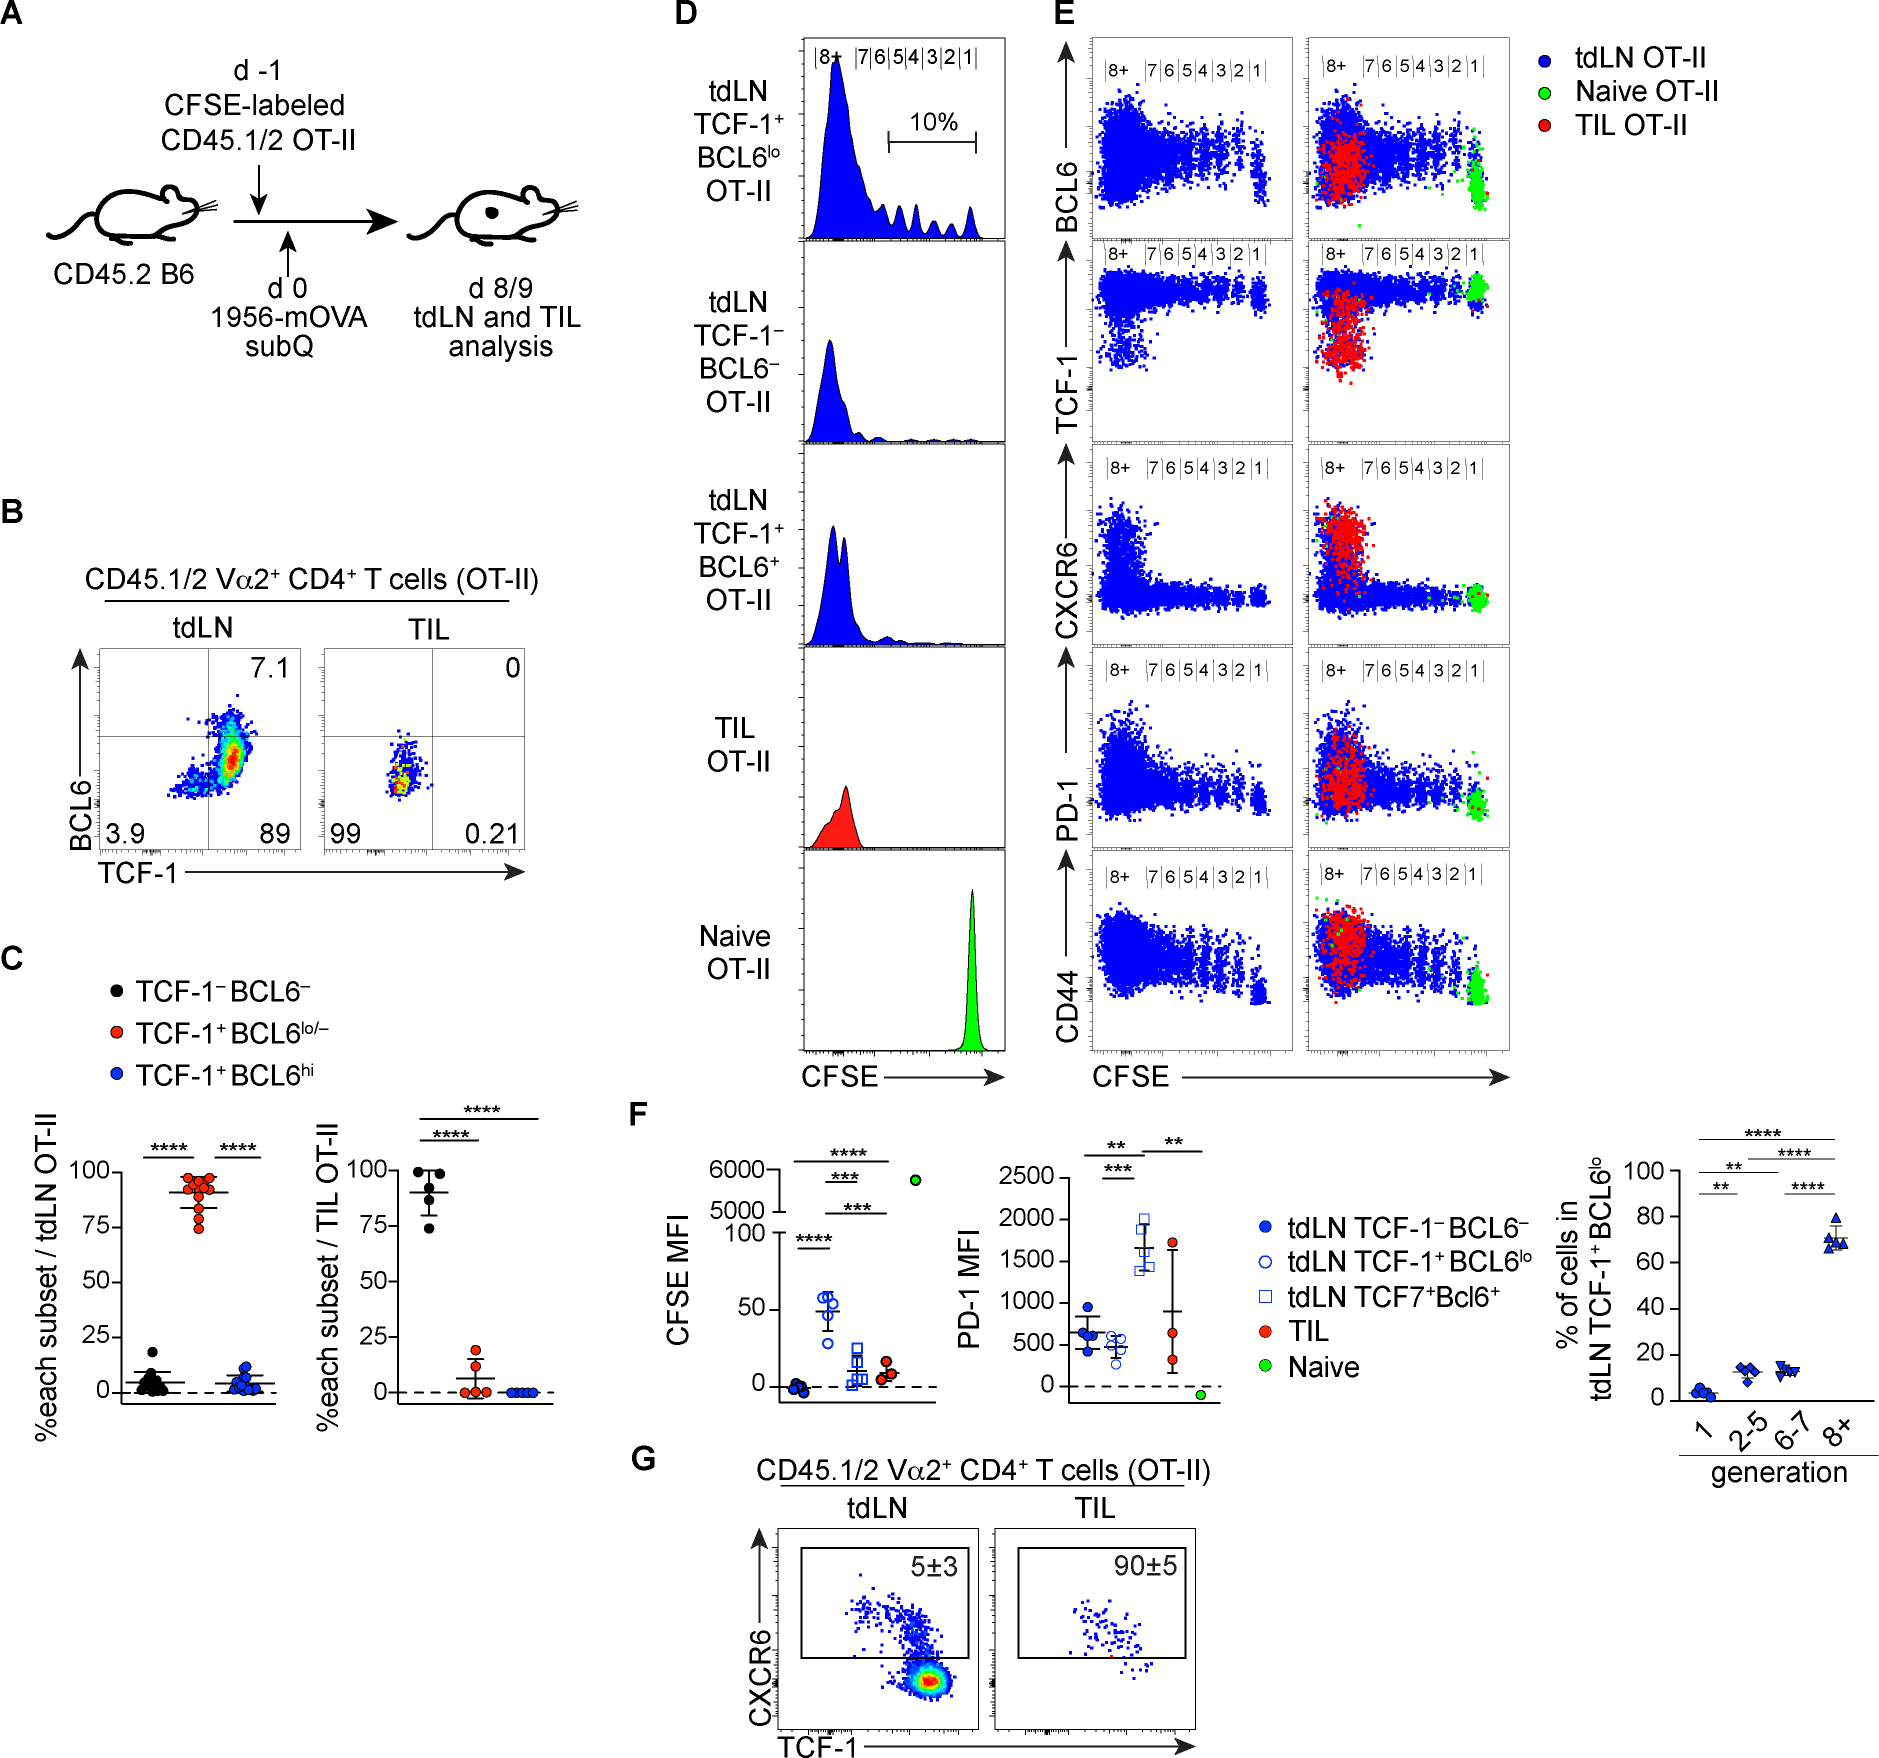
Soon after activation, CD4+ T cells are segregated into BCL6+ follicular helper (Tfh) and BCL6- effector (Teff) T cells. Here, we explored how these subsets are maintained during chronic antigen stimulation using the mouse chronic LCMV infection model. Using single cell-transcriptomic and epigenomic analyses, we identified a population of PD-1+ TCF-1+ CD4+ T cells with memory-like features. TCR clonal tracing and adoptive transfer experiments demonstrated that these cells have self-renewal capacity and continue to give rise to both Teff and Tfh cells, thus functioning as progenitor cells. Conditional deletion experiments showed Bcl6-dependent development of these progenitors, which were essential for sustaining antigen-specific CD4+ T cell responses to chronic infection. An analogous CD4+ T cell population developed in draining lymph nodes in response to tumors. Our study reveals the heterogeneity and plasticity of CD4+ T cells during persistent antigen exposure and highlights their population dynamics through a stable, bipotent intermediate state.

Keywords: CD4(+) T cells; anti-tumor immunity; chronic viral infection; effector T cells; follicular helper T cells; progenitor cells; single-cell genomics.


Conflict of interest statement

Declaration of interests A.T.S. is a scientific co-founder of Immunai, founder of Cartography Biosciences, and receives research funding from Arsenal Biosciences, Merck Research Laboratories, and Allogene Therapeutics.

Figures

Figure 1.
Figure 1.. scRNA-seq and flow analysis reveals heterogeneity within antigen-specific CD4+ T cells in chronic LCMV infections. (See also Figures S1, S2, Table S1 and S2)
(A) UMAP of gp66 Tet+ and Tet splenic CD4+ T cells in mice infected with LCMV-Arm or LCMV-c13 on 8 and 21 dpi. Cells were clustered by scRNA-seq gene expression profiles and colored by phenotypic clustering (top). Density UMAP of CD4+ T cells from each condition and tetramer-sorted population (bottom left). Proportion of cells from each condition in each phenotypic cluster (bottom right). (B) Expression of cluster-defining markers. (C) Differential gene expression of cells in the resting memory cluster C2r compared to the activated memory-like cluster C3r (left). Differential gene expression of gp66-Tet+ resting memory C2r cells from 21 dpi-LCMV-Arm compared to 21 dpi-LCMV-c13 samples (right). (D-F) Expression of TCF-1, BCL6, CXCR5, and Ly-108 by gp66-specific splenic CD4+ T cells and expression of Fas and GL7 in splenic B cells in LCMV-c13-infected B6 mice at indicated time points. Representative flow plots (D) and pooled data for the frequencies of each PD-1+ CD4+ T cell population from 2 experiments (n = 2–3 / experiment) shown as mean±SD in (F). Unpaired t-test. (G) Expression of indicated proteins or a Prdm1-YFP reporter in gp66-specific splenic CD4+ T cell subpopulations in LCMV-c13 infected B6 mice. Data are representative of 2 experiments with n = 2–3 / experiment.
Figure 2.
Figure 2.. Memory-like cells are enriched for common progenitors for both Tfh and Teff cells. (See also Figure S3, Tables S1 and S2)
(A) UMAP trajectory graph of gp66-Tet+ CD4+ T cells from LCMV-c13 infected B6 mice on 8 and 21 dpi colored by phenotypic clusters as in Fig. 1A. The Treg clusters and other infrequent populations were excluded from the trajectory analysis for clarity. (B) UMAP trajectory of gp66-Tet+ CD4+ T cells from LCMV-c13 infected B6 mice on 8 and 21 dpi along the Tfh branch (top) or Teff branch (bottom). Cells are colored by pseudotime. (C) Gene expression dynamics of activation and Tfh lineage markers along the Tfh pseudotime trajectory. (D) Gene expression dynamics of activation and Teff markers along the Teff pseudotime trajectory. (E) Phenotypic overlap of expanded (>1 cell) T cell clones among the resting memory, activated memory-like, Tfh, and Teff clusters. Bars are colored by the category of clonal phenotypic overlap. (F) Phenotypic composition of the top 10 most highly expanded gp66-Tet+ clones from LCMV-c13-infected B6 mice on 21 dpi.
Figure 3.
Figure 3.. Chromatin accessibility analysis reveals heterogeneity and delineates the main CD4+ T cell differentiation pathways during chronic viral infection. (See also Figure S4 and Table S3)
(A) UMAP of scATAC-seq data of PD1+ CD4+ T cells on 21 dpi of LCMV-cl13 infection. (B) UMAP of gene score (accessibility) and gene integration matrix (expression) for Cxcr5, Tcf7, Slamf6 and Tbx21. (C) Heatmap visualization of marker gene accessibility scores across clusters represented by gene score values. (D) Heatmap of marker peak scores of 5,227 cis-regulatory elements in scATAC-seq clusters (left). Heatmap of enriched motifs in marker peaks of the specific clusters (right). (E) UMAP projection of Tfh and Teff differentiation trajectory, respectively. Cells that are not part of the trajectory are colored grey (top). Pseudotime heatmaps of motif deviation scores on the two differentiation trajectories (bottom). (F) Volcano plot visualization of the differential peak analysis between the indicated clusters (FDR <= 0.1 and a Log2FC >= 0.5) (G) Hockey plot representation of the enriched motifs under the cluster specific peak sets. (H) Pseudotime analysis of the gene scores (accessibility) and gene integration scores (integrated expression values) of the indicated genes.
Figure 4.
Figure 4.. TCF-1+ BCL6lo/− PD-1+ CD4+ T cells are capable of superior expansion and differentiation into both Teff and Tfh cells following adoptive transfer. (See also Figure S5)
(A) Experimental design of adoptive transfer of distinct PD-1+ CD4+ T cell populations from LCMV-c13 infected mice to infection-matched recipient mice for the experiments shown in (B-E). For the experiments shown in (B) and (C), 1 × 10⁶ PD-1+ CD4+ T cells were transferred. For the experiments shown in (D) and (E), 1–2 × 10⁶ PD-1+ CD4+ T cells containing 4.5 × 10⁴ Tet+ cells were transferred. (B-E) Representative flow cytometry plots showing frequencies of total donor-derived cells (B) and Tet+ donor-derived cells (D) and their expression of TCF-1 and BCL6 15 days after transfer. Pooled data from 2 experiments with n = 2–4 / group / experiment are shown in (C, E) with mean±SD and statistical analysis by One-way ANOVA. Frequencies and total numbers of donor-derived cells in (B, C) were normalized to 1 × 10⁶ transferred donor cells, and frequencies and total numbers of Tet+ donor-derived cells in (D, E) were normalized to 4.5 × 10⁴ Tet+ transferred donor cells.
Figure 5.
Figure 5.. The maintenance of TCF-1 Teff cells requires BCL6-dependent, B cell-independent, TCF-1+ BCL6lo/− PD-1+ memory-like CD4+ T cells. (See also Figures S6 and S7)
(A-B) Representative plots showing expression of CD44 and gp66-specific TCR in splenic CD4+ T cells in Cd40lg-cre Bcl6F/F and control Cd40lg-cre mice infected with LCMV-c13, analyzed on 8 dpi, 15 dpi or 28 dpi. Pooled data from 2 experiments with 2–3 mice/group/time point are shown with mean±SD. Unpaired t-test. (C-D) Expression of TCF-1, BCL6, Ly-108, CXCR5 and CXCR6 in gp66-specific splenic CD4+ T cells from LCMV-c13-infected Cd40lg-cre Bcl6F/F and control Cd40lg-cre mice on 8 dpi. Data pooled from two experiments with n = 2–4 / genotype shown with mean±SD. (E-F) Expression of TCF-1, BCL6 and CXCR6 in gp66-specific splenic CD4+ T cells from LCMV-c13-infected MuMT and age-matched B6 (WT) mice on 21 dpi. Data from two experiments with n = 2–5 / genotype / experiment shown with mean±SD. (G-I) Adoptive transfer of distinct PD-1+ CD4+ T cell populations from LCMV-c13 infected B6-CD45.1 mice to infection-matched Cd40lg-cre Bcl6F/F recipients (CD45.2). Experimental design (G): adoptive transfer of 0.7–1 × 10⁶ cells of donor PD-1+ CD4+ T cells to infection-matched Cd40lg-cre Bcl6F/F recipients. 27 days after transfer, frequencies of splenic GL7+ Fas+ B cells in recipient mice were analyzed. Representative plots (H) and pooled data from 2 experiments (n = 2–4 / group / experiment) shown in (I) with mean±SD with statistical analysis by One-way ANOVA.
Figure 6.
Figure 6.. IL-21-dependent CX3CR1+ exhausted CD8+ T cells in LCMV-c13-infected mice are maintained in the absence of Bcl6 in CD4+ T cells. (See also Figure S6)
(A, B) Expression of PD-1, TCF-1 and CX3CR1 in splenic LCMV-gp33-specific CD8+ T cells from LCMV-c13-infected MuMT mice on 21 dpi. Representative plots (A) and pooled data from 2 experiments with n = 2–3 / genotype /experiment shown with mean±SD. Unpaired t-test. (C, D) Expression of PD-1, TCF-1 and CX3CR1 in splenic LCMV-gp33-specific CD8+ T cells from LCMV-c13-infected Cd40lg-cre Bcl6F/F mice on 21 dpi. Representative plots (C) and pooled data from 2 experiments with n = 2–3 / genotype /experiment shown with mean±SD. Unpaired t-test.
Figure 7.
Figure 7.. Antigen-specific CD4+ T cells differentiate into TCF-1+ PD-1+ cells following cell division in tumor-draining lymph nodes, but not in the tumor microenvironments.
(A) Experiment design to analyze CD4+ T cell response to tumor antigen. (B-C) Representative plots showing expression of TCF-1 and BCL6 by donor-derived OT-II CD4+ T cells harvested from tumor (TIL) and the tumor draining lymph node (tdLN). Data pooled from two experiments (n = 6 – 8 / experiment) and shown with mean±SD. (D-F) CFSE dilution and expression of BCL6, TCF-1, CXCR6, PD-1 and CD44 by donor-derived OT-II cells. The CFSE level of naive OT-II cells was determined by recipient mice without tumor transplantation sacrificed at the same time points. Left panels in (E) show tdLN-derived OT-II cells without overlay of TIL or naive cells. Pooled data are shown with mean±SD in (F) with assessment of statistical differences by one-way ANOVA. (G) Representative plots showing expression of CXCR6, TCF-1 and BCL6 by donor-derived OT-II CD4+ T cells harvested from tdLN and the tumor. Numbers show mean±SD.

Comment in

References

    1. Baumjohann D, Okada T, and Ansel KM (2011). Cutting Edge: Distinct waves of BCL6 expression during T follicular helper cell development. J. Immunol. 187, 2089–2092. - PubMed
    1. Cao J, Spielmann M, Qiu X, Huang X, Ibrahim DM, Hill AJ, Zhang F, Mundlos S, Christiansen L, Steemers FJ, et al. (2019). The single-cell transcriptional landscape of mammalian organogenesis. Nature 566, 496–502. - PMC - PubMed
    1. Choi S, Kim H-R, Leng L, Kang I, Jorgensen WL, Cho C-S, Bucala R, and Kim W-U (2012). Role of macrophage migration inhibitory factor in the regulatory T cell response of tumor-bearing mice. J. Immunol. 189, 3905–3913. - PMC - PubMed
    1. Choi YS, Kageyama R, Eto D, Escobar TC, Johnston RJ, Monticelli L, Lao C, and Crotty S (2011). ICOS receptor instructs T follicular helper cell versus effector cell differentiation via induction of the transcriptional repressor Bcl6. Immunity 34, 932–946. - PMC - PubMed
    1. Choi YS, Yang JA, Yusuf I, Johnston RJ, Greenbaum J, Peters B, and Crotty S (2013). Bcl6 expressing follicular helper CD4 T cells are fate committed early and have the capacity to form memory. J. Immunol. 190, 4014–4026. - PMC - PubMed

Publication types

LinkOut - more resources