. 2022 May 30;13(1):2996.
doi: 10.1038/s41467-022-30709-6.

A lncRNA signature associated with tumor immune heterogeneity predicts distant metastasis in locoregionally advanced nasopharyngeal carcinoma

Affiliations

A lncRNA signature associated with tumor immune heterogeneity predicts distant metastasis in locoregionally advanced nasopharyngeal carcinoma

Ye-Lin Liang et al. Nat Commun. .

Abstract

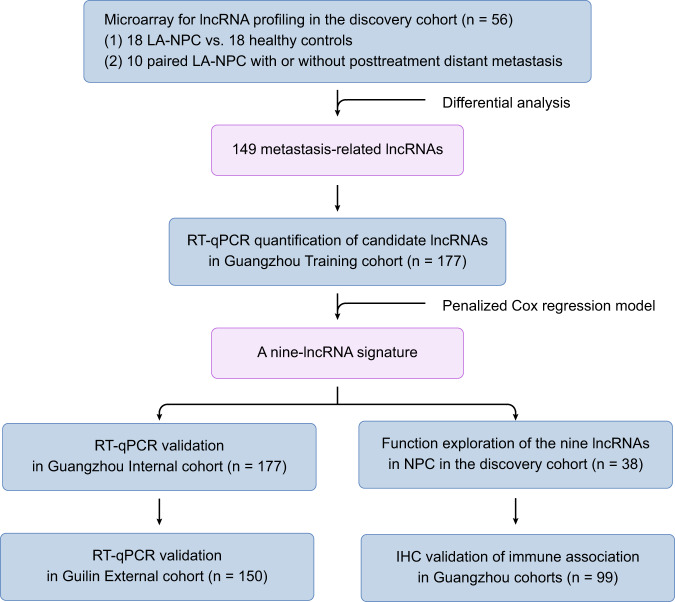
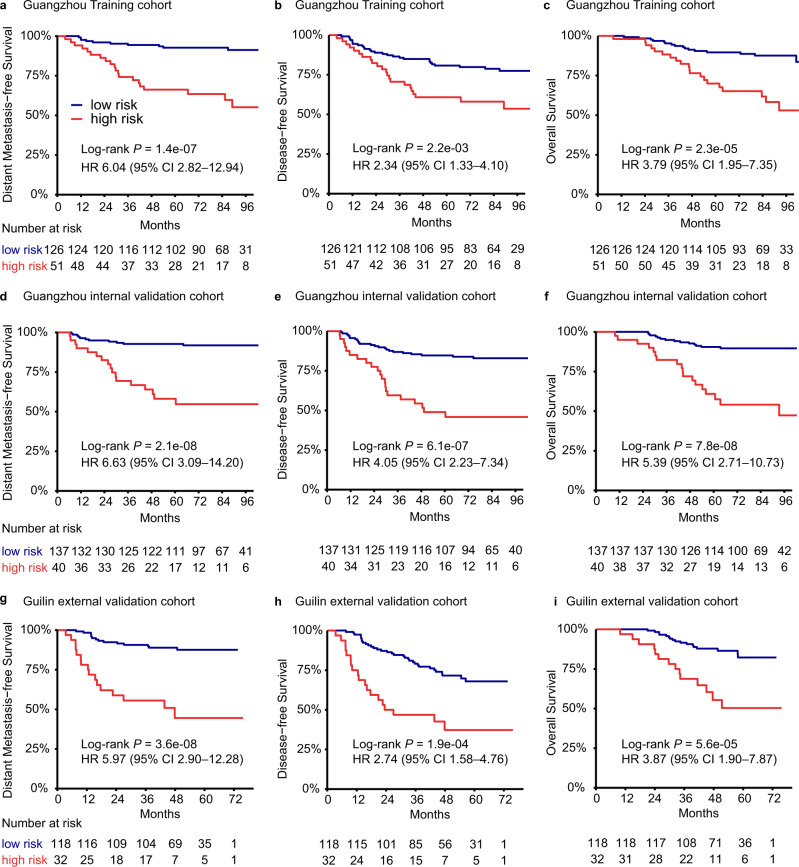
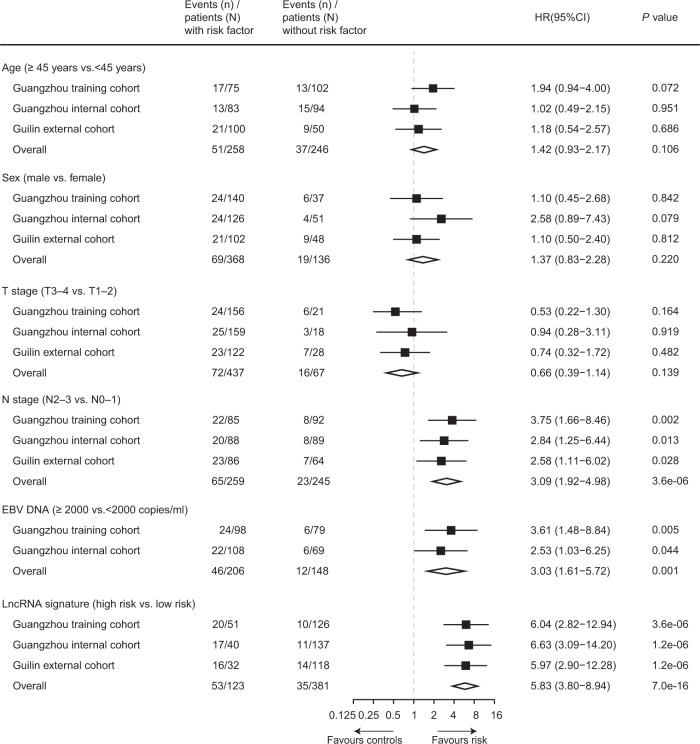
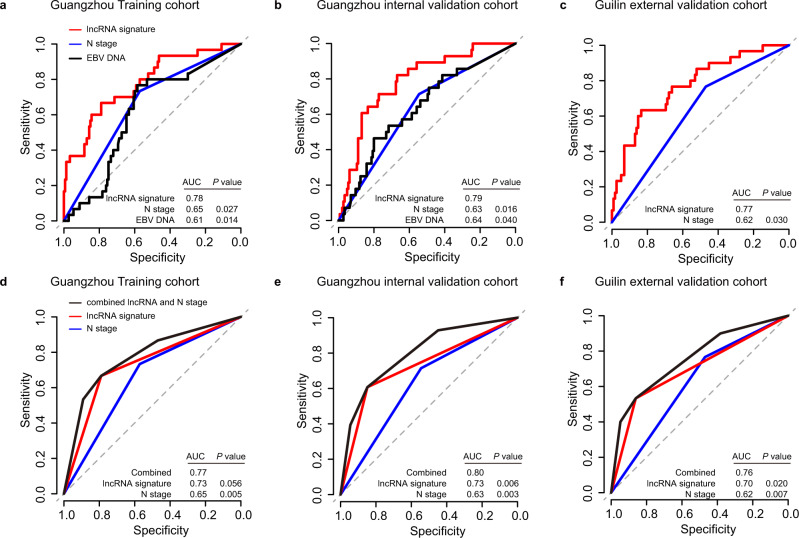
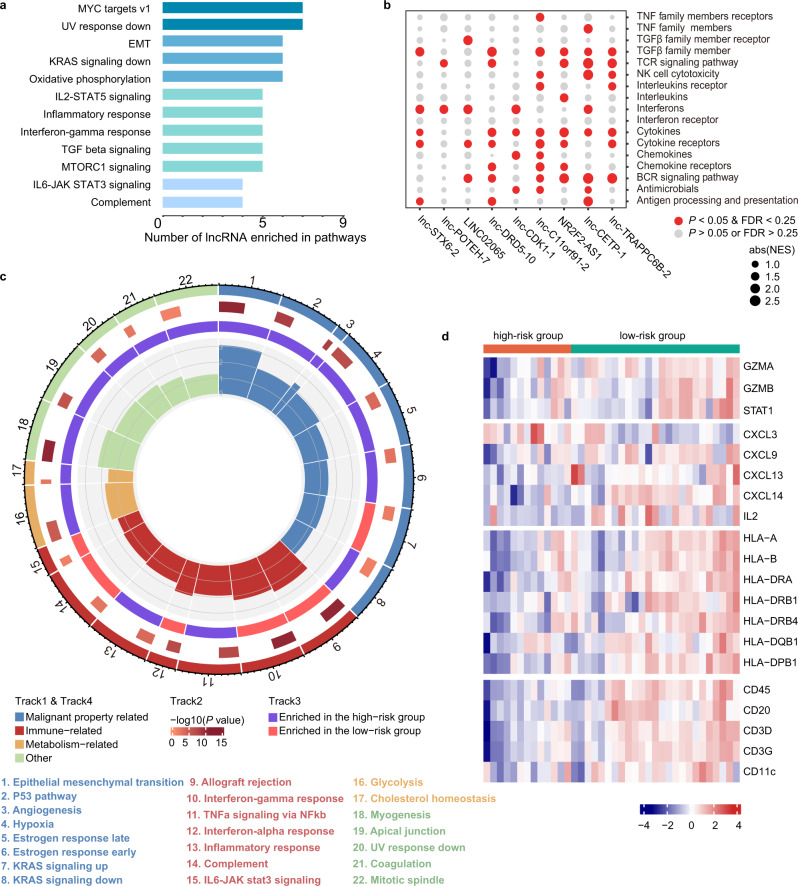
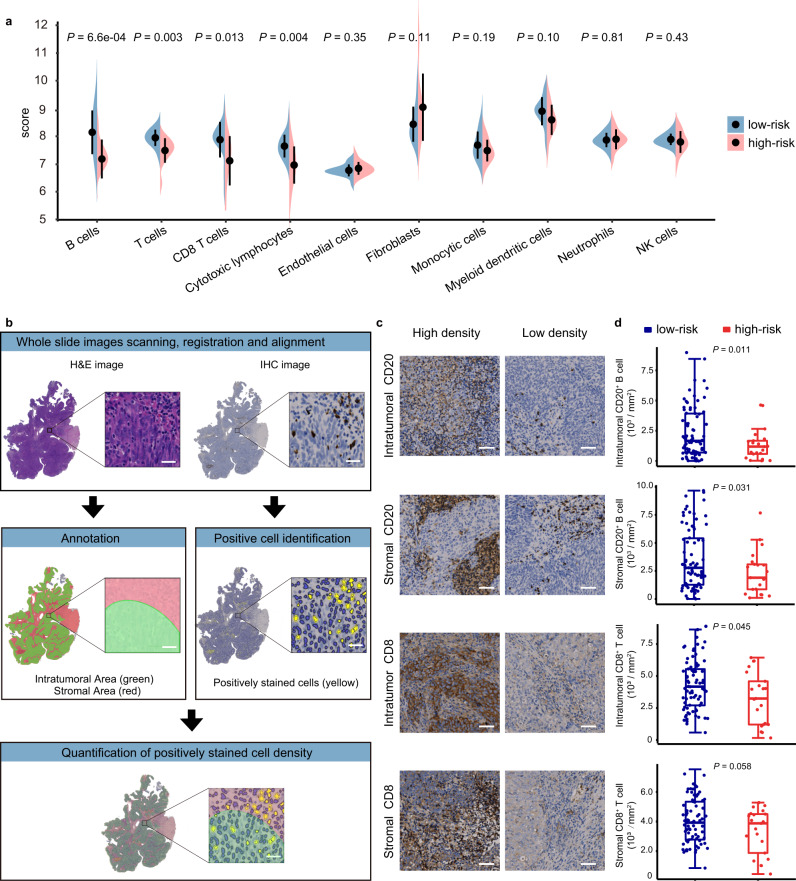
Increasing evidence has revealed the roles of long noncoding RNAs (lncRNAs) as tumor biomarkers. Here, we introduce an immune-associated nine-lncRNA signature for predicting distant metastasis in locoregionally advanced nasopharyngeal carcinoma (LA-NPC). The nine lncRNAs are identified through microarray profiling, followed by RT-qPCR validation and selection using a machine learning method in the training cohort (n = 177). This nine-lncRNA signature classifies patients into high and low risk groups, which have significantly different distant metastasis-free survival. Validations in the Guangzhou internal (n = 177) and Guilin external (n = 150) cohorts yield similar results, confirming that the signature is an independent risk factor for distant metastasis and outperforms anatomy-based metrics in identifying patients with high metastatic risk. Integrative analyses show that this nine-lncRNA signature correlates with immune activity and lymphocyte infiltration, which is validated by digital pathology. Our results suggest that the immune-associated nine-lncRNA signature can serve as a promising biomarker for metastasis prediction in LA-NPC.


Conflict of interest statement

The authors declare no competing interests.

Figures

Fig. 1
Fig. 1. Study design.
This figure shows the workflow of the study. LA-NPC locoregionally advanced nasopharyngeal carcinoma, RT–qPCR quantitative reverse transcription PCR.
Fig. 2
Fig. 2. Kaplan–Meier estimates survival curves for the high-risk and low-risk groups according to the nine-lncRNA signature.
ac Distant metastasis-free survival (a), disease-free survival (b), and overall survival (c) in the training cohort (n = 177). df Distant metastasis-free survival (d), disease-free survival (e), and overall survival (f) in the Guangzhou internal validation cohort (n = 177). gi Distant metastasis-free survival (g), disease-free survival (h), and overall survival (i) in the Guilin external validation cohort (n = 150). The log-rank test was used to calculate P values (two-sided), and univariate Cox regression analyses were used to estimate the hazard ratios. HR hazard ratio, CI confidence interval. Source data are provided as a Source Data file.
Fig. 3
Fig. 3. Forest plots of the nine-lncRNA signature and clinicopathological characteristics on distant metastasis-free survival.
Hazard ratios (HR), 95% confidence interval (CI), and P values were calculated by an unadjusted Cox proportional-hazards model with a two-sided Wald test. Squares represent the hazard ratios with error bars corresponding to 95% CI bounds. EBV Epstein-Barr virus, HR hazard ratio, CI confidence interval. Source data are provided as a Source Data file.
Fig. 4
Fig. 4. Performance of the nine-lncRNA signature and clinical indicators for metastasis prediction.
ac Receiver operating characteristic (ROC) curve analysis evaluating the performance of the lncRNA signature, N stage, and EBV DNA for the prediction of distant metastasis in patients in the training (a, n = 177), Guangzhou internal validation (b, n = 177), and Guilin external validation (c, n = 150) cohorts. df ROC curve analysis evaluating the performance of the combined model (the lncRNA signature and N stage), the lncRNA signature alone and N stage alone for the prediction of distant metastasis in patients in the training (d, n = 177), Guangzhou internal validation (e, n = 177), and Guilin external validation (f, n = 150) cohorts. Two-sided DeLong’s test was used to estimate the P values. EBV Epstein-Barr virus, AUC area under curve. Source data are provided as a Source Data file.
Fig. 5
Fig. 5. Molecular characteristics of high-risk and low-risk groups.
a Bar plot showing the number of lncRNAs out of the nine lncRNAs in the signature that are enriched in that corresponding pathway by functional enrichment analyses based on GSEA. Permutation-based P value shows the statistical significance of the normalized enrichment score (NES). Adjustments for multiple comparisons were presented by false discovery rate (FDR). Significantly enriched pathways are defined as P < 0.05, FDR < 0.25, and absolute NES > 1. b Bubble plot of GSEA results of the nine lncRNAs with immunologically relevant pathways in LA-NPC patients of the discovery cohort (n = 38). The red color of the dots represents enrichment (P < 0.05, FDR < 0.25, absolute NES > 1), and the size of the dots represents absolute NES. Permutation-based P value shows the statistical significance of NES and adjustments for multiple comparisons were presented by FDR. c Circos plot showing the significantly enriched pathways between the high- and low-risk groups based on GSEA. The size of each sector represents the number of genes in the labeled pathway. The color of the outmost circle and inner bar plots represent the category of pathways. The size of the second outer circle represents the percentage of genes contributing to the enrichment score, and its color represents the magnitude of the statistical significance (shown as −log10 (P value)). The color of the third circle indicates that the labeled pathway is upregulated in the high- or low-risk group. The size of the inner bar plot shows the absolute NES. Permutation-based P value shows the statistical significance of NES and adjustments for multiple comparisons were presented by FDR. d Heatmap of differentially expressed immune-related genes between the high- and low-risk groups (Student’s two-sided t-test, P value < 0.05). FDR false discovery rate, NES normalized enrichment score. Source data are provided as a Source Data file.
Fig. 6
Fig. 6. Immune infiltration of high-risk and low-risk groups.
a Immune infiltration of patients (high-risk, n = 13; low-risk, n = 25) estimated by the MCP-counter algorithm. The dots represent the mean scores, and the error bars represent the standard deviation. The comparison was based on Student’s two-sided t-test. b Digital pathology analysis pipeline. For each sample, hematoxylin and eosin (H&E) and immunohistochemistry (IHC) slides were scanned, registered, and aligned in HALO software. Manual annotation of tumor nests and stroma areas on the H&E image were automatically synchronized to the IHC image. Positively stained cells in the IHC images were identified by the Multiplex IHC algorithm. Quantification of positively stained cells and the areas of tumor nests and stroma were automatically generated by HALO software. The scale bar represents 25 μm. c Representative images of CD20 and CD8 expression in intratumoral and stromal areas of tumor sections detected by IHC analysis in the high-risk (n = 21) and low-risk groups (n = 78). The images show high (left panel) or low (right panel) CD20+ B and CD8+ T cell densities in intratumoral and stromal areas, respectively. The scale bar represents 50 μm. d Comparison of CD20- and CD8-positive cells in intratumoral and stromal areas in patients in the high-risk (n = 21) and low-risk groups (n = 78) stratified by the nine-lncRNA signature. In each box plot, the centerline represents the median, the bounds represent the first and third quartiles and whiskers extend from the hinge to the largest value no further than 1.5 * interquartile range (IQR) from the hinge. Each dot represents a data point for individual patients. The comparison was based on Student’s two-sided t-test. Source data are provided as a Source Data file.

Similar articles

Cited by

References

    1. Pan JJ, et al. Prognostic nomogram for refining the prognostication of the proposed 8th edition of the AJCC/UICC staging system for nasopharyngeal cancer in the era of intensity-modulated radiotherapy. Cancer. 2016;122:3307–3315. doi: 10.1002/cncr.30198. - DOI - PMC - PubMed
    1. Bray F, et al. Global cancer statistics 2018: GLOBOCAN estimates of incidence and mortality worldwide for 36 cancers in 185 countries. CA Cancer J. Clin. 2018;68:394–424. doi: 10.3322/caac.21492. - DOI - PubMed
    1. Lai SZ, et al. How does intensity-modulated radiotherapy versus conventional two-dimensional radiotherapy influence the treatment results in nasopharyngeal carcinoma patients? Int J. Radiat. Oncol. Biol. Phys. 2011;80:661–668. doi: 10.1016/j.ijrobp.2010.03.024. - DOI - PubMed
    1. Hui EP, et al. Lung metastasis alone in nasopharyngeal carcinoma: a relatively favorable prognostic group. A study by the Hong Kong Nasopharyngeal Carcinoma Study Group. Cancer. 2004;101:300–306. doi: 10.1002/cncr.20358. - DOI - PubMed
    1. Chen L, et al. 10-year results of therapeutic ratio by intensity-modulated radiotherapy versus two-dimensional radiotherapy in patients with nasopharyngeal carcinoma. Oncologist. 2019;24:e38–e45. doi: 10.1634/theoncologist.2017-0577. - DOI - PMC - PubMed

Publication types

MeSH terms