. 2022 May 30;12(1):9024.
doi: 10.1038/s41598-022-12940-9.

Congenital sideroblastic anemia model due to ALAS2 mutation is susceptible to ferroptosis

Affiliations

Congenital sideroblastic anemia model due to ALAS2 mutation is susceptible to ferroptosis

Koya Ono et al. Sci Rep. .

Abstract

X-linked sideroblastic anemia (XLSA), the most common form of congenital sideroblastic anemia, is caused by a germline mutation in the erythroid-specific 5-aminolevulinate synthase (ALAS2) gene. In XLSA, defective heme biosynthesis leads to ring sideroblast formation because of excess mitochondrial iron accumulation. In this study, we introduced ALAS2 missense mutations on human umbilical cord blood-derived erythroblasts; hereafter, we refer to them as XLSA clones. XLSA clones that differentiated into mature erythroblasts showed an increased frequency of ring sideroblast formation with impaired hemoglobin biosynthesis. The expression profiling revealed significant enrichment of genes involved in ferroptosis, which is a form of regulated cell death induced by iron accumulation and lipid peroxidation. Notably, treatment with erastin, a ferroptosis inducer, caused a higher proportion of cell death in XLSA clones. XLSA clones exhibited significantly higher levels of intracellular lipid peroxides and enhanced expression of BACH1, a regulator of iron metabolism and potential accelerator of ferroptosis. In XLSA clones, BACH1 repressed genes involved in iron metabolism and glutathione synthesis. Collectively, defective heme biosynthesis in XLSA clones could confer enhanced BACH1 expression, leading to increased susceptibility to ferroptosis. The results of our study provide important information for the development of novel therapeutic targets for XLSA.


Conflict of interest statement

The authors declare no competing interests.

Figures
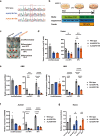
Figure 1
Figure 1
Establishment of HUDEP-2 cells harboring ALAS2 R170L and R170H mutations. (a) Sanger sequencing around amino acid residue 170 of ALAS2 (ALAS2 R170, indicated by a red rectangle) in HUDEP-2 clones. Underlined nucleotides are substituted after CRISPR/Cas9. (b) Protocol for erythroid differentiation of HUDEP-2. DEX, dexamethasone; DOX, doxycycline; EPO, erythropoietin; FBS, fetal bovine serum; IMDM, Iscove’s Modified Dulbecco’s Medium; ITS, insulin-transferrin-selenium; SCF, stem cell factor; SFC, sodium ferrous citrate; SFEM, serum-free expansion medium. (c) Cell pellets of undifferentiated and differentiated HUDEP-2 clones. The effect of supplementation of SFC or 5-aminolevulinic acid (ALA) has also been demonstrated. Representative images of three independent experiments are presented. (d) Intracellular heme concentration of HUDEP-2 clones (n = 3). (e, f) Quantitative reverse transcriptase-polymerase chain reaction analysis for HBB, HBA (e) and ALAS2 (f), expression relative to GAPDH in HUDEPWT, HUDEPR170L, and HUDEPR170H (n = 3). (g) Intracellular heme concentration of HUDEPWT, HUDEPR170L, and HUDEPR170H after 6 day differentiation with or without ALA supplementation (n = 3). The values are normalized relative to the mean value of undifferentiated HUDEPWT. In (d), (e), (f), and (g), the graphs were plotted using GraphPad Prism 9 (GraphPad Software, San Diego, CA, www.graphpad.com). The error bars represent the standard error of the mean. Each P-value was calculated using Tukey’s test (d, e, and f) or Šidák’s test (g) after a two-way analysis of variance. *P < 0.05, **P < 0.01, ***P < 0.001, ****P < 0.0001.
Figure 2
Figure 2
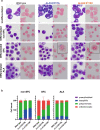
ALAS2 mutations result in impaired erythroid differentiation and ring sideroblast formation. (a) May-Giemsa (each of left panel) and Prussian blue staining (each of right panel) of HUDEPWT, HUDEPR170L, and HUDEPR170H. Ring sideroblasts are zoomed in the subpanels. The representative images of three independent experiments are shown. (b) Count of erythroid progenitor cells derived from HUDEP-2 clones after 6 day differentiation (n = 3). May-Giemsa staining was used for quantification. The graphs were plotted using GraphPad Prism 9 (GraphPad Software, San Diego, CA, www.graphpad.com). ALA, 5-aminolevulinic acid; SFC, sodium ferrous citrate.
Figure 3
Figure 3
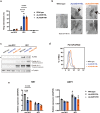
ALAS2 mutations result in iron overload. (a) Count of ring sideroblasts of HUDEP-2 clones after 6 day differentiation without sodium ferrous citrate (SFC), with SFC and with 5-aminolevulinic acid (ALA) (n = 3). Error bars represent the standard error of the mean. Each P value was calculated using Tukey’s test after a two-way analysis of variance. ****P < 0.0001. (b) Images of electron microscopy in HUDEP-2 clones after differentiation with SFC. Arrows indicate aberrant mitochondrial iron deposits. The portions surrounded by a dashed line indicate mitochondrial spheroids. (c) Western blotting for ALAS2, ferritin and α-tubulin in HUDEP-2 clones after differentiation with or without SFC. The cropped gel images are delineated, and the uncropped images can be found in Supplementary Fig. S7. In (b) and (c), the representative images of three independent experiments are shown. (d) Intracellular labile iron of HUDEP-2 clones after differentiation with SFC. The fluoroprobe FerroFarRed was used for a marker of intracellular labile iron. The representative histogram of three independent experiments, plotted using FlowJo version 7.6.5 software (TreeStar, Ashland, OR, www. flowjo. com), is shown. (e) Quantitative reverse transcriptase-polymerase chain reaction analysis for TfR1 and DMT1, expression relative to GAPDH in HUDEPWT, HUDEPR170L, and HUDEPR170H (n = 3). In a and e, graphs were plotted using GraphPad Prism 9 (GraphPad Software, San Diego, CA, www.graphpad.com).
Figure 4
Figure 4
Genes associated with oxidative stress protection are differentially expressed during erythroid differentiation. Enrichment analysis of HUDEP-2 clones using Metascape. After 6 day differentiation with SFC, 1265, 1750, and 1386 genes were upregulated (> 2-fold) for HUDEPWT, HUDEPR170L, and HUDEPR170H, respectively, compared with the undifferentiated HUDEPWT. These genes were analyzed, and enriched gene clusters were displayed as a heatmap that shows hypergeometric P-values of each annotated term. The heatmap is visualized using Java TreeView version 1.1.6r4 (jtreeview.sourceforge.net). EIF2AK1, eukaryotic translation initiation factor 2-alpha kinase 1; HRI, heme-regulated inhibitor.
Figure 5
Figure 5
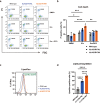
XLSA clones show higher ferroptosis susceptibility. (a, b) Cell death assessment of HUDEPWT, HUDEPR170L, and HUDEPR170H after 6 day differentiation with sodium ferrous citrate (SFC) followed by 24 h treatment with 100 μM erastin (Era; Selleck Chemicals, Houston, TX) with or without 100 μM deferoxamine (DFO; Sigma-Aldrich, St. Louis, MO). Using flow cytometry, propidium iodide (PI)-positive cells were defined as dead cells. The representative scattergram (a) and quantification of dead cells (b, n = 3) are shown. DMSO, dimethyl sulfoxide; FSC, forward scatter. (c, d) Lipid peroxidation of HUDEP-2 clones after differentiation with SFC. The fluoroprobe Liperfluo was used for a marker of lipid peroxidation. The representative histogram (c) and quantification of Liperfluo positive cells (d, n = 5) are shown. In (a) and (c), the data were analyzed using FlowJo version 7.6.5 software (TreeStar, Ashland, OR, www. flowjo. com). In (b) and (d), the graphs were plotted using GraphPad Prism 9 (GraphPad Software, San Diego, CA, www.graphpad.com). The error bars represent the standard error of the mean. Each P value was calculated using Dunnett’s test after a two-way analysis of variance (b) or Tukey’s test after a one-way analysis of variance (d). *P < 0.05, **P < 0.01, ***P < 0.001, ****P < 0.0001.
Figure 6
Figure 6
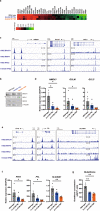
XLSA clones show transcriptional alterations of the genes associated with glutathione synthesis. (a) Expression profiles of the genes registered to hsa04216 (ferroptosis pathway) of Kyoto Encyclopedia of Genes and Genomes in HUDEPWT, HUDEPR170L, and HUDEPR170H after 6 day differentiation with sodium ferrous citrate (SFC). The genes are arranged from the bottom in the order of the fold change of differentiated HUDEPWT to undifferentiated HUDEPWT. The heatmap is visualized using Java TreeView version 1.1.6r4 (jtreeview.sourceforge.net). (b) Western blotting for BACH1, GCLC, GCLM, and α-tubulin in HUDEP-2 clones after differentiation with SFC. Representative images of three independent experiments are presented. The cropped gel images are delineated, and the uncropped images can be found in Supplementary Fig. S9. (c, e) Chromatin immunoprecipitation with sequencing (ChIP-seq) analysis of the binding of BACH1 and MAFK for the gene region in K562 for HMOX1, GCLM, and GCLC (c); and FTH1, FTL, and SLC40A1 (e). We used ChIP-seq data from GEO (Gene Expression Omnibus) data set: BACH1 in K562, GSM935576; MAFK in K562, GSM935311; NFE2 in K562, GSM935414; and NFE2 in human erythroblasts, GSM1427076. E-blast, erythroblast. (d, f) Quantitative reverse transcriptase-polymerase chain reaction analysis for HMOX1, GCLM, and GCLC (d); and FTH1, FTL, and SLC40A1 (f) in HUDEP-2 clones after differentiation with SFC. The data were normalized relative to the GAPDH expression levels. (g) Intracellular glutathione concentration of HUDEP-2 clones after differentiation with SFC (n = 3). In (d), (f), and (g), the graphs were plotted using GraphPad Prism 9 (GraphPad Software, San Diego, CA, www.graphpad.com). The error bars represent the standard error of the mean. Each P value was calculated using Tukey’s test after a one-way analysis of variance. *P < 0.05, **P < 0.01, ***P < 0.001, ****P < 0.0001.
Figure 7
Figure 7
Schematic representation of the pathophysiology of XLSA. In XLSA, impaired heme biosynthesis enhances BACH1 expression, resulting in the alteration of the transcriptional program during differentiation, resulting in the suppression of genes associated with glutathione synthesis (i.e., GCLM) and iron metabolism (i.e., FTH1 and FTL). Reduced glutathione synthesis causes higher levels of lipid peroxidation, leading to increased ferroptosis sensitivity.

Similar articles

Cited by

References

    1. Fujiwara T, Harigae H. Molecular pathophysiology and genetic mutations in congenital sideroblastic anemia. Free Radic. Biol. Med. 2018 doi: 10.1016/j.freeradbiomed.2018.08.008. - DOI - PubMed
    1. Ducamp S, Fleming MD. The molecular genetics of sideroblastic anemia. Blood. 2019;133:59–69. doi: 10.1182/blood-2018-08-815951. - DOI - PMC - PubMed
    1. Yoshida K, et al. Frequent pathway mutations of splicing machinery in myelodysplasia. Nature. 2011;478:64–69. doi: 10.1038/nature10496. - DOI - PubMed
    1. Bottomley, S. S. & Fleming, M. D. Sideroblastic anemia: diagnosis and management. Hematol. Oncol. Clin. N. Am.28, 653–670, v. 10.1016/j.hoc.2014.04.008 (2014). - PubMed
    1. Ohba R, et al. Clinical and genetic characteristics of congenital sideroblastic anemia: Comparison with myelodysplastic syndrome with ring sideroblast (MDS-RS) Ann. Hematol. 2013;92:1–9. doi: 10.1007/s00277-012-1564-5. - DOI - PMC - PubMed

Supplementary concepts