. 2022 May 30;13(5):507.
doi: 10.1038/s41419-022-04911-9.

Inhibiting multiple forms of cell death optimizes ganglion cells survival after retinal ischemia reperfusion injury

Affiliations

Inhibiting multiple forms of cell death optimizes ganglion cells survival after retinal ischemia reperfusion injury

Qiyu Qin et al. Cell Death Dis. .

Abstract

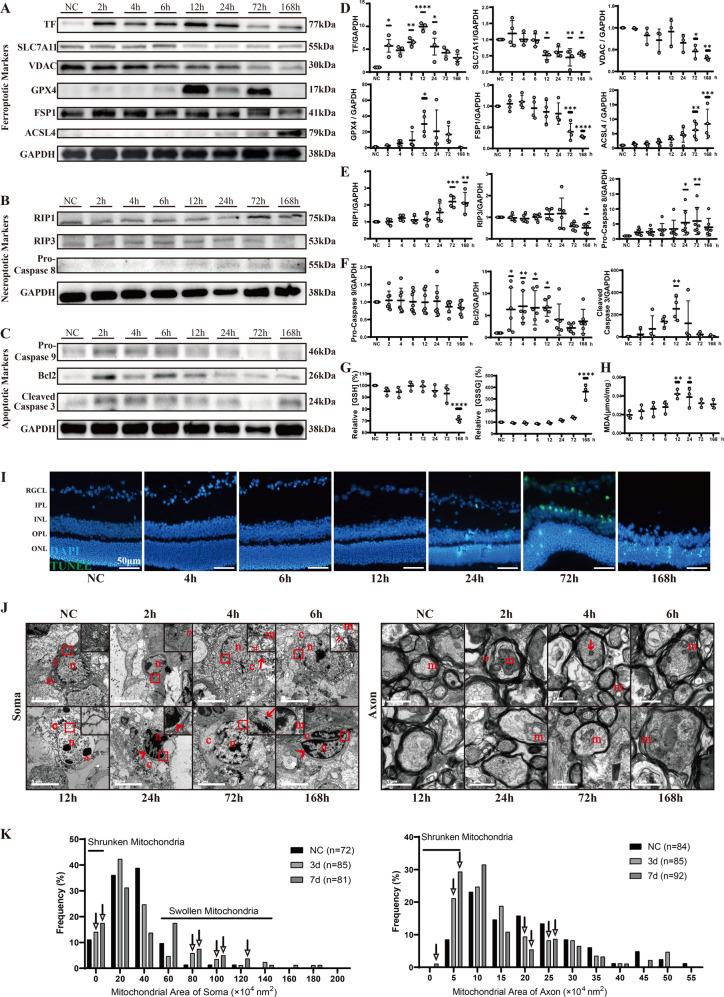
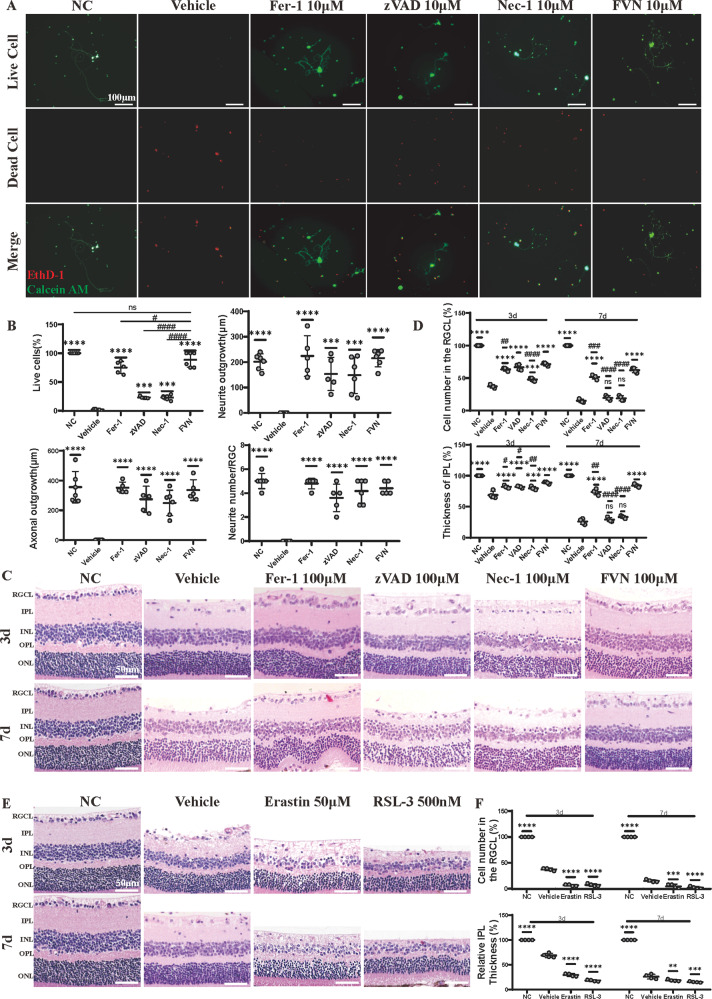
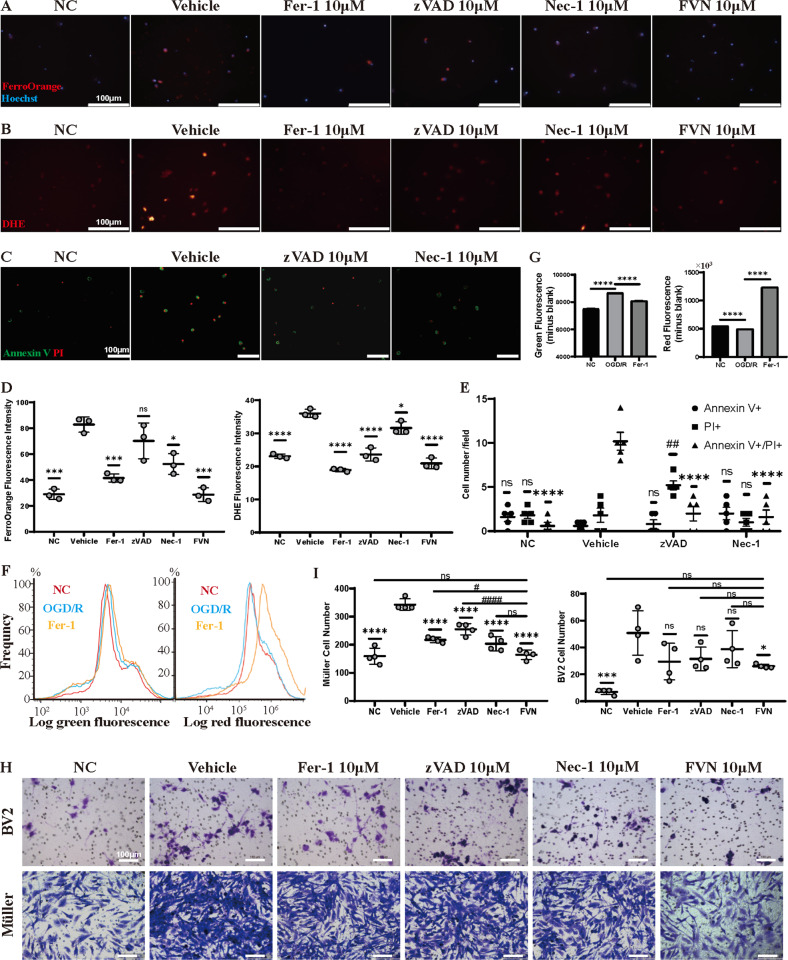
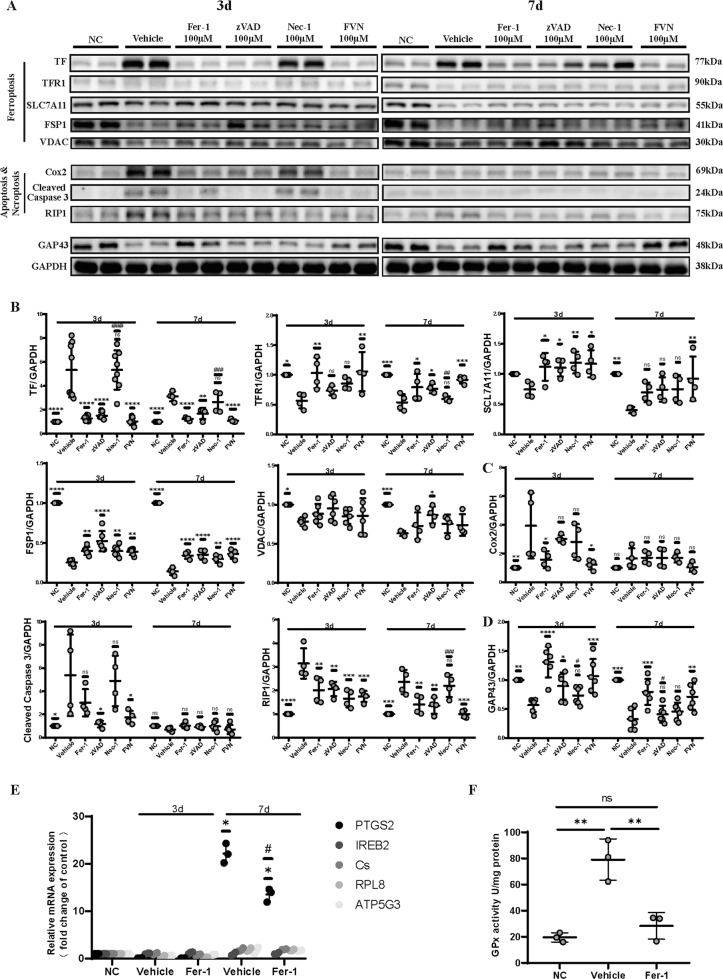
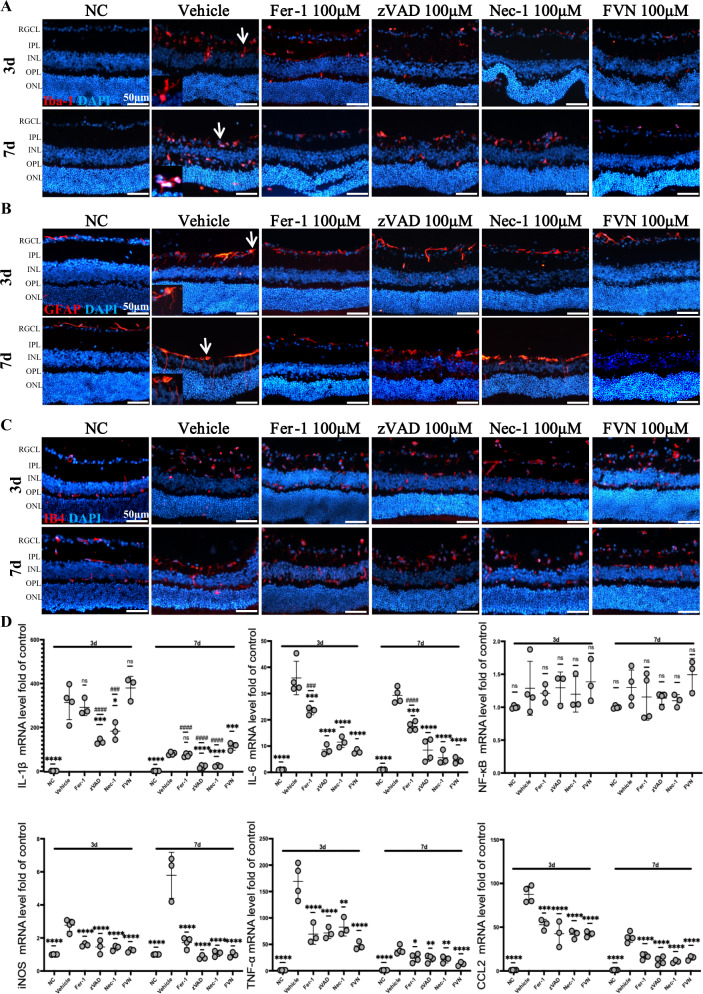
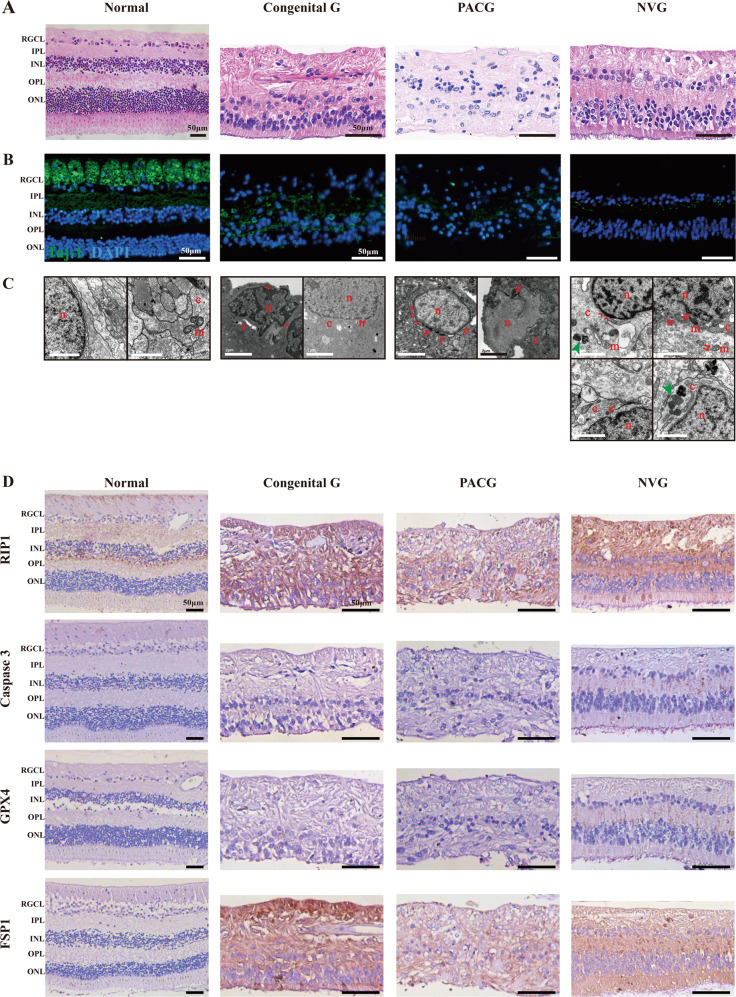
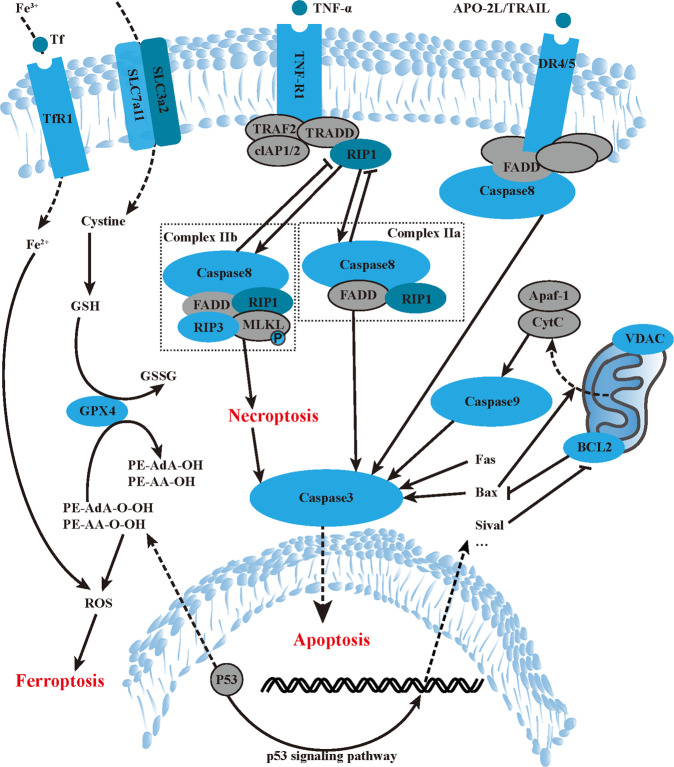
Progressive retinal ganglion cells (RGCs) death that triggered by retinal ischemia reperfusion (IR), leads to irreversible visual impairment and blindness, but our knowledge of post-IR neuronal death and related mechanisms is limited. In this study, we first demonstrated that apart from necroptosis, which occurs before apoptosis, ferroptosis, which is characterized by iron deposition and lipid peroxidation, is involved in the whole course of retinal IR in mice. Correspondingly, all three types of RGCs death were found in retina samples from human glaucoma donors. Further, inhibitors of apoptosis, necroptosis, and ferroptosis (z-VAD-FMK, Necrostatin-1, and Ferrostatin-1, respectively) all exhibited marked RGC protection against IR both in mice and primary cultured RGCs, with Ferrostatin-1 conferring the best therapeutic effect, suggesting ferroptosis plays a more prominent role in the process of RGC death. We also found that activated microglia, Müller cells, immune responses, and intracellular reactive oxygen species accumulation following IR were significantly mitigated after each inhibitor treatment, albeit to varying degrees. Moreover, Ferrostatin-1 in combination with z-VAD-FMK and Necrostatin-1 prevented IR-induced RGC death better than any inhibitor alone. These findings stand to advance our knowledge of the post-IR RGC death cascade and guide future therapy for RGC protection.


Conflict of interest statement

The authors declare no competing interests.

Figures

Fig. 1
Fig. 1. Ferroptosis, necroptosis and apoptosis are all involved in retinal IR-caused RGCs loss.
A, B, C Western blot bands of the indicated proteins (A ferroptosis, B necroptosis, and C apoptosis) in total retina at different times (0–168 h) after IR injury. D, E, F Quantitative analysis of the protein expressions of ferroptotic markers (D: TF, SLC7A11, VDAC, GPX4, FSP1, ACSL4), necroptotic markers (E: RIP1, RIP3, pro-Caspase 8), apoptotic markers (F: pro-Caspase 9, Bcl2, cleaved Caspase 3), and GAPDH (n = 3–7). G Relative retina GSH and GSSG contents after IR injury were determined by relative assay kits (n = 3). H Malondialdehyde (MDA) concentration in the retina at different times after IR injury (n = 3). Data in (DH) are represented as mean ± SD; *p < 0.05, **p < 0.01, ***p < 0.001, ****p < 0.0001 versus NC; one-way ANOVA with Bonferroni post hoc analysis. I Representative images of TUNEL + cells (green) in the retina at different times after IR injury. Nucleus was marked with DAPI (blue). Scale bar = 50 μm. J Ultrastructural change of RGC somas (left) and axons (right) following IR (n = 3). n nuclei, c cytoplasm, m mitochondria, red arrows, shrunken mitochondria; red double arrows, organelle incompleteness or nuclear membrane rupture; red arrowhead, chromatin condensation; red square, the area of each inset. Scale bar = 5 μm (left) or 1 μm (right). K Mitochondrial area frequency in somas (left) and axons (right). Arrows indicate different frequencies of shrunken or swollen mitochondria in IR groups (number of soma mitochondria, NC: n = 72; IR 3 d: n = 85; IR 7 d: n = 81; number of axon mitochondria, NC: n = 84; IR 3 d: n = 85; IR 7 d: n = 92). NC normal control, IR ischemia reperfusion, RGCL retinal ganglion cell layer, IPL inner plexiform layer, INL inner nuclear layer, OPL outer plexiform layer, ONL outer nuclear layer.
Fig. 2
Fig. 2. Fer-1, zVAD and Nec-1 improve RGC survival respectively and collectively both in vitro and in vivo.
A Live/Dead assay staining for mouse primary RGCs that underwent OGD/R with vehicle treatment (DMSO) or 10 μM Fer-1, zVAD, Nec-1, or FVN (green for live cells, red for dead cells) and (B) statistical analysis of percentage of live cells, neurite outgrowth, axonal outgrowth, and average neurite number (n = 5). Scale bar = 100 μm. C HE staining of retinal tissue in mice that underwent sham or IR injury at 3 and 7 d after intravitreal injection of vehicle (DMSO) or 100 μM Fer-1, zVAD, Nec-1, or FVN and (D) analysis of RGC number and IPL thickness (n = 4). Scale bar = 50. E HE staining of retinal tissue in mice that underwent sham or IR injury at 3 and 7 d after intravitreal injection of vehicle (DMSO) or 50 μM Erastin and 500 nM RSL-3 and (F) analysis of RGC numbers and IPL thickness (n = 4). Scale bar = 50 μm. Data in (B, D, F) are represented as mean ± SD; *p < 0.05, **p < 0.01, ***p < 0.001, ****p < 0.0001 versus vehicle; #p < 0.05, ##p < 0.01, ###p < 0.001, ####p < 0.0001 versus FVN; one-way ANOVA with Bonferroni post hoc analysis. NC normal control, OGD/R oxygen glucose deprivation/reoxygenation, IR ischemia reperfusion, RGCL retinal ganglion cell layer, IPL inner plexiform layer, INL inner nuclear layer, OPL outer plexiform layer, ONL outer nuclear layer, FVN combination of Fer-1, zVAD, and Nec-1.
Fig. 3
Fig. 3. Fer-1, zVAD, and Nec-1 work through their targets to reduce OGD/R-induced primary RGC damage.
A FerroOrange probe (red) staining for intracellular Fe2+ in mouse primary RGCs that underwent OGD/R with vehicle treatment or 10 μM Fer-1, zVAD, Nec-1, or FVN. Scale bar = 100 μm. B Dihydroethidium (DHE) staining for ROS (red) in mouse primary RGCs that underwent OGD/R with the same FerroOrange treatment. Scale bar = 100 μm. C Annexin V and propidium iodide (PI) staining for apoptosis and necrosis in mouse primary RGCs that underwent OGD/R with vehicle treatment or 10 μM zVAD or Nec-1 (green for Annexin V+, red for PI+). Scale bar = 100 μm. D Statistical analysis of fluorescence intensity for FerroOrange and DHE (n = 3). E Statistical analysis of the number of RGCs with Annexin V+, PI+, or Annexin V+/PI+ (n = 5). Data in (E) are represented as mean ± SD; ****p < 0.0001 versus vehicle in Annexin V+/PI+ cells; ##p < 0.01 versus vehicle in PI+ cells; one-way ANOVA with Bonferroni post hoc analysis. F Histogram showing green and red fluorescence changes after staining with C11 BODIPY in mouse RGCs that underwent OGD/R with vehicle treatment or 10 μM Fer-1 and (G) statistical analysis of fluorescence intensity. H Chemotaxis of the supernatants from cultured RGCs in each group toward Müller or BV2 microglial cell lines was tested by 24 h Transwell assay and following crystal violet staining and (I) statistical analysis of cell number (n = 4). Scale bar = 100 μm. Data in (D, G, I) are represented as mean ± SD; *p < 0.05, **p < 0.01, ***p < 0.001, ****p < 0.0001 versus vehicle or OGD/R; #p < 0.05, ##p < 0.01, ###p < 0.001, ####p < 0.0001 versus FVN; one-way ANOVA with Bonferroni post hoc analysis. NC normal control, OGD/R oxygen glucose deprivation/reoxygenation, FVN combination of Fer-1, zVAD, and Nec-1.
Fig. 4
Fig. 4. In situ administration of Fer-1, zVAD, Nec-1, and their combination alters the expression of death pathway- and neurogenesis-related proteins.
A Western blot bands of the indicated proteins in sham or IR-injured retina 3 and 7 d after each treatment and (B, C, D) quantitative analysis of the protein expression levels of ferroptotic markers (B: TF, TFR1, SLC7A11, FSP1, VDAC), apoptotic and necroptotic markers (C: Cox2, cleaved Caspase 3, RIP1), neurogenesis-related marker (D: GAP43), and GAPDH (n = 4–6). E Expression of the genes involved in ferroptosis was examined in sham or IR-injured retina by qRT-PCR at 3 and 7 d post-vehicle (DMSO) or post-Fer-1 treatment (n = 3). Data in E are represented as mean ± SD; *p < 0.05 versus NC; #p < 0.05 versus vehicle; one-way ANOVA with Bonferroni post hoc analysis. F GPx activity of sham or IR-injured retina with vehicle (DMSO) or Fer-1 treatment was measured with a GPx assay kit at 3 d post-IR (n = 3). Data in (BD, F) are represented as mean ± SD; *p < 0.05, **p < 0.01, ***p < 0.001, ****p < 0.0001 versus vehicle; #p < 0.05, ##p < 0.01, ###p < 0.001, ####p < 0.0001 versus FVN; one-way ANOVA with Bonferroni post hoc analysis. NC normal control, IR ischemia reperfusion, FVN combination of Fer-1, zVAD, and Nec-1.
Fig. 5
Fig. 5. In situ administration of Fer-1, zVAD, Nec-1, and their combination mitigates activated microglia, Müller cells, and inflammatory responses, but not neovascularization.
A, B, C Representative images of microglia, Müller cells, and neovascularization in sham or IR-injured retina 3 and 7 d after each treatment. Microglia and Müller cells were marked with Iba-1 and GFAP, respectively (red). An inset with an enlarged magnification of the area pointed out with a white arrow was added to the original picture in the bottom-left to exhibit the typical morphological character of activated microglia and Müller cells in the IR-vehicle group. Neovascularization was marked with IB4 (red). Nucleus was marked with DAPI (blue). Scale bar = 50 μm. D Expression of genes coding for inflammation markers was measured in sham and injured retina by qRT-PCR at 3 and 7 d after each treatment (n = 4). Data in (D) are represented as mean ± SD; *p < 0.05, **p < 0.01, ***p < 0.001, ****p < 0.0001 versus vehicle; #p < 0.05, ##p < 0.01, ###p < 0.001, ####p < 0.0001 versus FVN; one-way ANOVA with Bonferroni post hoc analysis. NC normal control, IR ischemia reperfusion, RGCL retinal ganglion cell layer, IPL inner plexiform layer, INL inner nuclear layer, OPL outer plexiform layer, ONL outer nuclear layer, FVN combination of Fer-1, zVAD, and Nec-1.
Fig. 6
Fig. 6. RGCs in retina samples from end-stage glaucoma patients undergo apoptosis, necroptosis and ferroptosis.
A HE staining from a normal human donor and patients with congenital glaucoma (Congenital G), primary angle-closure glaucoma (PACG) and neovascular glaucoma (NVG). Scale bar = 50 μm. B Representative images of neuronal marker in retinal tissue from human eyes corresponding to HE staining. RGCs were marked with Tuj-1 (green) and nucleus with DAPI (blue). Scale bar = 50 μm. C Ultrastructural change of RGC somas from human eyes corresponding to HE staining. n nuclei, c cytoplasm, m mitochondria, red arrows, shrunken mitochondria; red double arrows, organelle incompleteness or nuclear membrane rupture; red arrowhead, chromatin condensation; green arrow head, autophagolysosome. Scale bar = 2 μm. D Immunohistochemistry of RIP1, Caspase 3, GPX4, and FSP1 expression in retinal tissue from human eyes corresponding to HE staining. Scale bar = 50 μm. RGCL retinal ganglion cell layer, IPL inner plexiform layer, INL inner nuclear layer, OPL outer plexiform layer, ONL outer nuclear layer.
Fig. 7
Fig. 7. Diagram of apoptosis, necroptosis, and ferroptosis pathway.
During ischemia reperfusion injury, apoptosis, necroptosis and ferroptosis pathway are activated. Transferrin upregulation brings intracellular iron accumulation while cystine-transportation and GPX4 dysfunction brings phospholipids peroxidation. Finally lipid ROS increases and activates ferroptosis. TNF-α activates its receptor, resulting in formation of Complex IIa or Complex IIb, and leads to necroptosis or apoptosis respectively. Apoptosis can also originate from some other extrinsic or intrinsic signals, such as Apo2 Ligand or cytochrome c. The crosstalks among these pathways are complicated and need study more.

References

    1. Musayeva A, Unkrig JC, Zhutdieva MB, Manicam C, Ruan Y, Laspas P, et al. Betulinic Acid Protects from Ischemia-Reperfusion Injury in the Mouse Retina. Cells. 2021;10:2440. - PMC - PubMed
    1. Osborne NN, Casson RJ, Wood JP, Chidlow G, Graham M, Melena J. Retinal ischemia: mechanisms of damage and potential therapeutic strategies. Prog retinal eye Res. 2004;23:91–147. doi: 10.1016/j.preteyeres.2003.12.001. - DOI - PubMed
    1. Tezel G, Yang X. Caspase-independent component of retinal ganglion cell death, in vitro. Investigative Ophthalmol Vis Sci. 2004;45:4049–59. doi: 10.1167/iovs.04-0490. - DOI - PMC - PubMed
    1. Huang Z, Zhou T, Sun X, Zheng Y, Cheng B, Li M, et al. Necroptosis in microglia contributes to neuroinflammation and retinal degeneration through TLR4 activation. Cell death Differ. 2018;25:180–9. doi: 10.1038/cdd.2017.141. - DOI - PMC - PubMed
    1. Wu XN, Yang ZH, Wang XK, Zhang Y, Wan H, Song Y, et al. Distinct roles of RIP1-RIP3 hetero- and RIP3-RIP3 homo-interaction in mediating necroptosis. Cell death Differ. 2014;21:1709–20. doi: 10.1038/cdd.2014.77. - DOI - PMC - PubMed

Publication types