. 2022 Jun;19(6):751-758.
doi: 10.1038/s41592-022-01491-6. Epub 2022 May 30.

Label-free nanofluidic scattering microscopy of size and mass of single diffusing molecules and nanoparticles

Affiliations

Label-free nanofluidic scattering microscopy of size and mass of single diffusing molecules and nanoparticles

Barbora Špačková et al. Nat Methods. 2022 Jun.

Abstract

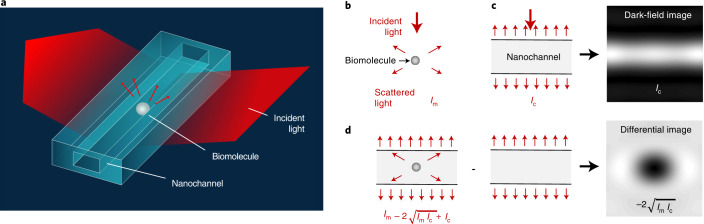
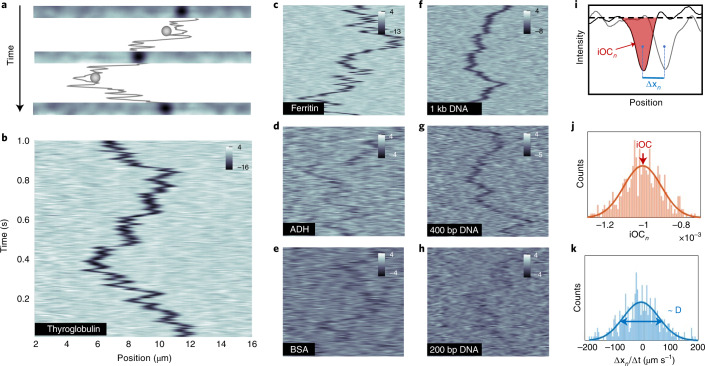
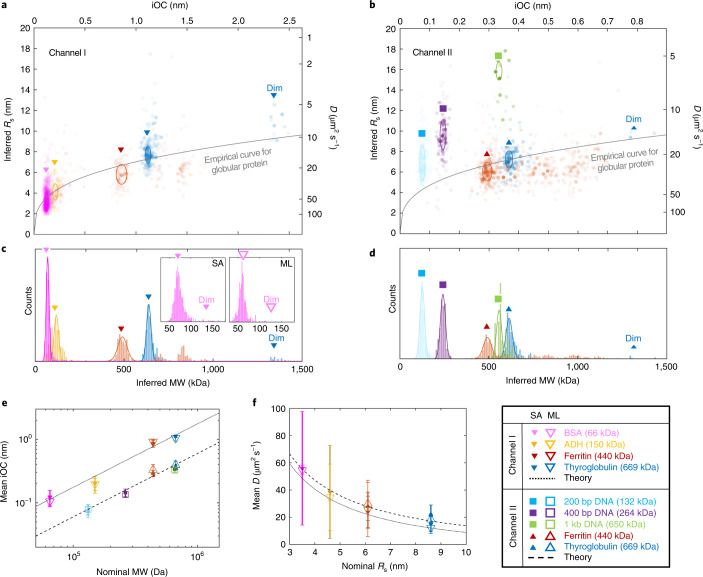
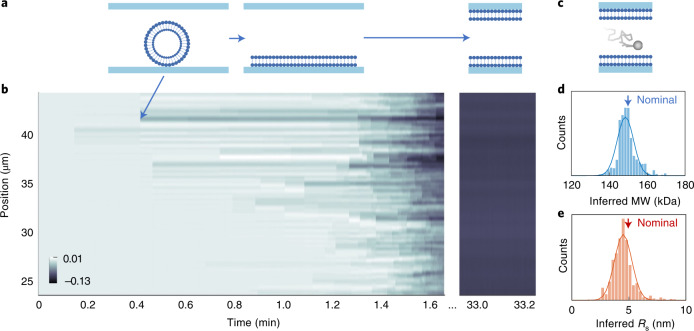
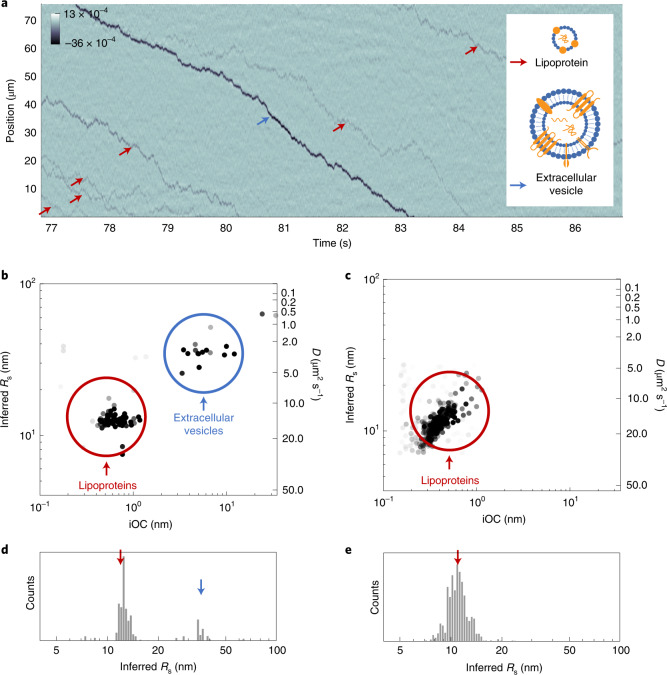
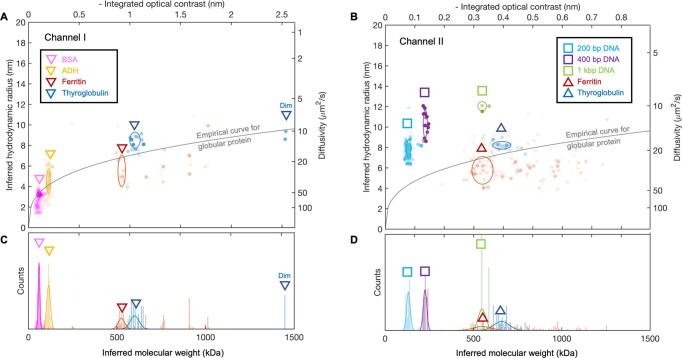
Label-free characterization of single biomolecules aims to complement fluorescence microscopy in situations where labeling compromises data interpretation, is technically challenging or even impossible. However, existing methods require the investigated species to bind to a surface to be visible, thereby leaving a large fraction of analytes undetected. Here, we present nanofluidic scattering microscopy (NSM), which overcomes these limitations by enabling label-free, real-time imaging of single biomolecules diffusing inside a nanofluidic channel. NSM facilitates accurate determination of molecular weight from the measured optical contrast and of the hydrodynamic radius from the measured diffusivity, from which information about the conformational state can be inferred. Furthermore, we demonstrate its applicability to the analysis of a complex biofluid, using conditioned cell culture medium containing extracellular vesicles as an example. We foresee the application of NSM to monitor conformational changes, aggregation and interactions of single biomolecules, and to analyze single-cell secretomes.


Conflict of interest statement

B.S., J.F. and C.L. are founders of Envue Technologies AB, which owns intellectual property related to the described research. J.F. and C.L. are members of the board of Envue Technologies AB. The remaining authors declare no competing interests.

Figures

Fig. 1
Fig. 1. Principle of NSM.
a, Artist’s rendition of the experimental configuration where visible light irradiates a nanochannel with a biomolecule inside, and where the light scattered from the system is collected in dark-field configuration. b, Schematic of light scattered by a single biomolecule. c, Schematic of light scattered by a nanochannel and the corresponding dark-field image. d, Schematic of light scattered by a nanochannel with a single biomolecule inside, and the corresponding differential dark-field image obtained by subtracting an image of the empty nanochannel from the image of the nanochannel with the biomolecule inside.
Fig. 2
Fig. 2. Time-resolved NSM of diffusing single biomolecules.
a, Selection of differential images of a nanochannel containing a diffusing single thyroglobulin, MW = 669 kDa. Its trajectory is depicted between the images. bh, Kymographs of single proteins inside Channel I with AI = 100 × 27 nm2 and DNA molecules inside Channel II with AII = 110 × 72 nm2: thyroglobulin (669 kDa) (b), ferritin (440 kDa) (c), ADH (150 kDa) (d), BSA, (66 kDa) (e), 1 kb DNA (650 kDa) (f), 400 bp DNA (264 kDa) (g), 200 bp DNA (132 kDa) (h). The space and time coordinates of ch correspond to those shown in b. Contrast is expressed in relative units divided by 10-4 (ik). Principle of iOC and D evaluation. i, iOCn and space displacement (Δxn) are determined from the nth and (n+1)th frame of the kymograph, respectively. j Histogram of iOCn and k space displacement in time (Δxnt) evaluated in each time step of a trajectory of a single thyroglobulin.
Fig. 3
Fig. 3. A single-biomolecule library.
a,b, Scatter plots of iOC translated into MW using Eq. 1, and D translated into RS using Eq. 2 for individual biomolecules of different types, measured in Channel I (a) and Channel II (b) and analyzed using SA. Each dot is extracted from a single biomolecule trajectory. Color intensity scales linearly with frame number of the trajectory (N). The highest intensity corresponds to N = 1,100 frames. The population of molecular monomers are marked by ellipses whose centers correspond to the iOC¯ and D¯, and their horizontal and vertical diameters to the resolution in iOC and D, respectively. The gray line corresponds to an empirical relationship between MW and D for globular proteins. c,d, MW histograms of the biomolecules in a and b translated from the iOC using Eq. 1. The insets in c show zoomed-in BSA histograms obtained by SA and ML, revealing a small dimer population (Dim). e, Dependency of iOC¯ of protein monomers on nominal MW compared with the theoretical model (Eq. 1). f, Protein monomer D¯ dependency on nominal Rs compared with the confinement-corrected Stokes–Einstein equation (Eq. 2). e and f show the agreement between the independent results of SA and ML; data are presented as mean values and error bars correspond to the resolution in iOC and D, respectively; the presented values were derived from n = 18–695 trajectories (for n specific for each measurement, see Source Data). Source data
Fig. 4
Fig. 4. Surface passivation.
a, Schematic of SLB formation. LUVs flow through the nanochannel, adsorb on the nanochannel wall, rupture and create patches of lipids that eventually connect and create a homogenous layer. b, Kymograph capturing the SLB formation in Channel V, as manifested by decrease in scattering intensity. c, Schematic of a biomolecule diffusing inside a nanochannel coated with an SLB. d,e, Inferred molecular weight (d) and Rs (e) of the positively charged protein aldolase measured in Channel VI and analyzed by ML. The arrows indicate the nominal values (MW = 158 kDa, RS = 4.6 nm (ref. )). Source data
Fig. 5
Fig. 5. Analysis of BNPs in conditioned cell culture medium containing serum.
a, Kymograph of multiple lipoprotein particles (red arrows) and one larger EV (blue arrow) moving through the nanochannel. Inset, schematics of an EV and a lipoprotein (depicted to scale). b,c, Scatter plots of iOC and D translated into RS. d,e, Histograms of RS, analyzed using ML. Data correspond to the conditioned SH-SY5Y human cell medium (b,d) and to the control where the medium had not been in contact with the cells (c,e). All data were acquired in Channel V, which had been passivated by an SLB before measurement. Source data
Extended Data Fig. 1
Schematic of the experimental setup.
Extended Data Fig. 2
Schematic of the nanofluidic chip.
Extended Data Fig. 3
Extended Data Fig. 3. SEM images of nanochannel cross sections of (A-F) Channel I – VI used in different experiments.
The domain from which the area of the cross section was calculated is highlighted by the dashed line. The width and length correspond to the dimensions of a rectangle with area equal to the determined cross-sectional area of the nanochannel.
Extended Data Fig. 4
Extended Data Fig. 4. Machine-learning analysis results.
(A, B) Scatter plots of iOC translated into MW using Eq. 1 in the main text, and D translated into RS using Eq. 2 in the main text for individual biomolecules of different types, measured in (A) Channel I and (B) Channel II using ML. Each dot is extracted from a single biomolecule trajectory. Color intensity scales linearly with frame number of the trajectory (N). The highest intensity corresponds to N = 2130 frames. The gray line corresponds to an empirical relation between MW and D for globular protein (C, D) iOC histograms of the biomolecules in (A, B) translated into MW using Eq. 1 in the main text. Source data
Extended Data Fig. 5
Extended Data Fig. 5. Ferritin–nanochannel wall interaction.
Kymograph of a single ferritin molecule inside Channel II. For each time frame, the dark spot in the image corresponds to the position of the ferritin that resides inside the field of the view. The position of the biomolecule changes stochastically in the left and right part of the image, whereas in the central part, it remains fixed for about 0.3 s. These two different behaviors correspond to two different states of a biomolecule – freely diffusing and bound to the nanochannel wall, respectively. The trajectory of the biomolecule was found using a particle tracking algorithm and from the statistics of the movement, the part of the trajectory corresponding to the bound state was identified and excluded from the further analysis (more details in SI section “Particle tracking”).

References

    1. Shashkova S, Leake MC. Single-molecule fluorescence microscopy review: shedding new light on old problems. Biosci. Rep. 2017;37:BSR20170031. doi: 10.1042/BSR20170031. - DOI - PMC - PubMed
    1. Ha T, et al. Probing the interaction between two single molecules: fluorescence resonance energy transfer between a single donor and a single acceptor. Proc. Natl Acad. Sci. USA. 1996;93:6264–6268. doi: 10.1073/pnas.93.13.6264. - DOI - PMC - PubMed
    1. Hoskins AA, et al. Ordered and dynamic assembly of single spliceosomes. Science. 2011;331:1289–1295. doi: 10.1126/science.1198830. - DOI - PMC - PubMed
    1. Taniguchi Y, et al. Quantifying E. coli proteome and transcriptome with single-molecule sensitivity in single cells. Science. 2010;329:533–538. doi: 10.1126/science.1188308. - DOI - PMC - PubMed
    1. Wang C, Han BR, Zhou RB, Zhuang XW. Real-time imaging of translation on single mRNA transcripts in live cells. Cell. 2016;165:990–1001. doi: 10.1016/j.cell.2016.04.040. - DOI - PMC - PubMed

Publication types