. 2022 Jun;7(6):766-779.
doi: 10.1038/s41564-022-01130-y. Epub 2022 May 30.

CRISPRi chemical genetics and comparative genomics identify genes mediating drug potency in Mycobacterium tuberculosis

Affiliations

CRISPRi chemical genetics and comparative genomics identify genes mediating drug potency in Mycobacterium tuberculosis

Shuqi Li et al. Nat Microbiol. 2022 Jun.

Abstract

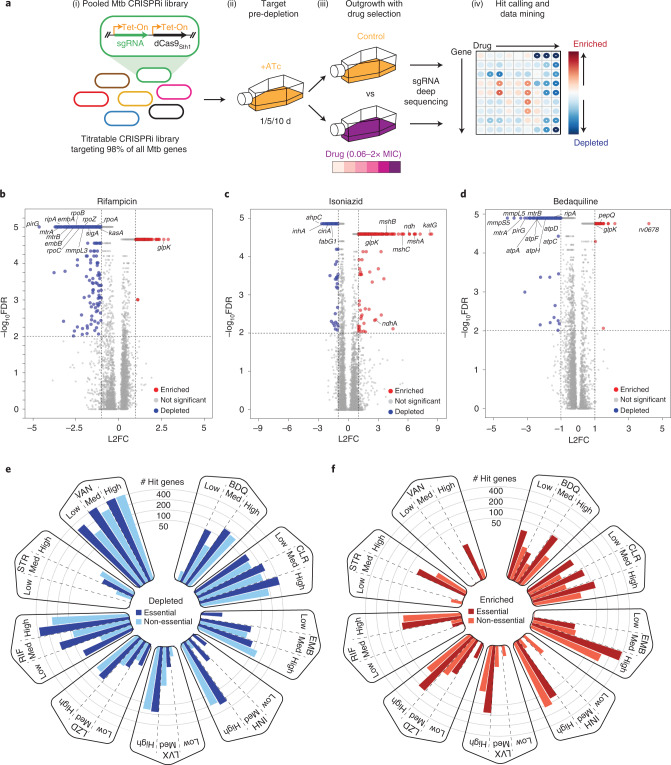
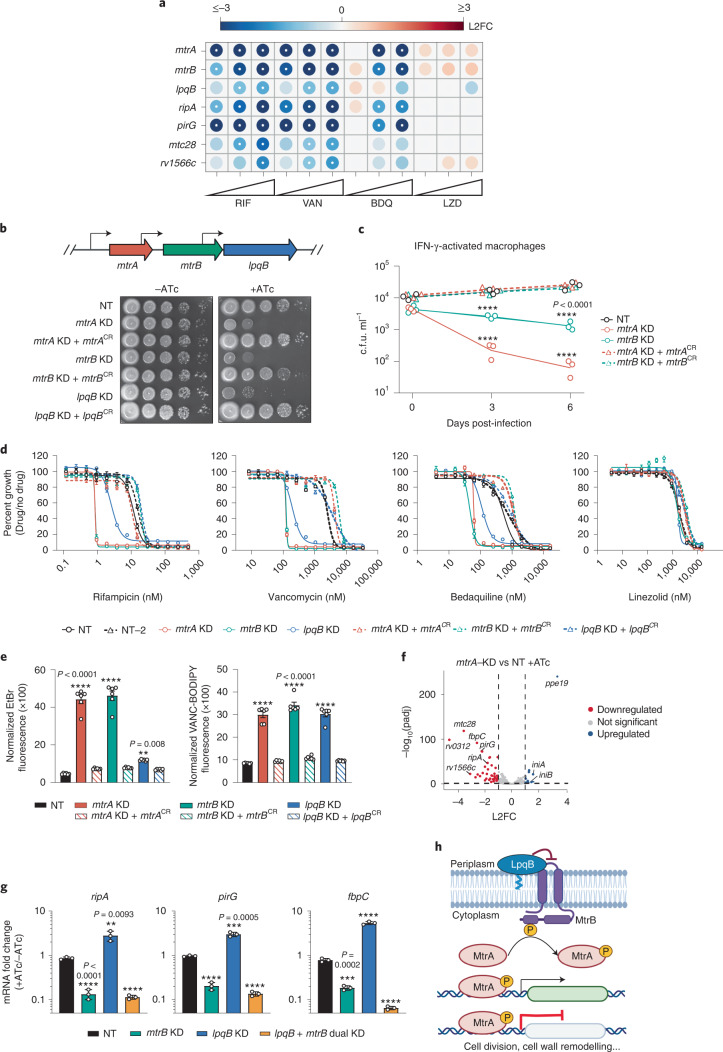
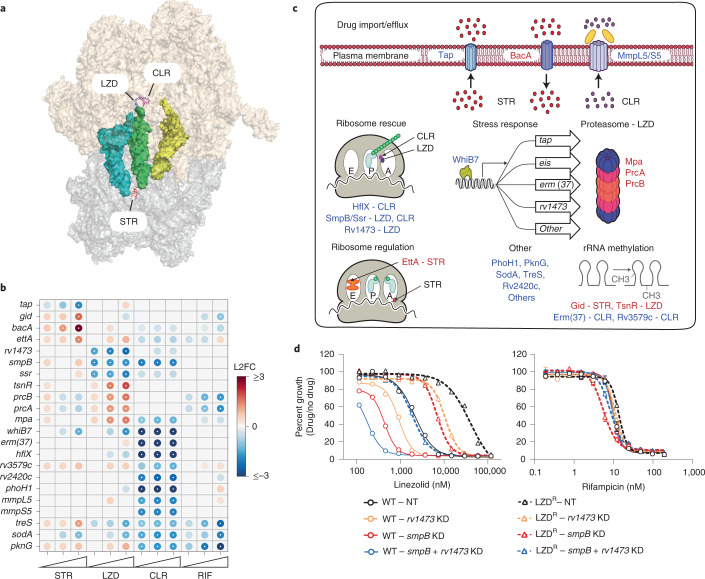
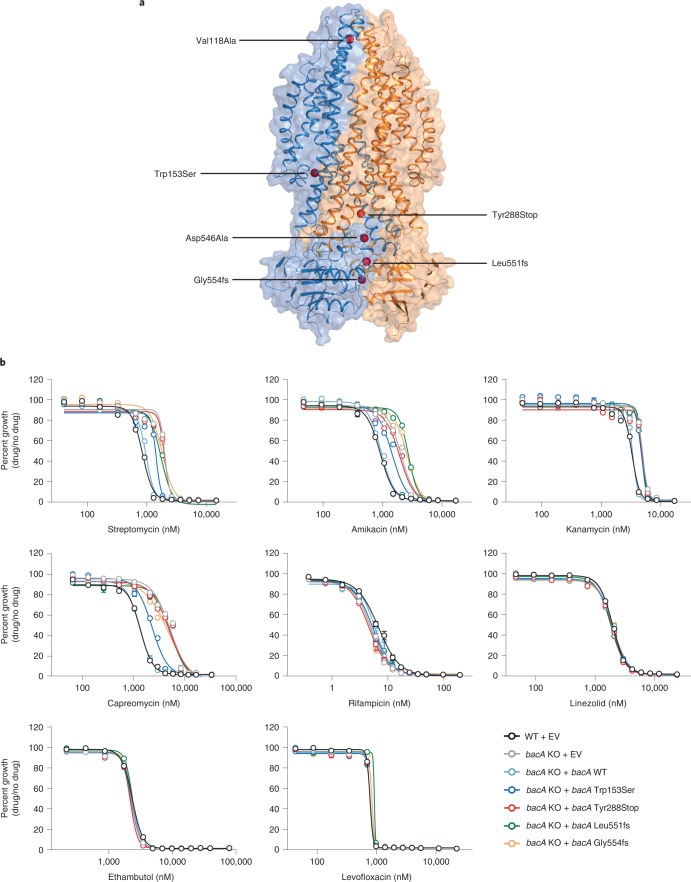
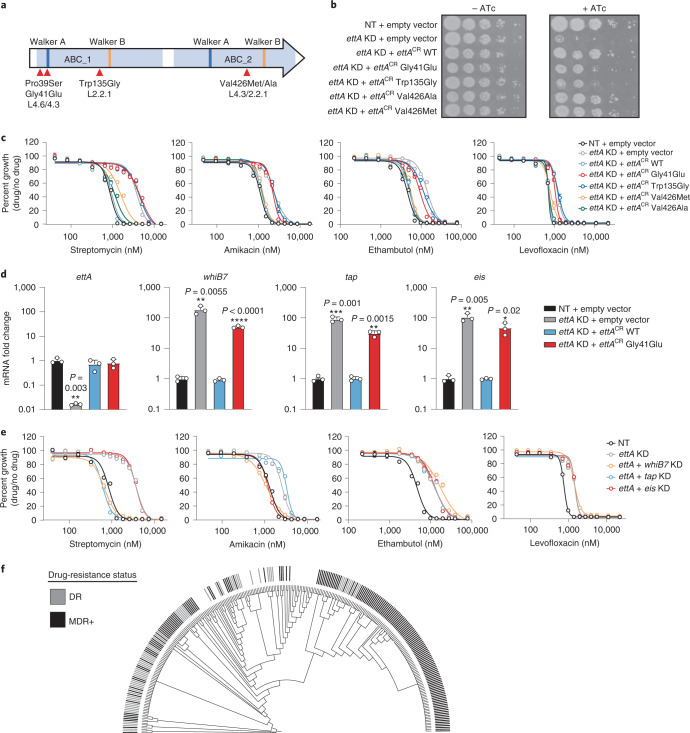
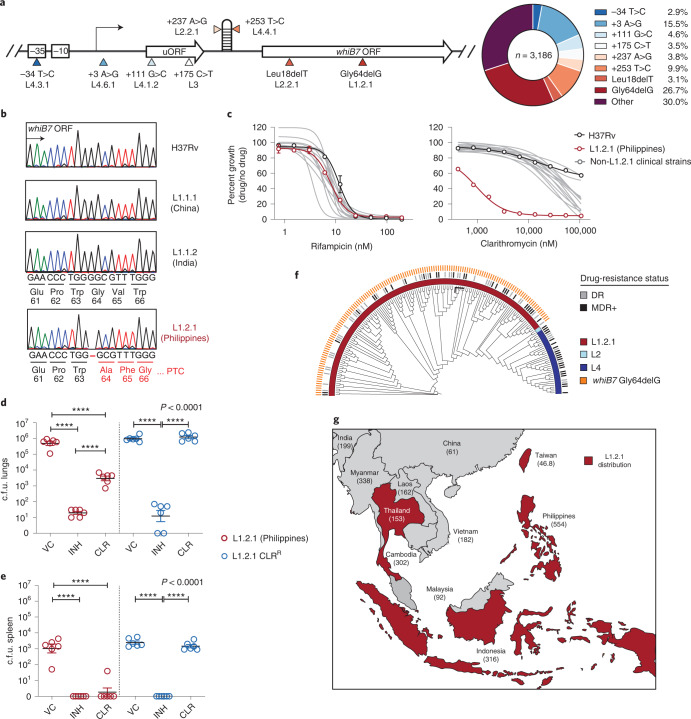
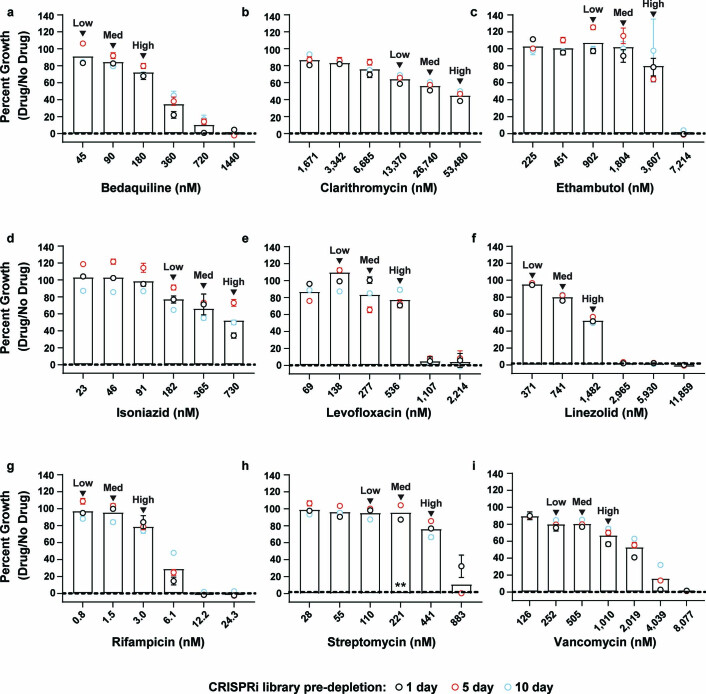
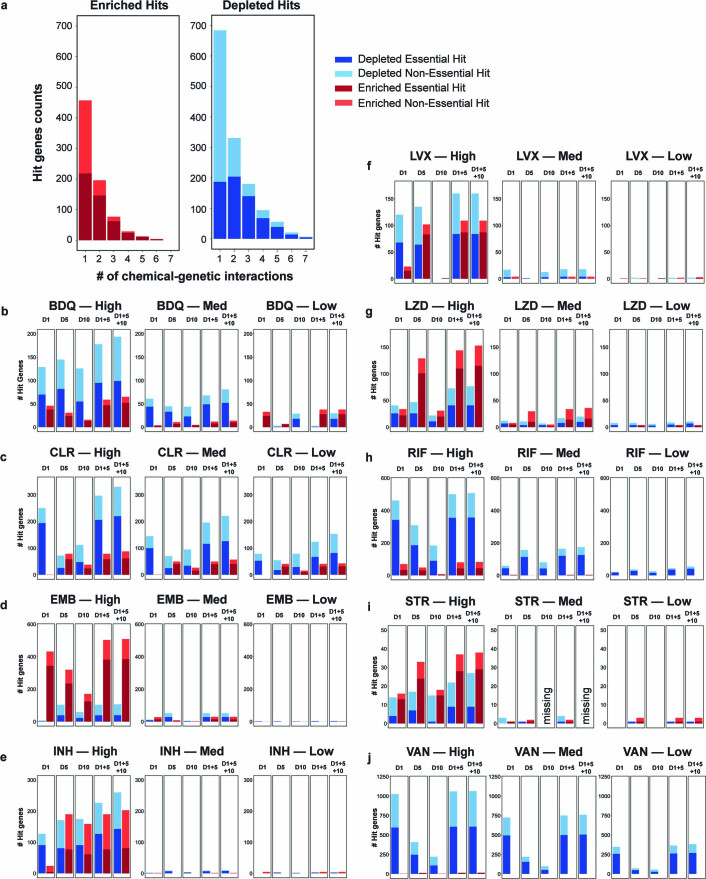
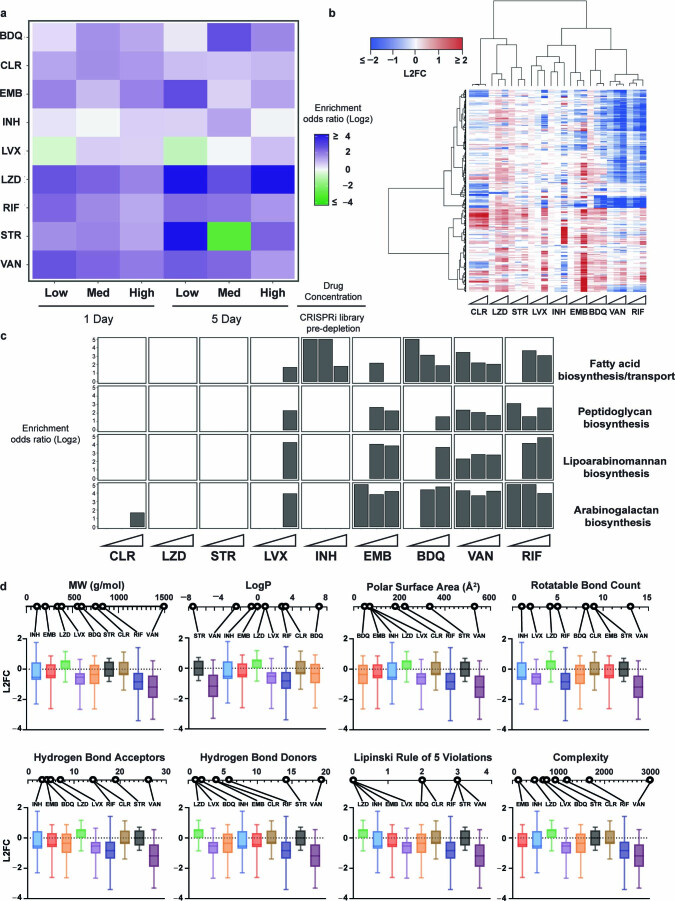
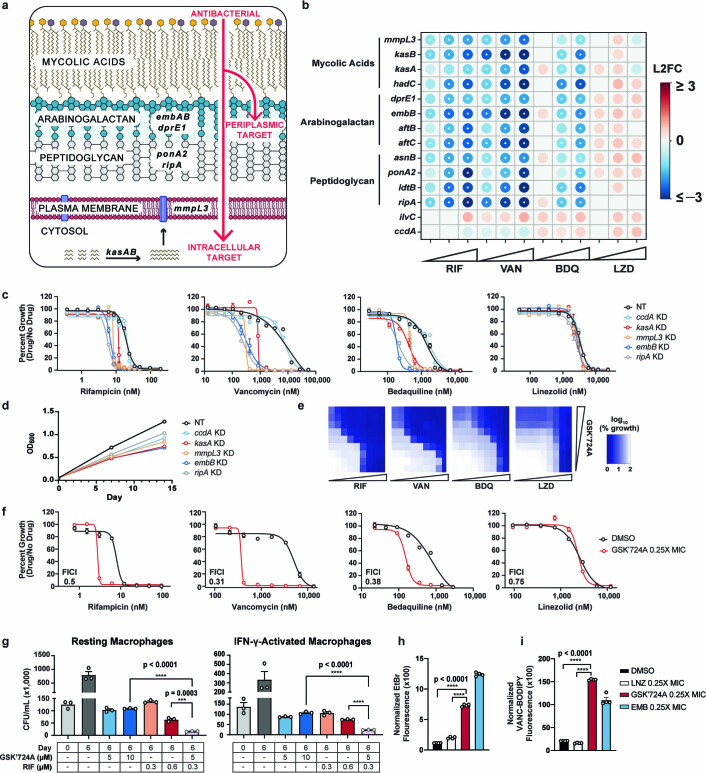
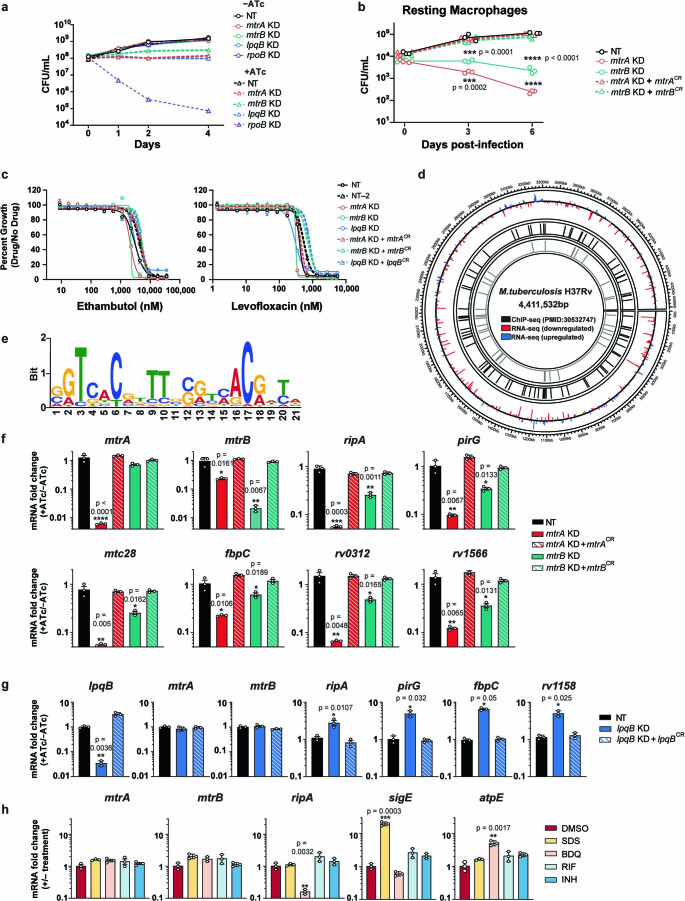
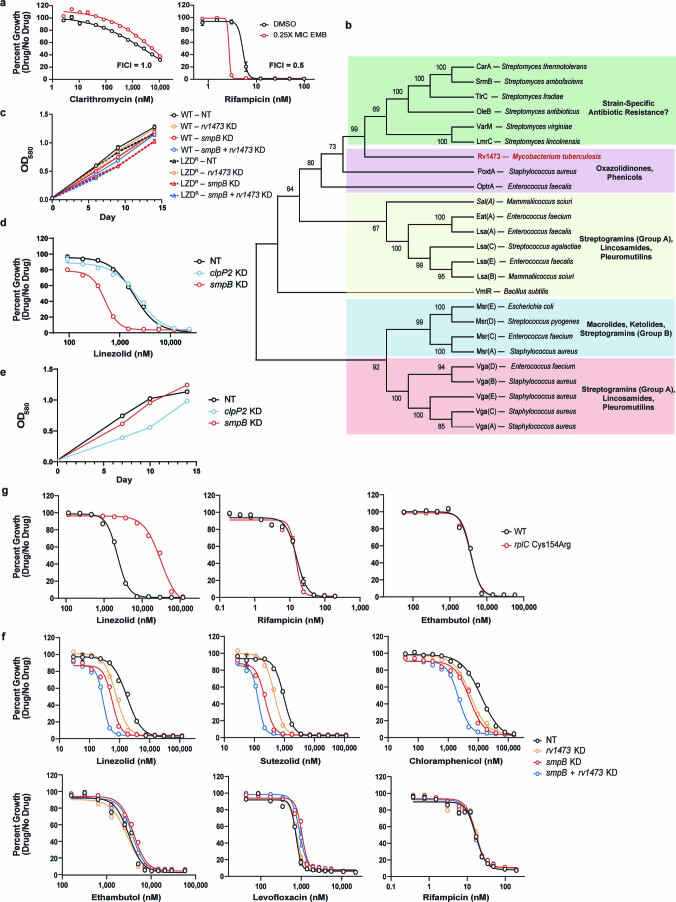
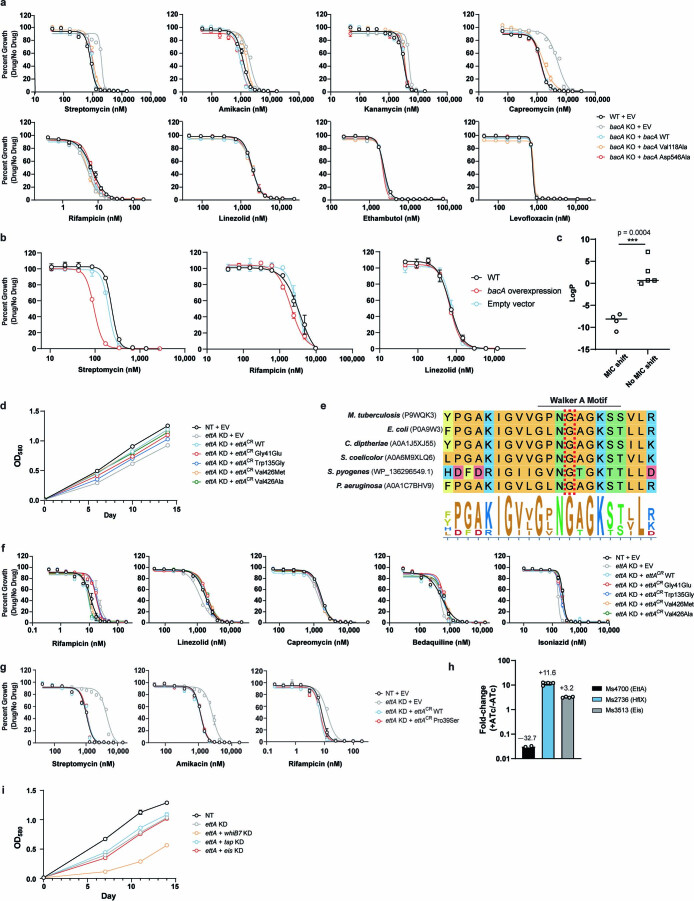
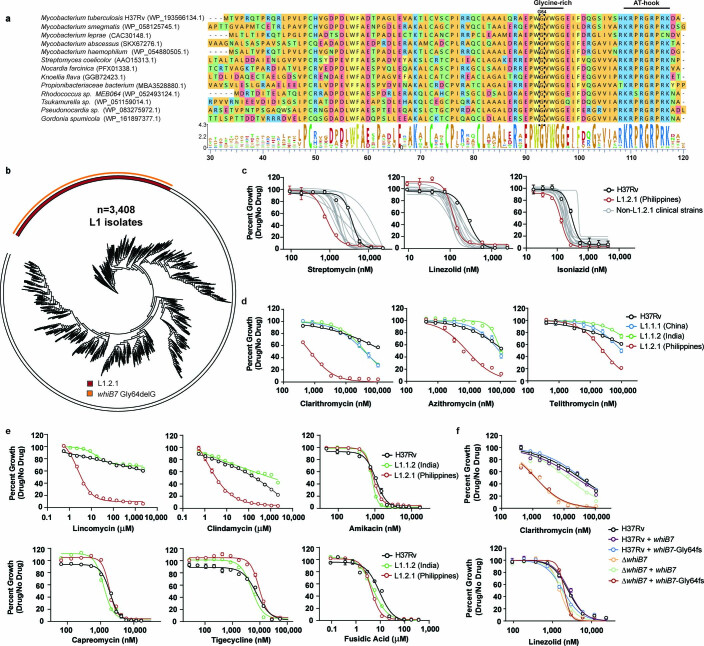
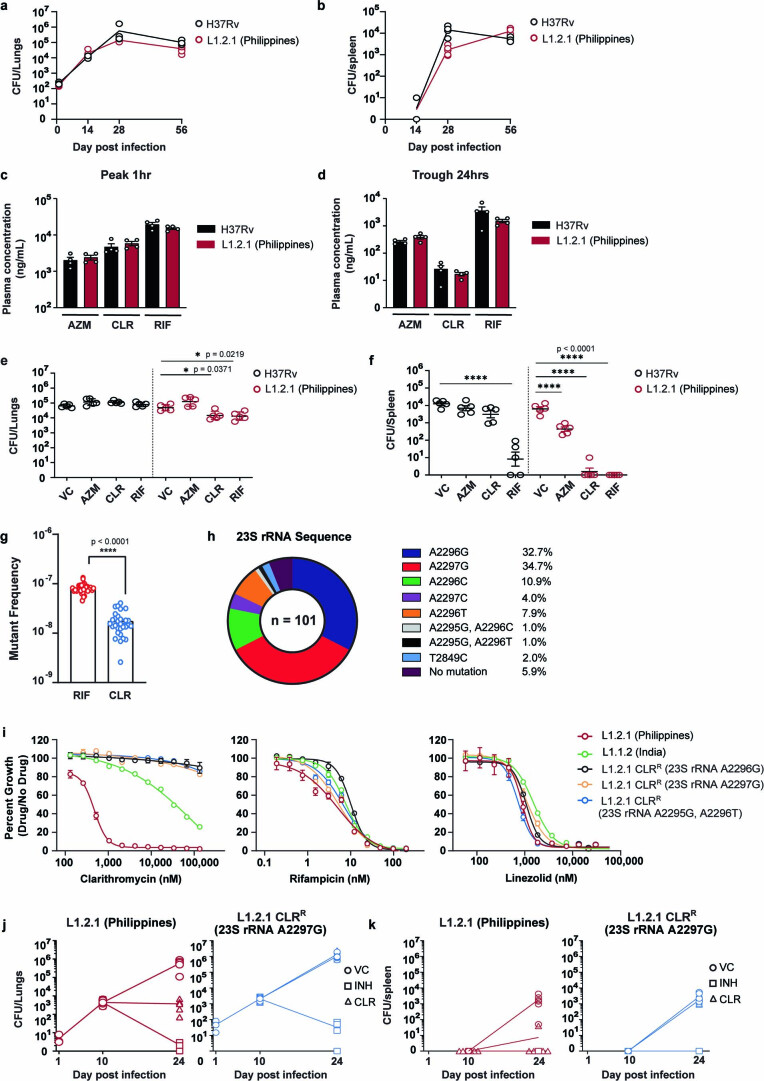
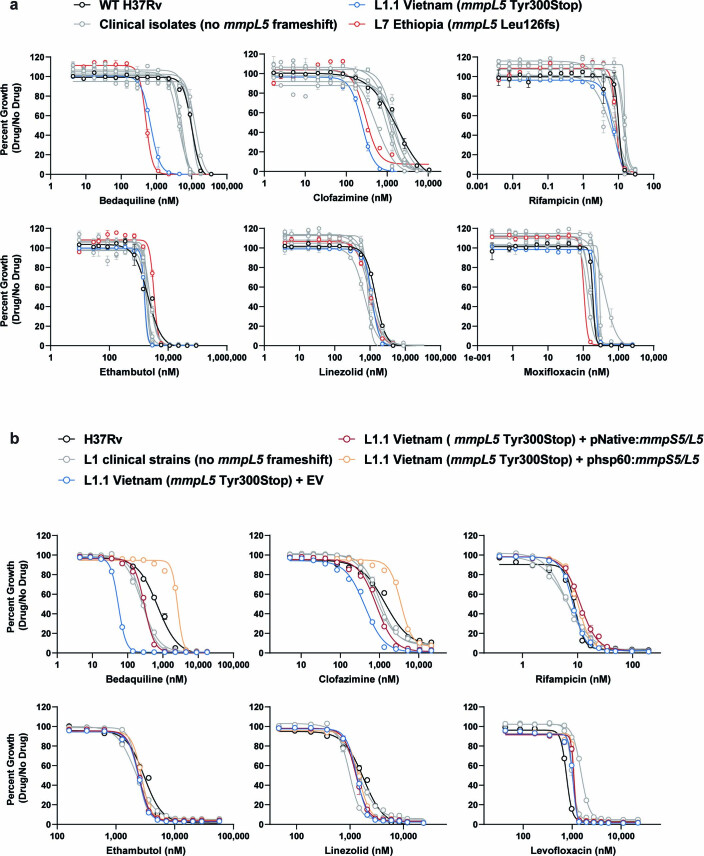
Mycobacterium tuberculosis (Mtb) infection is notoriously difficult to treat. Treatment efficacy is limited by Mtb's intrinsic drug resistance, as well as its ability to evolve acquired resistance to all antituberculars in clinical use. A deeper understanding of the bacterial pathways that influence drug efficacy could facilitate the development of more effective therapies, identify new mechanisms of acquired resistance, and reveal overlooked therapeutic opportunities. Here we developed a CRISPR interference chemical-genetics platform to titrate the expression of Mtb genes and quantify bacterial fitness in the presence of different drugs. We discovered diverse mechanisms of intrinsic drug resistance, unveiling hundreds of potential targets for synergistic drug combinations. Combining chemical genetics with comparative genomics of Mtb clinical isolates, we further identified several previously unknown mechanisms of acquired drug resistance, one of which is associated with a multidrug-resistant tuberculosis outbreak in South America. Lastly, we found that the intrinsic resistance factor whiB7 was inactivated in an entire Mtb sublineage endemic to Southeast Asia, presenting an opportunity to potentially repurpose the macrolide antibiotic clarithromycin to treat tuberculosis. This chemical-genetic map provides a rich resource to understand drug efficacy in Mtb and guide future tuberculosis drug development and treatment.


Conflict of interest statement

All authors declare no competing interests.

Figures

Fig. 1
Fig. 1. Chemical-genetic profiling identifies hundreds of genes that influence drug efficacy in M. tuberculosis.
a, Quantifying chemical-genetic interactions in Mtb. (i) The pooled CRISPRi library contains 96,700 sgRNAs targeting 4,052/4,125 Mtb genes. In vitro essential genes were targeted for titratable knockdown by varying the targeted PAM and sgRNA targeting sequence length; non-essential genes were targeted only with the strong sgRNAs. (ii) The CRISPRi inducer ATc was added for 1, 5 or 10 d before drug exposure to pre-deplete target gene products. (iii) Triplicate cultures were outgrown +ATc in DMSO or drug at concentrations spanning the predicted MIC. (iv) Following outgrowth, genomic DNA was collected from cultures treated with three descending doses of partially inhibitory drug concentrations (‘High’, ‘Med’ and ‘Low’; Extended Data Fig. 1), sgRNAs amplified for deep sequencing, and hit genes called with MAGeCK. Growth phenotypes were highly correlated among triplicate screens (average Pearson correlation between replicate screens: r > 0.99). bd, Volcano plots showing log2 fold change (L2FC) values and false discovery rates (FDR) for each gene for the indicated drugs (‘High’ concentration, 1 d CRISPRi library pre-depletion for RIF and 5 d for INH and BDQ). e,f, The number of significantly depleted and enriched hit genes (FDR < 0.01, |L2FC| > 1) are shown for the indicated drugs. Hit genes were defined as the union of 1 and 5 d target pre-depletion screens because these datasets recovered the majority (>95%) of unique hits (Extended Data Fig. 2). Gene essentiality was defined by CRISPRi. Source data
Fig. 2
Fig. 2. The response regulator MtrA promotes envelope integrity and intrinsic drug resistance.
a, Heatmap depicting chemical-genetic interactions from the 5 d CRISPRi library pre-depletion screen. The colour of each circle represents the gene-level L2FC. The white dot represents FDR < 0.01 and |L2FC| > 1. b, Growth was monitored by spotting serial dilutions of each strain on the indicated media. NT, non-targeting sgRNA; KD, knockdown; CR, CRISPRi-resistant. Transcriptional start sites are indicated with black arrows. c, Growth (mean ± s.e.m., 3 biological replicates) of CRISPRi strains in IFN-γ-activated murine bone marrow-derived macrophages. Significance was determined by two-way analysis of variance (ANOVA) and adjusted for multiple comparisons. ****P < 0.0001. d, Dose-response curves (mean ± s.e.m., n = 3 biological replicates) for the indicated strains. e, Ethidium bromide and Vancomycin-BODIPY uptake (mean ± s.e.m., n = 4 biological replicates) of the indicated strains. Results from an unpaired t-test are shown; ****P < 0.0001. f, mtrA and NT CRISPRi strains were grown for 2 d with ATc, after which RNA was collected and sequenced. Dashed lines mark significant hit genes (–log10(Padj) < 0.05 and |L2FC| > 1). g, Quantification (mean ± s.e.m., n = 3 biological replicates) of gene mRNA levels by RT-qPCR. Strains were grown ±ATc for ~3 generations before collecting RNA. Results from an unpaired t-test are shown; **P < 0.01, ***P < 0.001, ****P < 0.0001. h, Schematic of the proposed MtrAB-LpqB signalling system. Created with BioRender.com. Source data
Fig. 3
Fig. 3. Diverse pathways contribute to intrinsic resistance and susceptibility to ribosome-targeting antibiotics.
a, Structure of LZD, CLR and STR bound to the Thermus thermophilus ribosome. PDB codes: 3DLL, 1J5A, 1FJG, 4V5C. b, Heatmap depicting chemical-genetic interactions as in Fig. 2a. c, Chemical-genetic hit genes from Fig. 3b are involved in diverse cellular pathways. Genes whose inhibition decreased or increased fitness in the indicated drug are listed in blue or red, respectively. d, Dose-response curves (mean ± s.e.m., n = 3 biological replicates) for the indicated CRISPRi strains in H37Rv or rplC-Cys154Arg linezolid-resistant H37Rv (LZDR). Source data
Fig. 4
Fig. 4. Loss-of-function mutations in bacA confer acquired drug resistance to aminoglycosides and capreomycin.
a, BacA structure (PDB: 6TQF). Red spheres mark sites of experimentally tested bacA SNPs and frameshift (fs) causing indels from clinical Mtb strains. b, Dose-response curves (mean ± s.e.m., n = 3 biological replicates) of Mtb strains harbouring bacA mutations. KO, knockout; EV, empty complementation vector. Source data
Fig. 5
Fig. 5. Mutations in the translation factor EttA constitutively upregulate the whiB7 stress response and confer low-level, acquired multidrug resistance.
a, EttA domain organization. ABC domains, Walker A and Walker B motifs are highlighted in light blue, dark blue and orange, respectively. SNPs tested are highlighted with red arrows. b, Growth was monitored by spotting serial dilutions of each strain on the indicated media. The ettA CRISPRi strain was complemented with an empty vector or CRISPRi-resistant alleles harbouring the indicated ettA SNPs. c, Dose-response curves (mean ± s.e.m., n = 3 biological replicates) for strains harbouring ettA SNPs. d, Quantification (mean ± s.e.m., n = 3 biological replicates) of gene mRNA levels by RT-qPCR. Strains were grown +ATc for ~5 generations before collecting RNA. Statistical significance was calculated with Student’s t-test; *P < 0.05, **P < 0.01, ***P < 0.001, ****P < 0.0001. e, Dose-response curves (mean ± s.e.m., n = 3 biological replicates) for ettA single and dual knockdown strains. f, Phylogenetic tree of 291 Mtb clinical strains harbouring the ettA-Gly41Glu variant (Source Data Fig. 5). Genotypically predicted drug-resistance status is shown. DR, resistance-conferring mutations to rifampicin, isoniazid, pyrazinamide or ethambutol present; MDR+, resistance-conferring mutations to a minimum of rifampicin and isoniazid. Source data
Fig. 6
Fig. 6. A loss-of-function mutation in whiB7 renders an endemic Indo-Oceanic Mtb lineage hypersusceptible to macrolides.
a, Diagram of Mtb whiB7 with the eight most common whiB7 variants observed in our clinical strain genome database. Pie chart depicts the observed frequencies of each variant. L, dominant lineage in which variant is observed. b, Sanger sequencing of whiB7 from the indicated Mtb clinical strains and their country of origin. PTC, premature termination codon. The colour of each peak represents the base at the indicated position (black, G; green, A; red, T; blue, C). c, Dose-response curves (mean ± s.e.m., n = 3 biological replicates) were measured for a reference set of Mtb clinical and lab strains. d,e, Lung (d) and spleen (e) Mtb c.f.u. (mean ± s.e.m.) in BALB/c mice after 24 d of INH (25 mg kg1) or CLR (200 mg kg−1) treatment. Statistical significance was assessed by one-way ANOVA followed by Tukey’s post-hoc test. VC, vehicle control; CLRR, clarithromycin-resistant (23S rRNA A2297G). Black line, median. n = 6 mice per group/condition. f, Phylogenetic tree of 178 Mtb clinical strains isolated during the 2012 nationwide drug resistance survey in the Philippines (Source Data Fig. 6). The presence of the whiB7 Gly64delG mutation and genotypically predicted drug-resistance status are shown as in Fig. 5f. g, Map showing L1.2.1 distribution in Southeast Asia and TB incidence rates of each country. Source data
Extended Data Fig. 1
Extended Data Fig. 1. Growth of the Mtb CRISPRi library during drug selection.
a-i, Normalized growth (mean ± SEM, n = 3 biological replicates) of the Mtb CRISPRi library in the drug screens. Samples harvested for sgRNA deep sequencing are marked as “High”, “Med”, and “Low”, denoting the three descending doses of partially inhibitory drug concentrations analyzed in these screens. **: 10-day sample was lost for the 221 nM (“Med”) streptomycin screen. One biological replicate was lost for the 1,804 nM (“Med”) EMB 1-day screen; to obtain three replicate samples, one biological replicate was prepared in technical duplicate.
Extended Data Fig. 2
Extended Data Fig. 2. Summary of hits from chemical-genetic screens.
a, Histogram depicting the number of unique chemical-genetic interactions for enriching and depleting hits. Hit genes were defined as the union of 1 and 5-day CRISPRi library pre-depletion results. b-j, Bar graphs showing the number of hit genes identified across all drugs. Gene essentiality calls were defined by CRISPRi. D1, D5, and D10 indicate the number of days the CRISPRi library was treated with ATc prior to drug exposure; D1 + 5 = hit genes defined as the union of 1 and 5-day CRISPRi library pre-depletion results; D1 + 5 + 10: hit genes defined as the union of 1, 5 and 10 day CRISPRi library pre-depletion results. The 10-day sample was lost for the “Med” streptomycin screen and thus the D10 containing results for “STR–Med” are labelled “missing”. BDQ = bedaquiline; CLR = clarithromycin; EMB = ethambutol; INH = isoniazid; LVX = levofloxacin; LZD = linezolid; RIF = rifampicin, STR = streptomycin; VAN = vancomycin.
Extended Data Fig. 3
Extended Data Fig. 3. Clustering & enrichment analysis of chemical-genetic profiles.
a, Heatmap of odds-ratios showing enrichment of essential gene targeting sgRNAs as hits in the chemical-genetic screen. A Fisher’s exact test was used to evaluate enrichment of essential gene targeting sgRNAs relative to non-essential gene targeting sgRNAs amongst hit genes (FDR < 0.01, |L2FC | > 1) in the chemical genetic screen. BDQ = bedaquiline; CLR = clarithromycin; EMB = ethambutol; INH = isoniazid; LVX = levofloxacin; LZD = linezolid; RIF = rifampicin, STR = streptomycin; VAN = vancomycin. b, Heatmap showing clustered chemical-genetic profiles from the 5-day CRISPRi library pre-depletion screen. Genes are clustered along the vertical axis; for simplicity, only genes that hit in at least two drug conditions are shown (n = 676 genes). Ascending drug concentrations (“Low”, “Med”, “High” indicated by white triangles) are clustered along the horizontal axis. The median L2FC for each gene following drug selection (relative to vehicle control) is indicated on the color scale. If a gene was not a significant hit (FDR > 0.01), the L2FC value was plotted as 0 for the corresponding condition. c, Bar plots of the enriched (P < 0.05) KEGG categories for hit genes for the indicated drugs. KEGG annotations were manually updated to include the mycolic acid-arabinogalactan-peptidoglycan (mAGP) complex-associated genes described in,. d, Correlation of mAGP signature and drug physiochemical properties. For each drug, the L2FC distribution (“High” concentration, 5-day CRISPRi library pre-depletion) is shown for a select group of 78 genes involved in mAGP assembly and regulation as described in,. L2FC values (mean ± SEM, n = 3 biological replicates) for the 78 genes under each drug treatment are shown. For each condition, the box indicates the lower quartile, median, and upper quartile and whiskers represent the minimum and maximum L2FC values. Source data
Extended Data Fig. 4
Extended Data Fig. 4. The Mtb envelope mediates intrinsic resistance to a subset of drugs.
a, Diagram of the mycobacterial mAGP complex. Select genes involved in mycolic acid synthesis and transport (kasAB, mmpL3), arabinogalactan biosynthesis (embAB, dprE1), and peptidoglycan remodeling (ponA2, ripA) are highlighted. b, Heatmap of chemical-genetic hit genes from the 5-day CRISPRi library pre-depletion screen. The color of each circle represents the gene-level L2FC. A white dot represents an FDR < 0.01 and a | L2FC | > 1. ilvC and ccdA are included as non-hit controls. c,d, Single strain validation of mAGP-associated hits. Dose-response curves (c, mean ± SEM, n = 3 biological replicates) for the indicated hypomorphic CRISPRi strains. Growth curves (d, mean ± SEM, n = 3 biological replicates) are derived from the vehicle control samples. NT = non-targeting; KD = knockdown. e,f, KasA inhibitor (GSK’724 A) checkerboard assays to quantify drug-drug interactions. Dose-response curves (f, mean ± SEM, n = 3 biological replicates) are shown for each drug in the absence (DMSO) or presence of 0.25X MIC80 GSK’724 A. The fractional inhibitory concentration index (FICI) values listed represent the lowest value obtained from each checkerboard assay. g, GSK’724 A synergy with rifampicin in resting and IFN-γ-activated murine bone marrow derived macrophages (mean CFU/ml ± SEM, n = 3 biological replicates). Results from an unpaired, two-tailed t-test are shown. h,i, Ethidium bromide (h) and Vancomycin-BODIPY (i) uptake (mean ± SEM, n = 4 biological replicates) of H37Rv pre-treated for two days with DMSO or subinhibitory linezolid, GSK’724 A, or ethambutol. Results from an unpaired, two-tailed t-test are shown.
Extended Data Fig. 5
Extended Data Fig. 5. The MtrA response regulator is critical for multidrug intrinsic resistance.
a, Time-kill curves (mean ± SEM, n = 3 biological replicates) for the indicated CRISPRi strains. NT = non-targeting; KD = knockdown; CR = CRISPRi-resistant. b, Growth (mean ± SEM, n = 3 biological replicates) of the indicated CRISPRi strains in resting murine bone marrow derived macrophages. Significance was determined by two-way ANOVA and adjusted for multiple comparisons. ***, p < 0.001; ****, p < 0.0001. c, Dose-response curves (mean ± SEM, n = 3 biological replicates) for the indicated strains. d, Circos plot depicting overlapping genes identified by RNA-seq (Fig. 2f) and MtrA ChIP-seq. Outer track: the H37Rv genome by nucleotide position; middle track: lines mark genes with significant L2FC values (padj < 0.05) upon mtrA knockdown (blue = positive L2FC; red = negative L2FC); inner tracks: black lines mark genes defined as interacting with MtrA by ChIP-seq, and grey lines highlight genes which display both a significant expression change (padj < 0.05; |L2FC | > 1) by mtrA RNAseq and are found to interact with MtrA by ChIP-seq. e, Identification of an MtrA consensus binding motif. MEME analysis was performed on the promoter regions of candidate genes found to be downregulated upon mtrA silencing and bound by MtrA by ChIP-seq (n = 25 genes). f,g, Quantification (mean ± SEM, n = 3 biological replicates) of gene mRNA levels by qRT-PCR. Strains were grown + /– ATc for ~3 generations prior to harvesting RNA. Statistical significance was calculated as p-value with unpaired t-test. *, p < 0.05; **, p < 0.01; ***, p < 0.001. h, Quantification (mean ± SEM, n = 3 biological replicates) of gene mRNA levels by qRT-PCR. Wild-type H37Rv was grown in the presence of the indicated stress (RIF/BDQ/INH: 4X IC50, SDS: 0.2%, DMSO: 0.5%) for 3 hours prior to harvesting RNA. Statistical significance was calculated as p-value with unpaired T-test. ***, p < 0.001.
Extended Data Fig. 6
Extended Data Fig. 6. Mtb encodes diverse mechanisms of intrinsic resistance to ribosome-targeting antibiotics.
a, Ethambutol checkerboard assays to quantify drug-drug interactions. Dose-response curves (mean ± SEM, n = 3 biological replicates) are shown for each drug in the absence (DMSO) or presence of 0.25X MIC80 of EMB. Fractional inhibitory concentration index (FICI) values listed represent the lowest value obtained from each checkerboard assay. b, Phylogenetic tree of antibiotic resistance (ARE) ABC-F proteins from the indicated species. Figure adapted from Bootstrap values (500 replicates) are indicated at each node. c, Growth curves for the linezolid-associated hit genes and control strains shown in Fig. 3d. Curves (mean ± SEM, n = 3 biological replicates) are derived from the vehicle control samples of the MIC assay. NT = non-targeting; KD = knockdown. d, Dose-response curves (mean ± SEM, n = 3 biological replicates) were measured for CRISPRi knockdown strains targeting smpB and clpP2 in wild-type H37Rv. e, Growth curves for the strains shown in panel (d). Curves (mean ± SEM, n = 3 biological replicates) are derived from the vehicle control samples of the MIC assay. f, Dose-response curves (mean ± SEM, n = 6 biological replicates) of WT H37Rv and an isogenic rplC-Cys154Arg mutant. g, Dose-response curves (mean ± SEM, n = 3 biological replicates) for the indicated CRISPRi strains.
Extended Data Fig. 7
Extended Data Fig. 7. Loss-of-function mutations in bacA and ettA confer acquired drug resistance.
a, Dose-response curves (mean ± SEM, n = 3 biological replicates) show that the Val118Ala and Asp546Ala mutations in bacA do not confer drug resistance. KO = knockout; EV = empty complementation vector. b, Overexpression of Mtb bacA confers streptomycin sensitivity in M. smegmatis. Dose-response curves (mean ± SEM, n = 3 biological replicates) for the indicated strains. c, LogP values for the antibiotics to which bacA mutants show an increased MIC (streptomycin, amikacin, capreomycin, kanamycin) or no MIC change (rifampicin, ethambutol, levofloxacin, linezolid). Results from an unpaired t-test are shown: ***, p < 0.001. d, Growth curves for the strains shown in Fig. 5c. Curves (mean ± SEM, n = 3 biological replicates) are derived from the vehicle control samples of the MIC assay. KD = knockdown. e, Sequence alignment for EttA orthologs from the indicated species for the region surrounding the N-terminal Walker A motif. The Mtb EttA Gly41 residue is boxed. Accession numbers are listed next to each species. f, Dose-response curves (mean ± SEM, n = 3 biological replicates) for the strains shown in Fig. 5c.g, Dose-response curves (mean ± SEM, n = 3 biological replicates) show that the Pro39Ser mutation in ettA does not confer drug resistance. h, Quantitative mass spectrometry results following CRISPRi knockdown of ms4700 (described in). Data represent protein level fold-change (mean ± SEM, n = 4 technical replicates derived from 2 biological replicates). Ms4700 could only be detected in two +ATc replicates and thus the mean ± SEM for duplicates is shown. i, Growth curves for the strains shown in Fig. 5e. Curves (mean ± SEM, n = 3 biological replicates) are derived from the vehicle control samples of the MIC assay. Source data
Extended Data Fig. 8
Extended Data Fig. 8. L1.2.1 is a whiB7 loss-of-function mutant and hypersusceptible to macrolides, ketolides, and lincosamides.
a, Alignment of WhiB7 orthologues from representative actinobacteria. Accession numbers are listed next to each species. The conserved glycine-rich motif and DNA binding AT-hook element are highlighted. b, Phylogenetic tree of all L1 Mtb clinical isolates (n = 3,408) in our genome database (Source Data Fig. 4). L1.2.1 and the whiB7 Gly64delG mutation are highlighted. c-e, Dose-response curves (mean ± SEM, n = 3 biological replicates) for a reference set of Mtb clinical strains. f, H37Rv or a ΔwhiB7 H37Rv strain were transformed with an integrating plasmid to express either the H37Rv whiB7 allele or the L1.2.1 whiB7 Gly64delG allele in trans from its native promoter. Dose-response curves (mean ± SEM, n = 3 biological replicates) for the resulting strains are shown. Source data
Extended Data Fig. 9
Extended Data Fig. 9. L1.2.1 is susceptible to clarithromycin in vivo.
a,b, Growth of H37Rv and L1.2.1 in vivo. BALB/c mice were infected with approximately 100-200 c.f.u. by aerosol. Mtb burden (mean c.f.u. ± SEM) in lungs (a) and spleens (b) was determined at the indicated timepoints. Data represent 3 mice at D0 (lung only), 5 mice at D14 and D28, and 6 mice at D56. c,d, Plasma drug concentrations (mean ± SD for 4 mice) after 2 weeks of drug therapy. Blood was collected at 1 h (c) and 24 h (d) post-dose after 13 daily doses from vehicle control (VC) and treatment groups further described in (e,f). Drug concentrations were measured in plasma using high pressure liquid chromatography coupled to tandem mass spectrometry. AZM = azithromycin; CLR = clarithromycin; RIF = rifampicin. e,f, Lung (e) and spleen (f) Mtb burden (mean c.f.u. ± SEM, n = 5 mice) in BALB/c mice after azithromycin (200 mg/kg), clarithromycin (200 mg/kg), or rifampicin (25 mg/kg) treatment. Mice were infected with approximately 100-200 c.f.u. of aerosolized Mtb. After two weeks to allow the acute infection to establish, chemotherapy was initiated. Following two weeks of drug therapy, Mtb bacterial load was determined. Statistical significance was assessed by one-way ANOVA followed by Tukey’s post-hoc test. *, p < 0.05; ****, p < 0.0001. g, Rifampicin and clarithromycin mutation frequency analysis with the L1.2.1 strain. Results from an unpaired, two-tailed student’s t-test are shown h, Distribution of 23 S rRNA mutations from in vitro-selected, clarithromycin-resistant L1.2.1 isolates from (g). i, Dose-response curves (mean ± SEM, n = 3 biological replicates) of representative CLR-resistant (CLRR) L1.2.1 isolates. j,k, Lung (j) and spleen (k) Mtb burden (mean c.f.u. ± SEM) in BALB/c mice after isoniazid (INH; 25 mg/kg) or clarithromycin (200 mg/kg) treatment. Mice were infected with approximately 100-200 c.f.u. of aerosolized Mtb. After ten days to allow the acute infection to establish, chemotherapy was initiated. Mtb bacterial load was determined at the indicated time points. Data represent 3 mice at D0 (lung only) and 6 mice at D10 and D24.
Extended Data Fig. 10
Extended Data Fig. 10. Some Mtb clinical strains have loss-of-function mmpL5 mutations that render them hypersensitive to bedaquiline and clofazimine.
Dose-response curves (mean ± SEM, n = 3 biological replicates) for a reference set of Mtb clinical strains. b, Dose-response curves (mean ± SEM, n = 3 biological replicates) for the listed Mtb strains. The L1.1 strain (mmpL5 Tyr300Stop) in panel a was transformed with an integrating plasmid expressing either an empty vector (EV) or the mmpS5 + mmpL5 operon driven by the endogenous (pNative) or hsp60 promoter.

Comment in

References

    1. Dartois V. The path of anti-tuberculosis drugs: from blood to lesions to mycobacterial cells. Nat. Rev. Microbiol. 2014;12:159–167. doi: 10.1038/nrmicro3200. - DOI - PMC - PubMed
    1. Balaban NQ, et al. Definitions and guidelines for research on antibiotic persistence. Nat. Rev. Microbiol. 2019;17:441–448. doi: 10.1038/s41579-019-0196-3. - DOI - PMC - PubMed
    1. Xu W, et al. Chemical genetic interaction profiling reveals determinants of intrinsic antibiotic resistance in Mycobacterium tuberculosis. Antimicrob. Chemother. 2017;61:e01334-17. doi: 10.1128/AAC.01334-17. - DOI - PMC - PubMed
    1. Colangeli R, et al. Bacterial factors that predict relapse after tuberculosis therapy. N. Engl. J. Med. 2018;379:823–833. doi: 10.1056/NEJMoa1715849. - DOI - PMC - PubMed
    1. da Silva PEA, von Groll A, Martin A, Palomino JC. Efflux as a mechanism for drug resistance in Mycobacterium tuberculosis. FEMS Immunol. Med. Microbiol. 2011;63:1–9. doi: 10.1111/j.1574-695X.2011.00831.x. - DOI - PubMed

Publication types

MeSH terms

Substances

LinkOut - more resources