. 2022 Jun;28(6):1207-1211.
doi: 10.1038/s41591-022-01793-4. Epub 2022 May 30.

In utero origin of myelofibrosis presenting in adult monozygotic twins

Affiliations

In utero origin of myelofibrosis presenting in adult monozygotic twins

Nikolaos Sousos et al. Nat Med. 2022 Jun.

Abstract

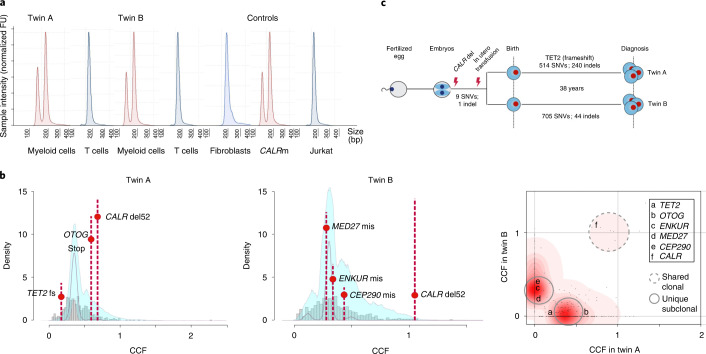
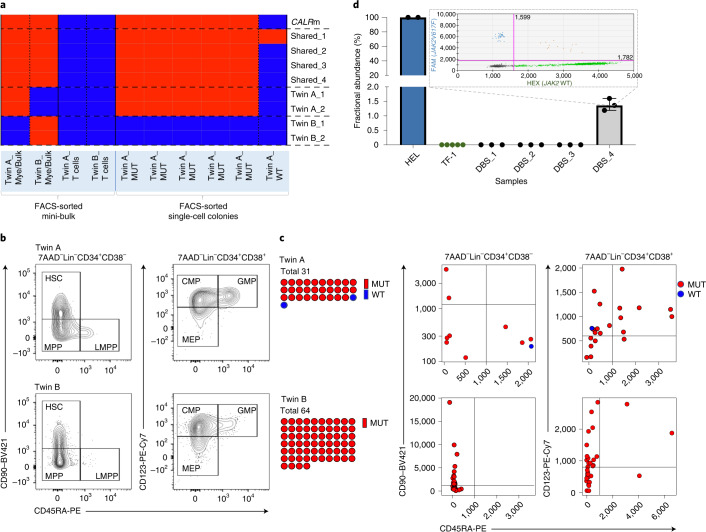
The latency between acquisition of an initiating somatic driver mutation by a single-cell and clinical presentation with cancer is largely unknown. We describe a remarkable case of monozygotic twins presenting with CALR mutation-positive myeloproliferative neoplasms (MPNs) (aged 37 and 38 years), with a clinical phenotype of primary myelofibrosis. The CALR mutation was absent in T cells and dermal fibroblasts, confirming somatic acquisition. Whole-genome sequencing lineage tracing revealed a common clonal origin of the CALR-mutant MPN clone, which occurred in utero followed by twin-to-twin transplacental transmission and subsequent similar disease latency. Index sorting and single-colony genotyping revealed phenotypic hematopoietic stem cells (HSCs) as the likely MPN-propagating cell. Furthermore, neonatal blood spot analysis confirmed in utero origin of the JAK2V617F mutation in a patient presenting with polycythemia vera (aged 34 years). These findings provide a unique window into the prolonged evolutionary dynamics of MPNs and fitness advantage exerted by MPN-associated driver mutations in HSCs.


Conflict of interest statement

The authors declare no competing interests.

Figures

Fig. 1
Fig. 1. Genetic lineage tracing confirms a common in utero clonal origin of CALR mutation.
a, Cell-lineage-specific CALR mutational analysis. T cell DNA electropherograms (blue) have a single peak at 207 bp, whereas DNA extracted from myeloid cells (red) shows two peaks, one at 207 bp and another one corresponding to the 52-bp deletion fragment (CALRdel52bp variant allele frequency (VAF) was calculated 28.4%, 32.6% and 43.7 for twin A, twin B and CALR type 1 myelofibrosis (CALRm) control, respectively). The absence of CALR 52-bp deletion in germline DNA was confirmed by analysis of dermal fibroblast DNA from twin B. DNA from a patient with known CALR type 1 myelofibrosis and DNA from Jurkat cells were used as positive and negative controls, respectively. Rearranged electropherograms from parallel experiments, all scaled to sample. FU, fluorescence units. b, Statistical modeling of the distribution of subclonal and clonal mutations by Dirichlet-process clustering. The histogram of mutations is represented with gray bars, with the fitted distribution as a gray line; 95% posterior confidence intervals for the fitted distribution are also shown (pale blue area). In the rightmost panel, a two-dimensional density plot shows Dirichlet clustering of the fraction of cancer cells (CCF) within each twin for all somatic mutations detected (black dots). Higher posterior probability of a cluster is indicated by increasing intensity of red. The cluster indicated around (1,1) corresponds to mutations present in all cells in both twins; clusters along the axes correspond to twin-specific clones. A subset of nonsilent coding mutations found in TET2, OTOG, ENKUR, MED27, CEP290 and CALR are highlighted. c, Schematic representation of the shared in utero clonal origin and number of high-confidence shared variants and separate postnatal clonal evolution with total number of SNV and indels for each twin shown. fs, frameshift; mis, missense.
Fig. 2
Fig. 2. Single-cell-derived colony CALR genotyping and neonatal blood spot analysis.
a, Orthogonal validation of the WGS results at the single-cell level. Somatic variants shared between the twins and somatic variants unique for twin A or twin B were assessed in DNA from fluorescence-activated cell sorting (FACS)-sorted single-HSPC colonies (from twin A) or mini-bulk populations using Sanger sequencing. The samples with presence of the studied variant are shown in red, whereas absence of the variant is shown in blue. Details of the tested variants are shown in Supplementary Table 6. b, Flow cytometry profiles of HSPCs for each of the twins. c, CALR genotyping of single-HSPC-derived colonies, integrated with index sorting data. d, Results of ddPCR analysis for the detection and quantification of JAK2V617F in DNA extracted from neonatal dried blood spots from patients diagnosed with JAK2-mutant myeloproliferative neoplasms as adults. In one out of three patients studied (DBS_4) JAK2V617F was detected in neonatal blood with a fractional abundance of 1.38% (three technical replicates in one experiment, independently validated by nested PCR). FAM channel-positive events on the y axis correspond to JAK2V617F positivity, and HEX channel-positive events on the x axis correspond to JAK2 WT events. JAK2V617F-positive DNA from HEL cells, and JAK2 wild-type DNA from TF-1 cells and a dried blood spot from a patient with systemic mastocytosis (DBS_1), were used as positive and negative controls, respectively. All results were independently validated by a nested PCR method. Bars and error bars show median and 95% confidence interval, respectively. Relevant clinical information for the patients studied is provided in Supplementary Table 7. CMP, common myeloid progenitor (LinCD34+CD38+CD123+CD45RA); GMP, granulocyte macrophage progenitor (LinCD34+CD38+CD123+CD45RA+); HSC, LinCD34+CD38CD90+CD45RA; LMPP, lymphoid-primed multipotent progenitor (LinCD34+CD38CD90CD45RA+); MEP, megakaryocyte-erythroid progenitor (LinCD34+CD38+CD123CD45RA); MPP, multipotent progenitor (LinCD34+CD38CD90CD45RA); MUT, mutated; Mye, myeloid; PE-Cy7, PE-cyanine7; WT, wild-type.
Extended Data Fig. 1
Extended Data Fig. 1. Blood film and bone marrow examination findings.
a,b, Leucoerythroblastic blood film of twin A (May-Grunwald-Giemsa stain; 100x). c, Bone marrow trephine examination from twin A at diagnosis (hematoxylin and eosin stain). Reticulin stain (d) showed diffuse fiber network with scattered coarse fibers (WHO MF-3) (reticulin stain). e,f, Leucoerythroblastic blood film of twin B (May-Grunwald-Giemsa stain; 100x). g, Bone marrow trephine examination from twin B (hematoxylin and eosin stain). Reticulin stain (h) revealed evidence of patchy, irregular fibrosis and a hypocellular marrow (reticulin stain).
Extended Data Fig. 2
Extended Data Fig. 2. Cell-lineage tracing of the CALR mutation.
a, Comparison of different sources of germline DNA for twin A. Automated electrophoresis for double-filtration CD3-enriched cell DNA is shown in dark blue, nail DNA in brown, single-filtration CD3-enriched cell DNA in light blue, while CD34-enriched cell DNA is shown in red. CALRdel52bp VAF was calculated 1.8%, 9.0%, 10.8%, and 37.1%, respectively. b, T cell purity assessment of the double-filtration CD3-enriched population by flow cytometry.
Extended Data Fig. 3
Extended Data Fig. 3. (a) Somatic point substitution and (b) indel spectra with corresponding mutational signatures for each of the twins.
We identified 514 and 705 somatic single-nucleotide variants (SNVs), 240 and 44 somatic indels, and 5 structural variants unique to twin A and twin B, respectively. Analysis of the somatic point substitution signatures revealed shared signatures with near identical contributions in twin A and B. Indel signatures differed markedly between the twins; ID1 and ID12 accounted for respectively 57% and 43% of indels in twin A, while all indels in twin B were attributable to ID9.
Extended Data Fig. 4
Extended Data Fig. 4. Genome-wide copy number profiles of twin A and twin B.
Copy number profiles of twin A and twin B estimated using the Battenberg algorithm. The gold line corresponds to total copy number, the dark blue line corresponds to copy number of the minor allele. Average ploidy was estimated to be 1.98 and 2.03 for twin A and twin B, respectively. Aberrant cell fraction (cellularity) was estimated as 100% and 92% for twin A and twin B, respectively.
Extended Data Fig. 5
Extended Data Fig. 5. Posterior interval estimates from Markov chain Monte Carlo draws for (a) time to the most recent common ancestor (MRCA) of myeloproliferative neoplasms in twin A and twin B and (b) mutation rate.
Posterior distributions with median (thick dark blue line) and 95% confidence interval (shaded blue area) for (a) MRCA timing and (b) mutation rate estimated using the numbers of somatic cytosine-to-thymine single-nucleotide variants (SNVs) at CpG sites (N[C>T]pG) in each twin. a. Time to MPN origin is estimated as years post-zygote (horizontal axis). b. Mutation rate is estimated as number of N[C>T]pG sites per genome per year (horizontal axis). N[C>T]pG mutation rate is truncated at an upper bound of 3 N[C>T]pG per genome per year; this bound was based on the highest N[C>T]pG rate reported in any Myeloid-MPN case in Gerstung et al..

References

    1. Mead AJ, Mullally A. Myeloproliferative neoplasm stem cells. Blood. 2017;129:1607–1616. doi: 10.1182/blood-2016-10-696005. - DOI - PMC - PubMed
    1. Mitchell TJ, et al. Timing the landmark events in the evolution of clear cell renal cell cancer: TRACERx Renal. Cell. 2018;173:611–623. doi: 10.1016/j.cell.2018.02.020. - DOI - PMC - PubMed
    1. Gerstung M, et al. The evolutionary history of 2,658 cancers. Nature. 2020;578:122–128. doi: 10.1038/s41586-019-1907-7. - DOI - PMC - PubMed
    1. Van Egeren D, et al. Reconstructing the lineage histories and differentiation trajectories of individual cancer cells in myeloproliferative Neoplasms. Cell Stem Cell. 2021;28:514–523.e519. doi: 10.1016/j.stem.2021.02.001. - DOI - PMC - PubMed
    1. Molenaar RJ, et al. Risk of developing chronic myeloid neoplasms in well-differentiated thyroid cancer patients treated with radioactive iodine. Leukemia. 2018;32:952–959. doi: 10.1038/leu.2017.323. - DOI - PubMed

Publication types