. 2022 Jul;18(7):751-761.
doi: 10.1038/s41589-022-01033-3. Epub 2022 May 30.

Ribosome stalling during selenoprotein translation exposes a ferroptosis vulnerability

Affiliations

Ribosome stalling during selenoprotein translation exposes a ferroptosis vulnerability

Zhipeng Li et al. Nat Chem Biol. 2022 Jul.

Abstract

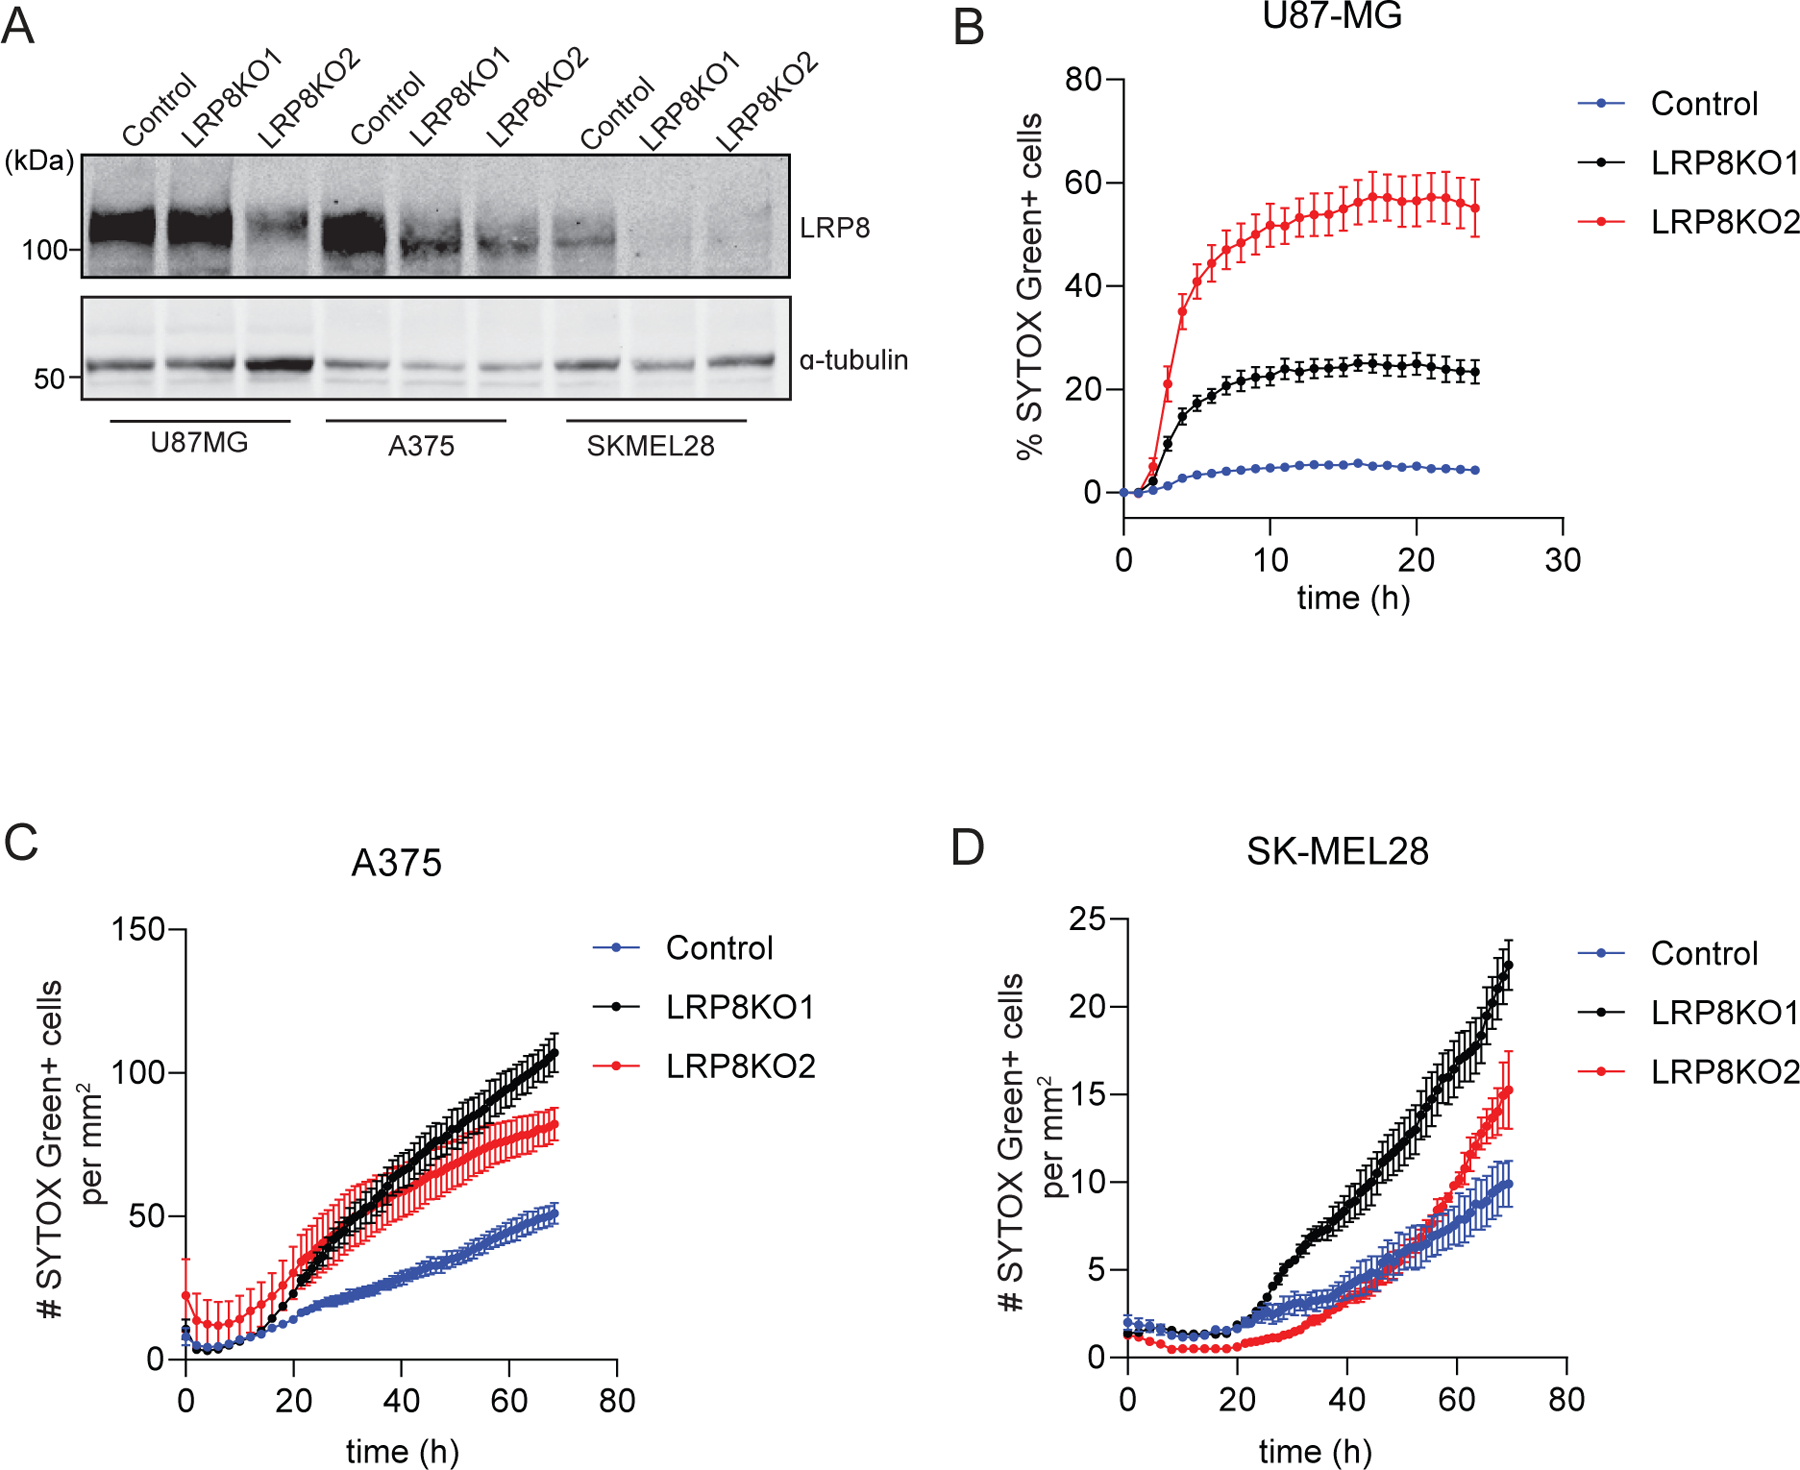
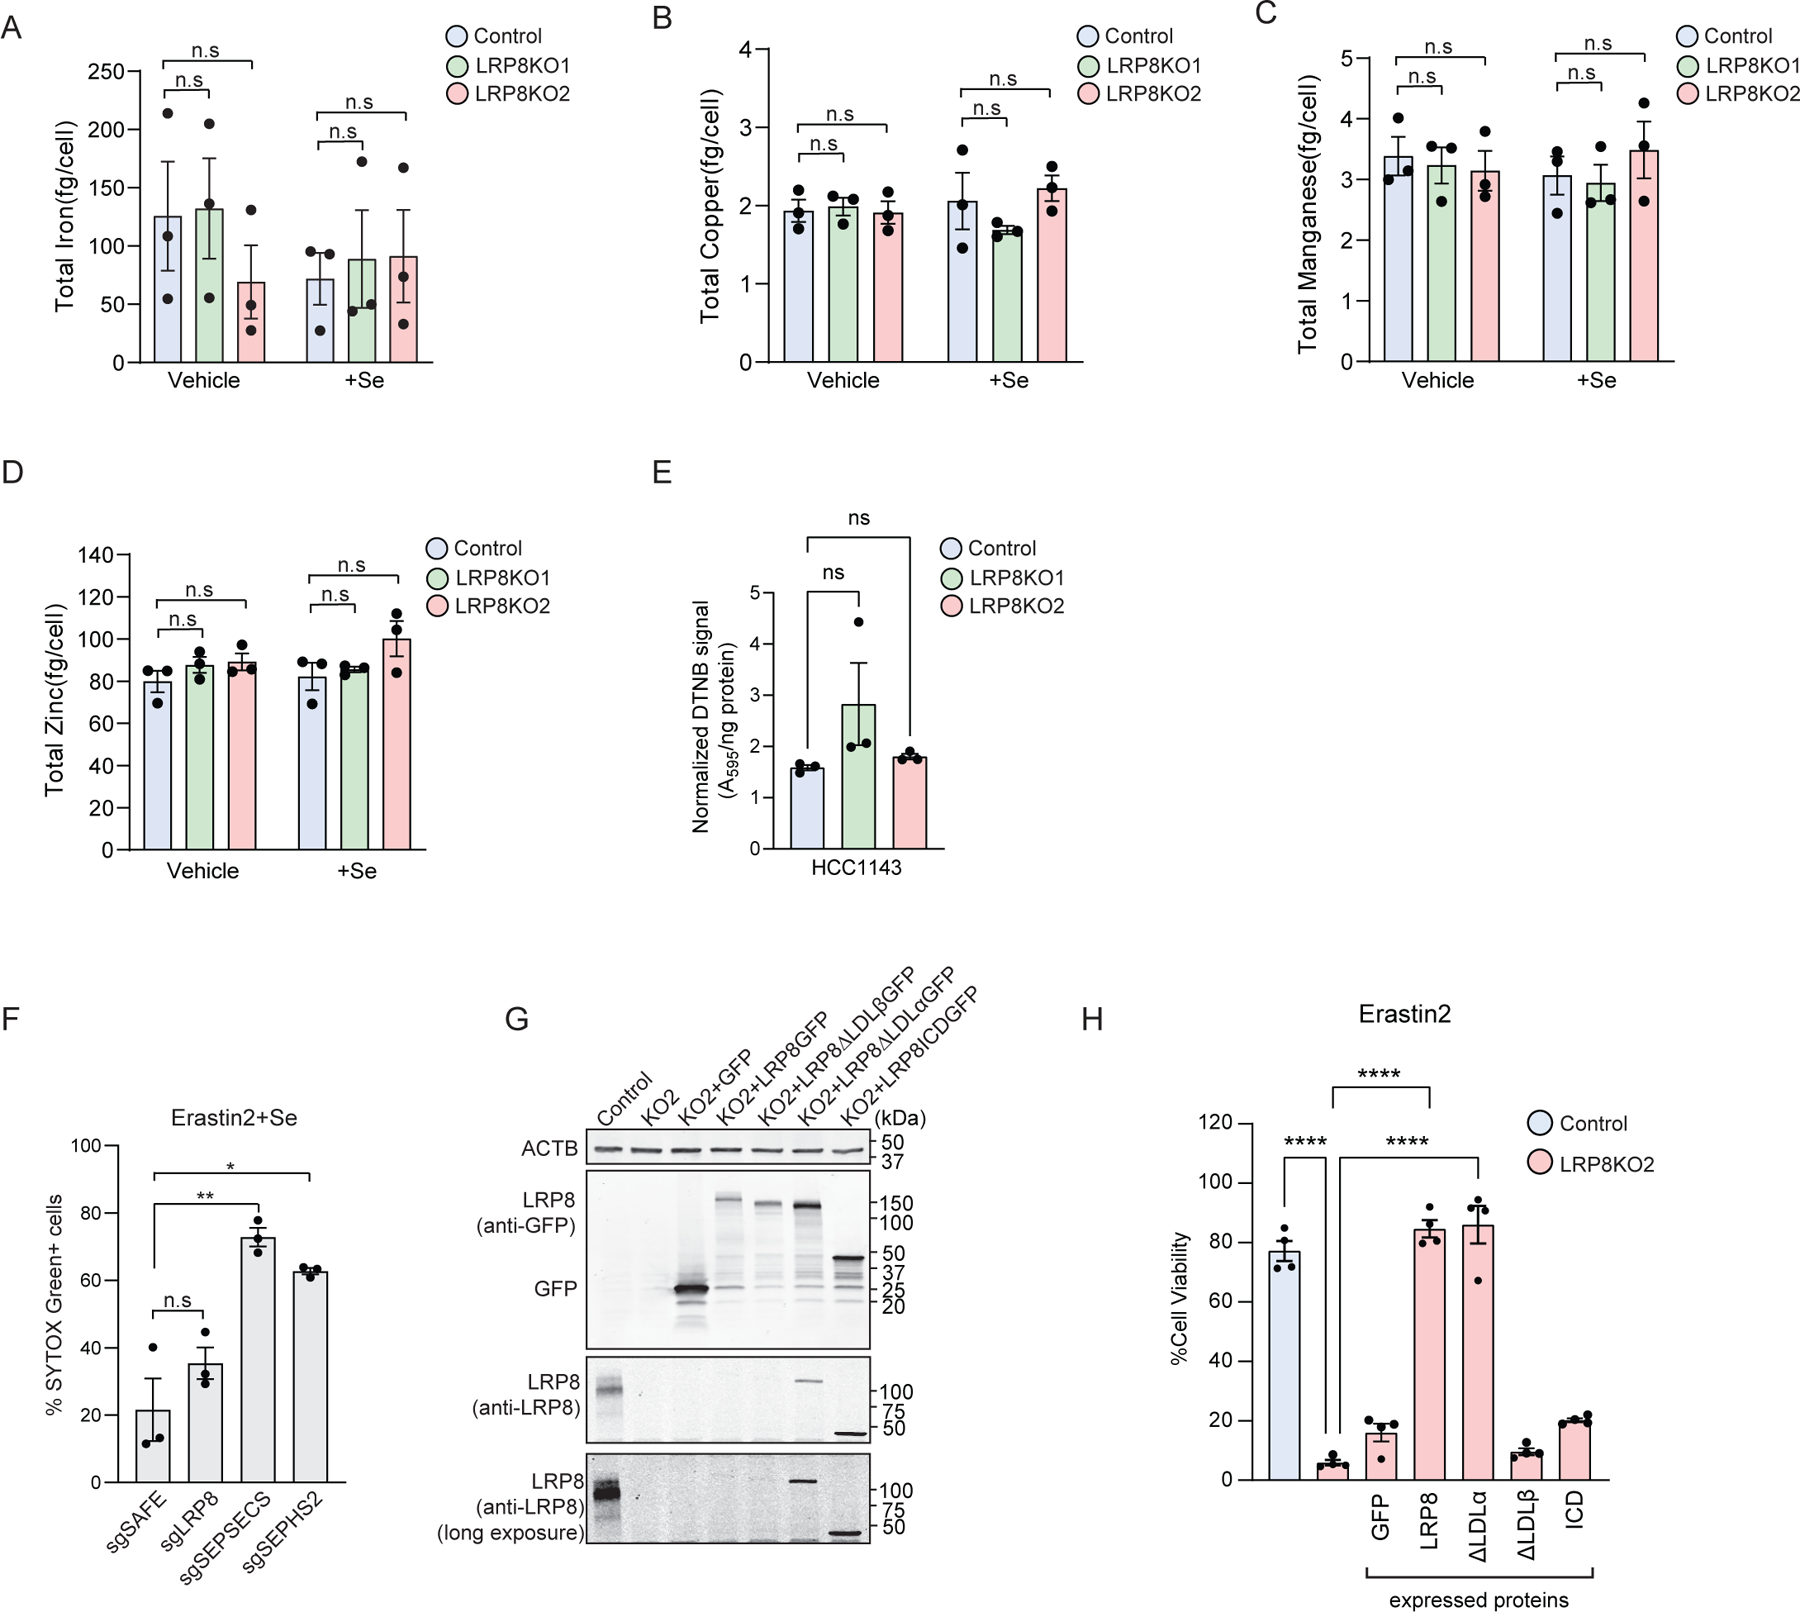
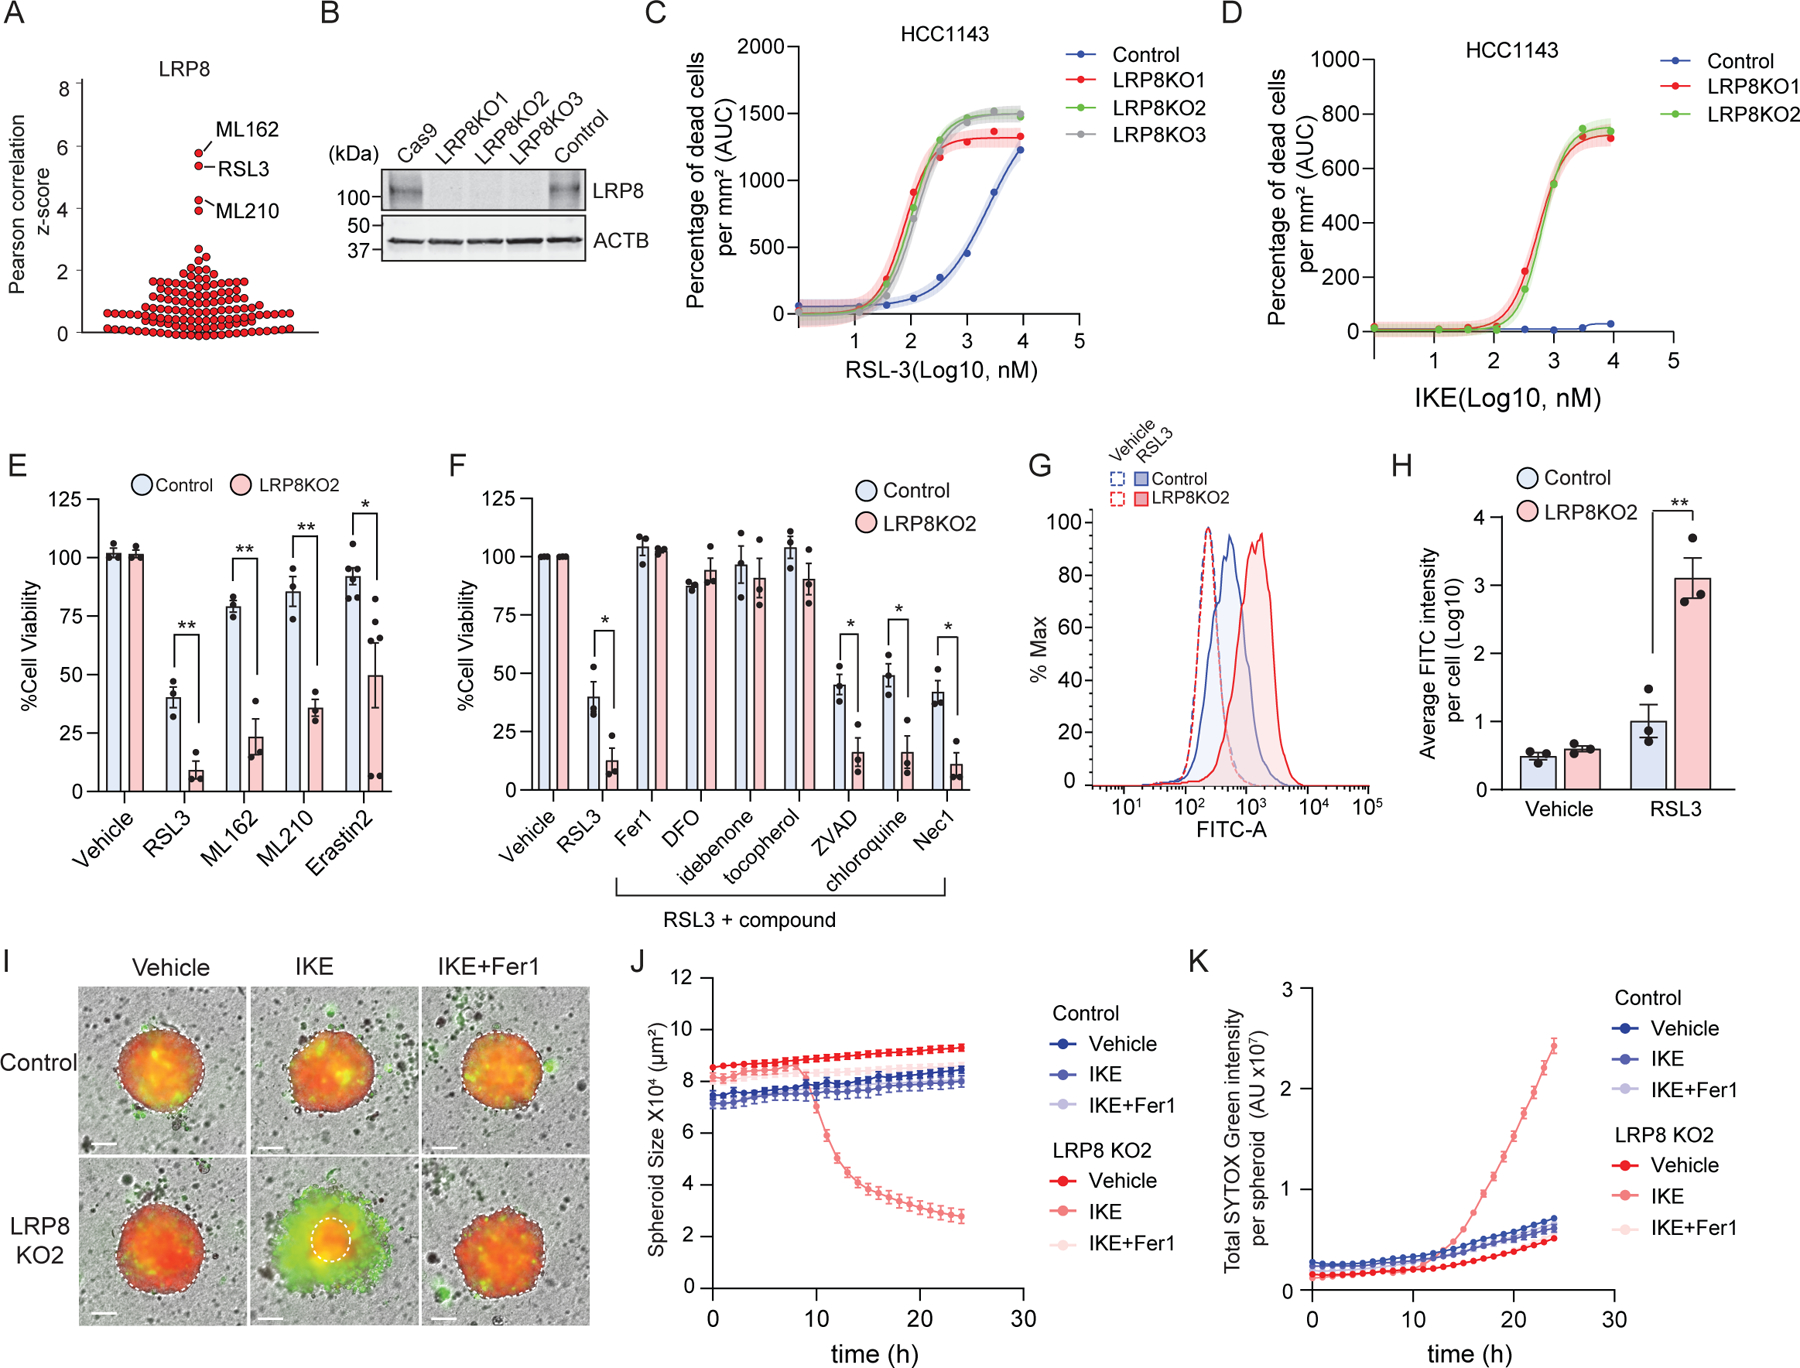
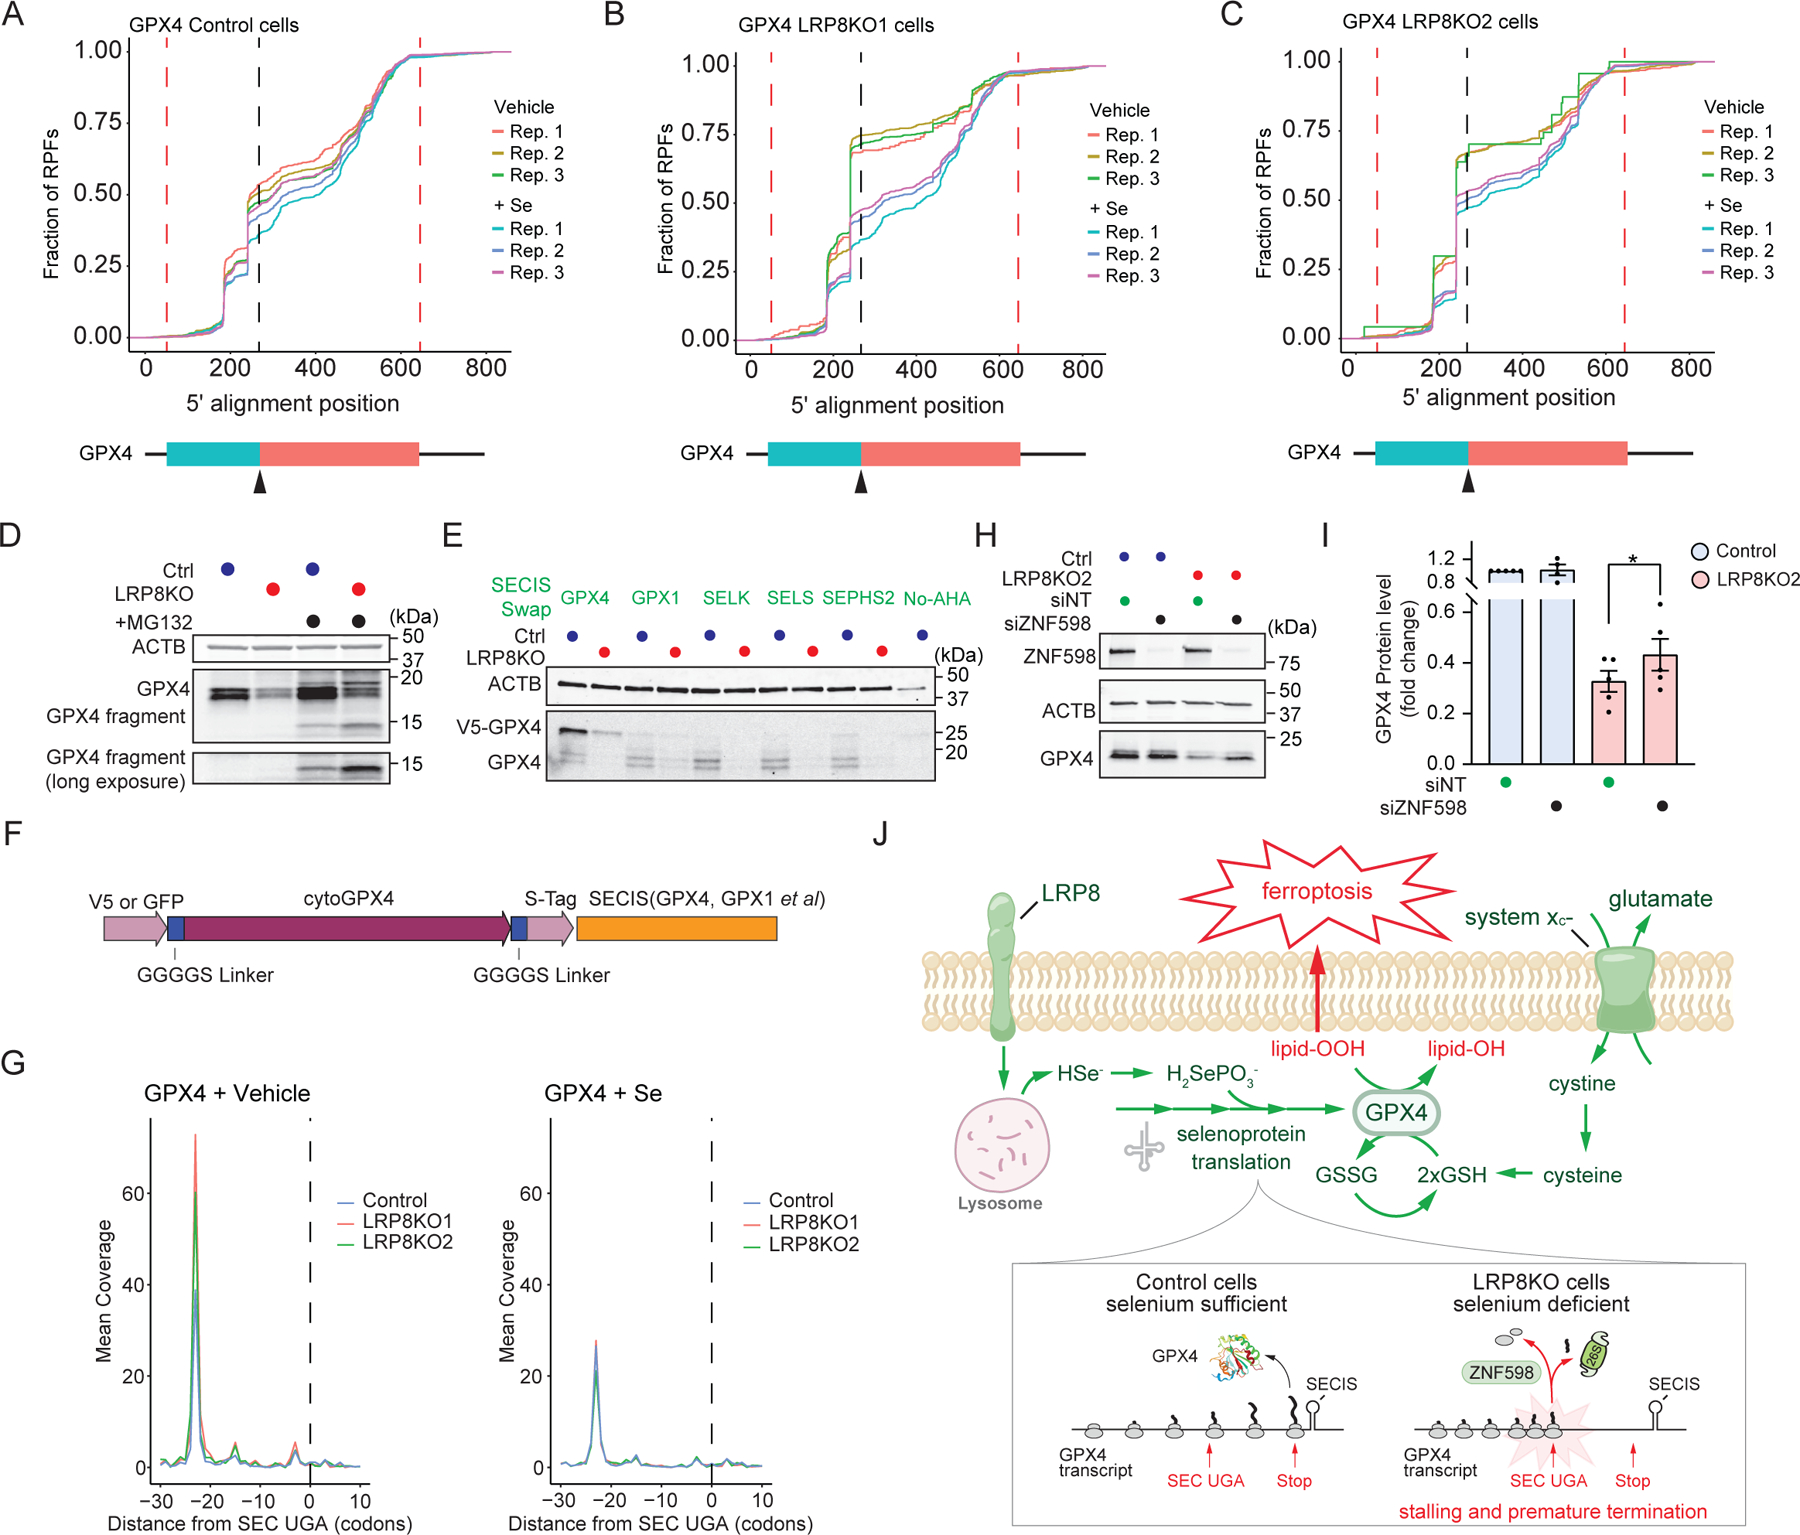
The selenoprotein glutathione peroxidase 4 (GPX4) prevents ferroptosis by converting lipid peroxides into nontoxic lipid alcohols. GPX4 has emerged as a promising therapeutic target for cancer treatment, but some cancer cells are resistant to ferroptosis triggered by GPX4 inhibition. Using a chemical-genetic screen, we identify LRP8 (also known as ApoER2) as a ferroptosis resistance factor that is upregulated in cancer. Loss of LRP8 decreases cellular selenium levels and the expression of a subset of selenoproteins. Counter to the canonical hierarchical selenoprotein regulatory program, GPX4 levels are strongly reduced due to impaired translation. Mechanistically, low selenium levels result in ribosome stalling at the inefficiently decoded GPX4 selenocysteine UGA codon, leading to ribosome collisions, early translation termination and proteasomal clearance of the N-terminal GPX4 fragment. These findings reveal rewiring of the selenoprotein hierarchy in cancer cells and identify ribosome stalling and collisions during GPX4 translation as ferroptosis vulnerabilities in cancer.


Conflict of interest statement

COMPETING INTERESTS

S.J.D. is a co-founder of Prothegen Inc. and a member of the advisory board for Ferro Therapeutics and Hillstream Biopharma. S.J.D. and J.A.O. have patent applications related to ferroptosis.

Figures

Extended Data Fig. 1:
Extended Data Fig. 1:. Cell-specific role for FSP1 in ferroptosis.
a-b, Summary of FSP1 gene expression and ML162 (a) and ML210 (b) sensitivity in various cancer cells. Data were mined from the CTRP database. c, Schematics of CRISPR-Cas9 screen strategy. d, Dose response of RSL3-induced cell death of control and FSP1KO in U-2 OS and MDA-MB-453. Shading indicates 95% confidence intervals for the fitted curve, and each data point is the average of three replicates. e, Gene effects and gene scores calculated for individual genes analyzed in the genome-wide CRISPR screen of U-2 OS cells. f, Histogram of FSP1 from casTLE analysis showing the negative enrichment of FSP1 compared to controls. g, Schematic of cell competitive growth assay. h-j, Quantification of the ratio between mCherry+ : mCherry− cells after the indicated treatment. Data represent mean ± S.E.M. of three biological replicates, which were compared using a two-tailed, unpaired t-test. ****P < 0.0001, ***P < 0.001, **P < 0.01, *P < 0.05.
Extended Data Fig. 2:
Extended Data Fig. 2:. Analysis of LRP8 in cancers.
a, Relative expression of LRP8 in normal tissue and tumors from various primary sites. Plotted data were mined from the TCGA database. LRP8 is highly expressed in tumors across many cancer types. n=BRCA: N(112), T(1093); BLCA: N(19), T(408); CESC: N(3), T(304); CHOL: N(9), T(36); COAD: N(41), T(458); COADREAD :N(51), T(623); ESCA:N(11), T(184); HNSC: N(44), T(520); LICH: N(50), T(371); LUAD: N(59), T(515); LUCS: N(51), T(501); PAAD: N(4), T(178); PCPG: N(3), T(179); READ: N(10), T(166); SARC: N(2), T(259); STAD: N(35), T(415); STES: N(46), T(599); UCEC: N(35), T(545). b, Relative expression of LRP8 in various subtypes of breast cancer, n= Normal(473), LA(379), LB(244), HER2+(230), TNBC(251). c, Relative expression of LRP8 in breast cancer of different grades. n= I(7), II(58), III(46). The box and whiskers plot in a-c were generated by Tukey method. d, Kaplan-Meier survival curve showing that patients with higher expression of LRP8 have poorer survival rate. Plotted data were mined from the TCGA database.
Extended Data Fig. 3:
Extended Data Fig. 3:. Analysis of LRP8 as a ferroptosis resistance factor.
a, Western blot to validate LRP8KO in MDA-MB-453 cells. Two single-clonal LRP8KO lines generated from different sgRNAs were selected and compared with parental cells stably expressing Cas9. b, Western blot to validate LRP8KO in HCC1937 cells. Two single-clonal LRP8KO lines generated from the same sgRNA were selected and compared with control cells expressing sgSAFE. c, Dose response of RSL3-induced cell death of control and LRP8KO MDA-MB-453 cells. d, Dose response of RSL3-induced cell death of control and LRP8KO HCC1937 cells. e, Dose response of RSL3-induced cell death of control and LRP8KO HCC1143 cells by cell-titer glow assay. f, Dose response of erastin2-induced cell death of control and LRP8KO HCC1143 cells. g, Time-lapse cell death analysis of control and LRP8KO cells treated with 3 µM auranofin alone or in the presence of 2 µM Fer1 over 43hr. h, Time-lapse cell death analysis of control and LRP8KO cells treated with 500 µM sulfasalazine alone or in the presence of 2 µM Fer1 over 48hr. i, Dose response of RSL3-induced cell death in control, LRP8KO, and LRP8KO expressing LRP8-GFP by cell titer glow assay. j, Dose response of IKE-induced cell death of control, LRP8KO, and LRP8KO expressing LRP8-GFP. k, Validation of LRP8 overexpression in LRP8KO MDA-MB-453 cells. l, Cell viability of MDA-MB-453 control and LRP8KO cells stably expressing GFP or LRP8-GFP subjected to 100 nM RSL3 for 24 hr. l, Validation of LRP8 overexpression in LRP8KO MDA-MB-453 cells. m, Live-cell imaging of control and LRP8KO cells incubated with SYTOX Green and treated with 100 nM RSL3 alone or co-treated with 2 µM Fer1. Scale Bar, 100 µm. n, Cell viability of control and LRP8KO cells following treatment with RSL3, etoposide, and H2O2 for 24 hr (RSL3, 200 nM; etoposide, 100 µM; H2O2, 30 µM). In c,d,e,f, and i,j shading indicates 95% confidence intervals for the fitted curve and each data point is the average of three biological replicates. Data in g and h represent mean ± S.E.M. of three biological replicates. Data in l and n represent mean ± S.E.M. of three biological replicates by two-tailed, unpaired t-test. ****P < 0.0001, ***P < 0.001, *P < 0.05.
Extended Data Fig. 4:
Extended Data Fig. 4:. LRP8 promotes ferroptosis resistance in multiple cancer cell lines.
a, Validation of LRP8KO in multiple cancer cell lines. Westen blot of pools of LRP8KO cells generated from two different sgRNAs and control Cas9-expressing cells. b-d, Time-lapse cell death analysis of U87-MG (b), A375 (c), and SK-MEL28 (d) cells treated with RSL3 over 24 hr or 72 hr. Data represent mean ± S.E.M. of three replicates.
Extended Data Fig. 5:
Extended Data Fig. 5:. Role of selenium metabolism and lipoprotein receptors in ferroptosis.
a, Overview of genome-wide gene coessentiality, highlighting LRP8 in a selenocysteine metabolism cluster. b, Schematic of selenocysteine synthesis. c, Time-lapse cell death analysis of control and CRISPR KO of genes from the selenoprotein synthesis pathway [SEPHS2 (left), SPESECS (mid), PSTK (right)]. Cells were treated with 100 nM RSL3 for 24 hr (n =1). d, Quantification of the percentage of SYTOX green positive cells (dead cells) of control and single or double KO of indicated genes related to selenocysteine metabolism. e, Time-lapse cell death analysis of control and CRISPR knockout of genes from lipoprotein receptor superfamily [LDLR (left), VLDLR (mid), LRP2 (right)]. Cells were treated with 100 nM RSL3 for 24 hr (Data represent mean ± S.E.M. of four independent experiments). f, Quantification of the percentage of SYTOX green positive cells (dead cells) of control and single or double KO of indicated genes related to lipoprotein receptor superfamily. Data in d, f represent mean ± S.E.M. of three biological replicates by two-tailed, unpaired t-test. ****P < 0.0001, **P < 0.01.
Extended Data Fig. 6:
Extended Data Fig. 6:. Role of LRP1 and SELENOP in ferroptosis.
a, Histograms of LRP1 results from casTLE analysis, including the average for the entire population (red line) and for the LRP1 sgRNAs (blue line). b, Representative immunoblotting of GPX4 in HCC1143 control and LRP1KO cells. c, Dose response of RSL3-induced cell death of HCC1143 control, LRP8KO, LRP1KO and LRP1/LRP8 double KO cells. d, Time-lapse cell death analysis of HCC1143 control, LRP8KO, LRP1KO and LRP1/LRP8 duoble KO cells. Cells were treated with 111 nM RSL3 for 24 hr. e, Quantification of the percentage of SYTOX green positive cells (dead cells) of control and single or double KO of indicated genes after 111 nM RSL3 for 24 hr. f, Histograms of SELENOP results from casTLE analysis, including the average for the entire population (red line) and for the SELENOP sgRNAs (blue line). g, Dose response of RSL3-induced cell death of HCC1143 control and single or double KO cells of indicated genes. h, Dose response of RSL3-induced cell death of HCC1143 control and LRP8KO cells subjected to non-targeting or SELENOP siRNA. In c,g-h, Shading indicates 95% confidence intervals for the fitted curves and each data point is the average of three biological replicates. All data represent mean ± S.E.M. of three biological replicates. Data in e represent mean ± S.E.M. of three biological replicates by one-way ANOVA. ****P < 0.0001, *P < 0.05.
Extended Data Fig. 7:
Extended Data Fig. 7:. Measurement of metals in LRP8 knockout cells.
a-d, Total levels of iron (a), copper (b), manganese (c), and zinc (d) in control and LRP8KO cells alone or the presence of 200 nM Se by ICP-MS. e, Measure of the glutathione level (DNTB) in HCC1143 control and LRP8KO cells. f, Quantification of SYTOX green positive cells in KO cells of indicated genes subjected to 3 µM erastin2. g) Immunoblot showing the expression of GFP tagged LRP8 wildtype or truncation mutants in LRP8KO HCC1143 cells. h, Cell viability of control cells or LRP8KO cells stably expressing indicated LRP8 mutants in the presence of 3 µM erastin2 for 24 hr. All data represent mean ± S.E.M. of three biological replicates by one-way ANOVA (a-d,h) or paired t-test (e,f). ****P < 0.0001, **P < 0.01, *P < 0.05.
Extended Data Fig. 8:
Extended Data Fig. 8:. LRP8 is essential for maintenance of GPX4 and suppression of ferroptosis in cancer cells.
a. Representative western blot of HCC1143 cell lysates subjected to various antioxidants for seven days. b, Representative western blot of GPX4 in MDA-MB-453 cell lysates from multiple clonal LRP8KO lines. c, Quantification of GPX4 levels from b (three independent replicates). d-f, Representative western blot of GPX4 in HCC1937 (d), U87-MG (e), SKMEL38 (f) LRP8KO cells. g,h, Western blot of GPX4 in MDA-MB-453 (g) and HCC1143 (h) LRP8KO cells stably expressing LRP8 wildtype or various truncation mutants. i, Representative western blot of cell lysates from MCF10A and HCC1143 cultured in Human Plasma-Like Medium (n = 3 independent experiments). j, Representative western blot of lysates from MCF10A control and LRP8KO cells stably expressing MYC, HRasG12V and KRasG12V (n = 3 independent experiments). k, Quantification of protein levels from panel h. The level of GPX4 was normalized to the levels of ACTB from the same lysate sample and subsequently normalized to that of control expressing the same oncogene. l, Representative Western blot analysis of cell lysates from MCF10A-HRasG12V subjected to siNT or siLRP8. m, Quantification of protein levels from l (n = 3 independent experiments). n, Representative Western blot analysis of cell lysates from MCF10A-HER2 treated with siNT or siLRP8 for 7 days. o, Quantification of protein levels from l (n = 3 independent experiments).p, Representative immunoblotting of GPX4 in MCF10A-MYC control and LRP8KO cells. Cell lysates were collected under basal conditions or pre-treated with 200 nM Se for 48 hr. q, Cell viability of MCF10A-MYC control and LRP8KO cells upon treatment with 9 µM RSL3 24 hr. Data in c,k,m,o,q represent mean ± S.E.M. of three biological replicates by two-tailed, unpaired t-test. ****P < 0.0001, **P < 0.01, *P < 0.05.
Extended Data Fig. 9:
Extended Data Fig. 9:. LRP8KO impacts GPX4 translation but not transcription or protein turnover
a, Validation of GPX4 wildtype and mutants expression in HCC1143 LRP8KO cells. b, Immunofluorescence of GPX4 (green) in LRP8KO cells stably expressing cytoGPX4 or mitoGPX4. Mitochondria were labeled by MitoTracker Deep Red. Scale bars, 10 μm. c, Relative GPX4 mRNA levels in control and LRP8KO cells as measured by quantitative PCR. Data represent mean ± S.E.M. of three biological replicates by two-tailed, unpaired t-test. d, Gene expression profiles of 23 human selenocysteine genes detected in control and LRP8KO HCC1143 cells with or without pre-treatment with 200 nM Se for 24 hr. Gene expression in LRP8KO cells is represented as log2 fold change relative to that of control cells from the same condition. e, Raw sequence counts of the 23 selenocysteine genes from RNA-seq. f, western blot of GPX4 in control and LRP8KO cells following 10 μM MG132 or 20 μM Chloroquine treatment for 24 hr. g, Representative western blots of AHA labeled, newly translated GPX4,GPX1 and SELENOH in control and LRP8KO cells. h, Quantification of GPX4 protein levels from g. Data represent mean ± S.E.M of five biological replicates by one-way ANOVA, and adjusted using Bonferroni correction for multiple comparisons. ****P < 0.0001.
Extended Data Fig. 10:
Extended Data Fig. 10:. GPX4 SEICS impacts on ribosome collision
a, Western blotting of control and LRP8KO cell lysates subjected to different dose of non-targeting or GPX4 siRNA. b, Immunoblotting analysis of SECISBP2 for EEFSEC from HCC1143 Control and LRP8 cells stably expressing V5-GPX4-Stag. Cells were incubated with vehicle or 200nM Se for 72hr before the harvest for co-immunoprecipitation. c, Representative western blot showing the protein level of different GPX4 SECIS-Swap mutants in HCC1143 control and LRP8KO cells (n = 3 independent experiments). d, Quantification of the percentage of SG+ cells (dead cells) in control and LRP8KO cell lines stably expressing the indicated GPX4-SECIS-Swap mutants over 24hr in the present of 100nM RSL3. Heatmap data represent mean ± S.E.M. of three biological replicates. e, Relative V5-GPX4 mRNA levels in control and LRP8KO cells stably expressing the indicated GPX4-SECIS-Swap mutants as measured by quantitative PCR. Data represent mean ± S.E.M. of two biological replicates by two-tailed, unpaired t-test.
Fig. 1:
Fig. 1:. Genome-wide CRISPR screen identifies LRP8 as a genetic modifier of ferroptosis resistance in triple-negative breast cancer cells.
a, Summary of FSP1 gene expression and RSL3 sensitivity in various cancer cells, data were mined from the CTRP database. AUC is the area under the curve from RSL3 dose response analyses of cell viability. b, Western blot of lysates from MDA-MB-453 cells and U2-OS cells indicates FSP1 protein levels and KO efficiency. c, Dose response of RSL3 induced cell death in U-2 OS and MDA-MB-453 cells treated with vehicle or 5µM iFSP1. Shading indicates 95% confidence intervals for the fitted curved and each data point is the average of three replicates. AUC, Area Under the Curve. e, Gene effects and gene scores calculated for individual genes analyzed in the genome-wide CRISPR screen in MDA-MB-453 cells. f, Histograms of selected individual gene results from casTLE analysis, including the average for the entire population (red line) and for the indicated gene sgRNAs (blue line).
Fig. 2:
Fig. 2:. LRP8 promotes ferroptosis resistance in breast cancer cells.
a, LRP8 expression is positively correlated with resistance to ferroptosis inducers in cancer cells. Plotted data were mined from the CTRP database, which contains correlation coefficients between gene expression and drug sensitivity for 907 cancer cell lines treated with 545 compounds. b, Western blot analysis of the LRP8 KO in HCC1143 cells with multiple sgRNAs. The “Cas9” line indicates parental HCC1143 cells stably expressing Cas9. The “Control” expresses “sgSAFE” control sgRNA (referred as “control” hereafter) c, Dose response of RSL3-induced cell death in control and LRP8 single clonal KO cells. d, Dose response of IKE-induced cell death in control and LRP8KO cells. e, Cell viability of control and LRP8KO cells 24 hr after treatment with the indicated ferroptosis inducers by cell-titer glow assay (RSL3, 200nM; ML162, 200 nM; ML210, 400 nM; Erastin 2, 400 nM). f. Cell viability of control and LRP8KO cells treated with RSL3 in the presence of inhibitors of different types of cell death for 24 hr (RSL3, 200 nM; Fer1, 2 µM; DFO, 100 µM; idebenone, 10 µM; tocopherol, 10 µM; ZVAD, 20 µM; chloroquine, 200 µM; Nec-1, 1 µM). g, Control and LRP8KO cells treated with 200nM RSL3 for 5 hrs were labeled with BODIPY 581/591 C11. Green fluorescence intensity was analyzed by flow cytometry. h, Quantification of FITC intensity from g. i, Spheroids from control and LRP8KO cells stably expressing mCherry were incubated with IKE or IKE+Fer1 and SG and visualized using live-cell imaging. j,k, Quantification of the size of each spheroid (j) and the total intensity of the SG signal (k) over 24 hr. In c-d, Shading indicates 95% confidence intervals for the fitted curves and each data point is the average of three biological replicates. All data represent mean ± S.E.M. of three biological replicates, except for erastin2 (n=6) in f, by two-tailed, unpaired t-test (e, f, h). For j and k, a total of 14, 15, 10, 8, 10 and 12 independent spheroids were collected in three biological repeats for control_vehicle, LRP8KO2_vehicle, Control_IKE, LRP8KO2_IKE, Control_IKE+Fer1, LRP8KO2_IKE+Fer1, respectively. **P < 0.01, *P < 0.05.
Fig. 3:
Fig. 3:. LRP8 regulation of selenium levels impacts ferroptosis resistance.
a, Coessentiality network analysis for LRP8 in pan-cancer context by FIREWORKS. Two primary modules, (1) glutathione and NAD metabolism and (2) selenocysteine metabolism, are positively associated with LRP8. The thickness of the line represents person correlation. b, Gene ontology (GO) analysis of the genes in the selenocysteine metabolism cluster. c-e, Quantification of the percentage of SG+ cells (dead cells) in control and single or double KO cell lines targeting the indicated genes related to selenocysteine metabolism (c), lipoprotein receptors (d), or LRP2 (e). f, ICP-MS measurement of the selenium levels in control and LRP8KO cells alone or in the presence of 200 nM Se for 24 hr. g, Live-cell imaging of control and LRP8KO spheroids cultured with IKE or Se. Live cells stably express mCherry and dead cells are labeled with SG. h,i, Quantification of the size of each spheroid (h) or the total intensity of green signal (i) over 24 hr. j, Cell viability of control and LRP8KO cells upon treatment with 100 nM RSL3 combined with vehicle control or different [Se] for 24 hr. k, Quantification of SG+ cells in the indicated KO cells treated with 100 nM RSL3 for 24 hr. l, Schematic illustration of LRP8 domains. m, Cell viability of control cells or LRP8KO stably expressing the indicated LRP8 mutants in the presence of 100 nM RSL3 for 24 hr. Data represent mean ± S.E.M. of three biological replicates, except for m, where n=4. Data were compared using an unpaired two-tailed t-test (c-f,k),one-way ANOVA (m) and two-way ANOVA (j). In h and i, a total of 11, 12, 8, 7, 12 and 12 independent spheroids were collected in three biological repeats for Control_Se, LRP8KO2_Se, Control_IKE, LRP8KO2_IKE, Control_IKE+Se, LRP8KO2_IKE+Se, respectively. ****P < 0.0001, **P < 0.01, *P < 0.05.
Fig. 4:
Fig. 4:. Altered selenocysteine protein expression in LRP8KO cells confers a ferroptosis vulnerability
a, Representative immunoblotting of 18 selenocysteine proteins in control and LRP8KO cells. Cell lysates were collected under basal conditions or pre-treated with 200 nM Se for 48 hr(n = 3 independent experiments). b, Quantification of protein levels from panel a. The level of each protein was normalized to the levels of ACTB from the same lysate sample and subsequently normalized to that of control under basal conditions. The fold changes are represented as a heat map. c, Western blot analysis of cell lysates from control and LRP8KO cells comparing the protein levels of SLC7A11, ACSL3, ACSL4, and FSP1 d, Timeline of the Se washout assay. e, Quantification of selenocysteine protein level upon Se washout (n = 3 independent experiments). The level of each protein was first normalized to that of ACTB from the same lysate sample and subsequently normalized to the level in the LRP8KO at Day 0. The fold changes are represented as a heat map. f, comparison of selenocysteine protein level between the steady state condition (a,b) and time to reach 50% of Day 0 upon Se washout (e). Selenoproteins that never reached 50% within 7 days of Se withdrawal are indicated as “≥8 Day”. Groups of selenoproteins that responded similarly are indicated by the circles. g,h, Cell viability of control and LRP8 cells stably expressing the indicated proteins in the presence of 100 nM RSL3 (g) or 3 μM erastin2 (h) for 24 hr. i, Representative Western blot showing the changes in selenocysteine protein levels upon the overexpression of GPX4 (long or short isoform) or GPX1(n = 3 independent experiments). j, Quantification of protein levels from i. The level of each protein was first normalized to that of ACTB from the same lysate sample and subsequently normalized to that of LRP8KO. The fold changes were represented as a heat map. Data represent mean ± S.E.M. of three biological replicates. ****P < 0.0001.
Fig. 5:
Fig. 5:. GPX4 translation is disrupted under selenium-limiting conditions.
a, Experimental workflow for AHA translational analysis of GPX4 in control and LRP8KO cells with or without Se treatment. b, Representative LC traces of a GPX4 peptide from AHA labelled control, LRP8KO, and no-AHA cell lysates. c, Quantification of the relative abundance of the GPX4 peptide from b (Data represent mean ± S.E.M. of three biological replicates). The relative abundance of each sample was first measured by relative intensity and normalized to the level of AHA labeled control from the same replicate. d, Scatter plots of fold changes in translation efficiency (TE) between control and two LRP8KOs, respectively. Transcripts with significant TE changes are labeled as black dots. All selenoprotein transcripts are highlighted in cyan. e, Fold changes in TE for the two LRP8KO cells in response to Se treatment. f, Heatmap summary from panels (d) and (e) showing the TE fold change for 17 selenoproteins in the indicated cell lines in the presence and absence of Se treatment. The TE from all groups was normalized to the TE from control cells under steady-state (vehicle) and represented as log2 fold changes. g, Quantification of the overall density of ribosome-protected fragments (RPFs) from 5’ (Cyan) and 3’ (Red) of the SEC in control and LRP8KOs under steady-state or Se-treated conditions. h, Heat map summary of the fold change in the ratio of RPFs 3’ / 5’ of the SEC codon from selected selenoprotein gene transcripts. Those with low counts or a short distance between the SEC and stop codon (<10 nt) were excluded. **P < 0.01, *P < 0.05.
Fig. 6
Fig. 6. GPX4 is susceptible to ribosome stalling and early translation termination under selenium-limiting conditions.
a-c, Empirical Cumulative Distribution Function of GPX4 RPFs in control (a), LRP8KO1 (b), and LRP8KO2 (c) cells incubated with vehicle or Se. The positions of the start and stop codon are indicated by red dash lines, and the location of SEC is marked by a black dash line and black arrowhead. d, Western blotting showing full-length and fragments of GPX4 in control and LRP8KO cells in the presence of 10 μM MG132(n = 2 independent experiments). e, Representative western blots of AHA labeled, newly translated GPX4 from exogenous GPX4 SECIS-Swap constructs in control and LRP8KO cells (n = 3 independent experiments). f, Schematic illustration of the design of the GPX4 SEICS-Swap mutants. g, RPFs accumulated at the 5’ position of the SEC locus on the GPX4 transcript under steady-state (left) or following Se treatment (right). h, Representative immunoblotting of GPX4 in control and LRP8KO2 cells subjected to non-targeting or ZNF598 knockdown by siRNA. i, Quantification of GPX4 level from h (Data represent mean ± S.E.M. of five biological replicates). j, A model illustrating the mechanism by which LRP8 suppresses ferroptosis. LRP8-mediates the uptake of the SEC-rich protein SEPP1, which is broken down in the lysosome to release selenium. Selenium is employed in the translation of selenoproteins such as GPX4. In the absence of LRP8, selenium becomes limiting for the translation of a subset of selenoproteins, including GPX4. Prolonged ribosome stalling at the GPX4 SEC UGA causes ribosome collisions and early translation termination. The resulting decrease in GPX4 levels sensitizes cells to ferroptosis induction by agents targeting the glutathione-GPX4 pathway. *P < 0.05.

Comment in

References

    1. Dixon SJ et al. Ferroptosis: an iron-dependent form of nonapoptotic cell death. Cell 149, 1060–1072 (2012). - PMC - PubMed
    1. Jiang X, Stockwell BR & Conrad M Ferroptosis: mechanisms, biology and role in disease. Nat. Rev. Mol. Cell Biol 22, 266–282 (2021). - PMC - PubMed
    1. Yang WS et al. Regulation of ferroptotic cancer cell death by GPX4. Cell 156, 317–331 (2014). - PMC - PubMed
    1. Bersuker K et al. The CoQ oxidoreductase FSP1 acts parallel to GPX4 to inhibit ferroptosis. Nature 575, 688–692 (2019). - PMC - PubMed
    1. Doll S et al. FSP1 is a glutathione-independent ferroptosis suppressor. Nature 575, 693–698 (2019). - PubMed

Publication types

MeSH terms

Substances