. 2022 Jul;23(7):1042-1051.
doi: 10.1038/s41590-022-01218-x. Epub 2022 May 30.

Type 2 cytokines in the thymus activate Sirpα+ dendritic cells to promote clonal deletion

Affiliations

Type 2 cytokines in the thymus activate Sirpα+ dendritic cells to promote clonal deletion

Elise R Breed et al. Nat Immunol. 2022 Jul.

Abstract

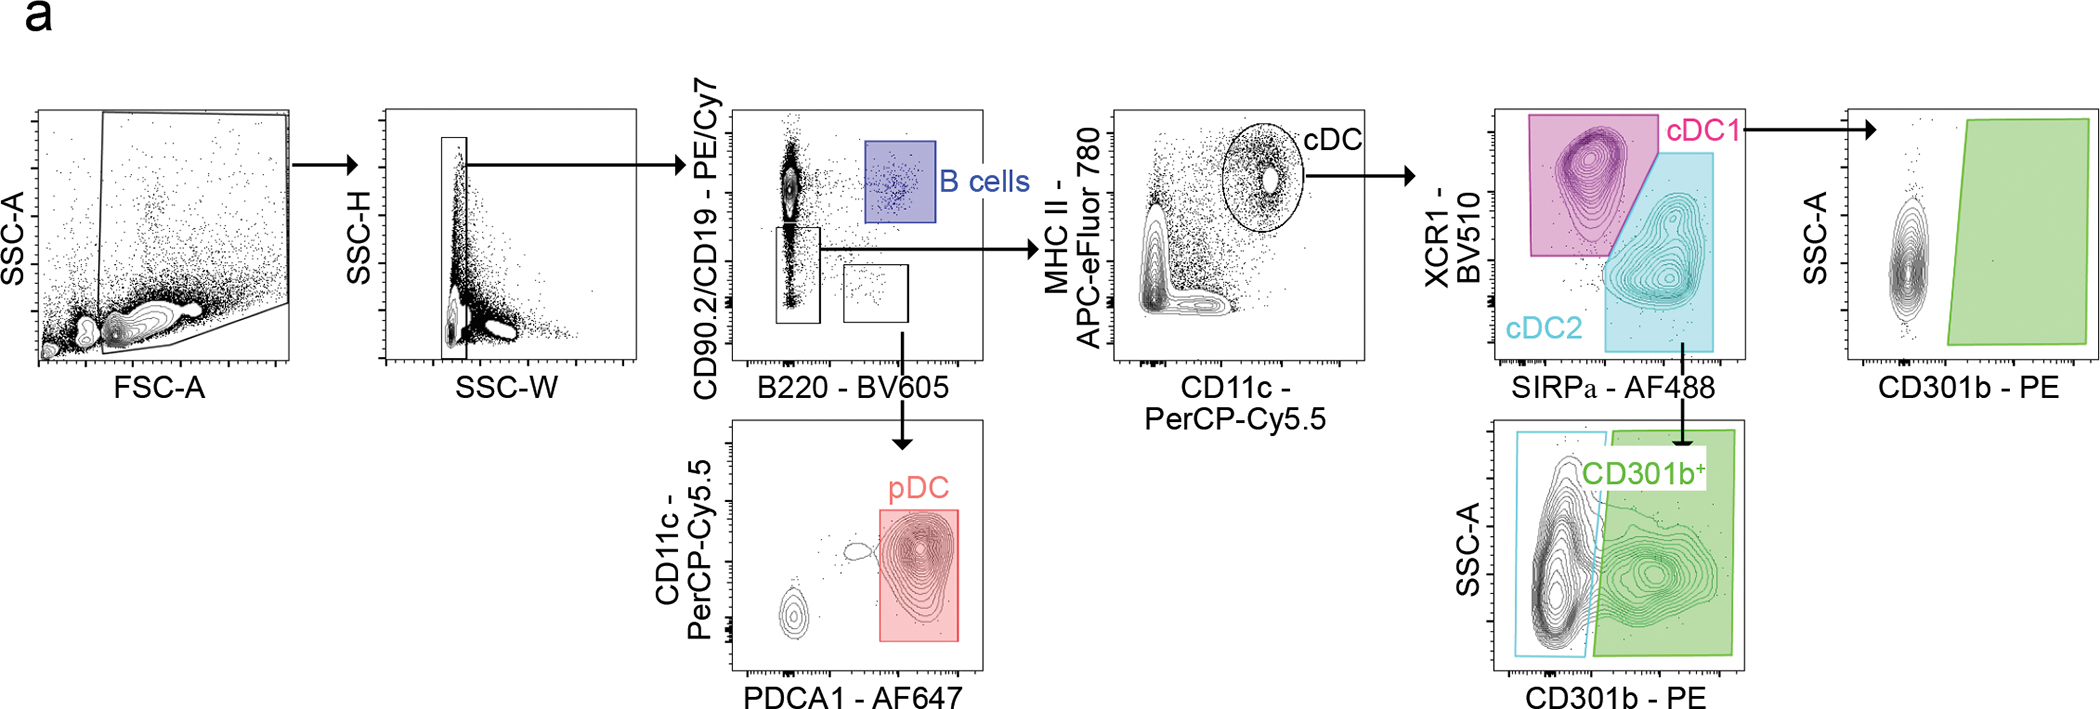
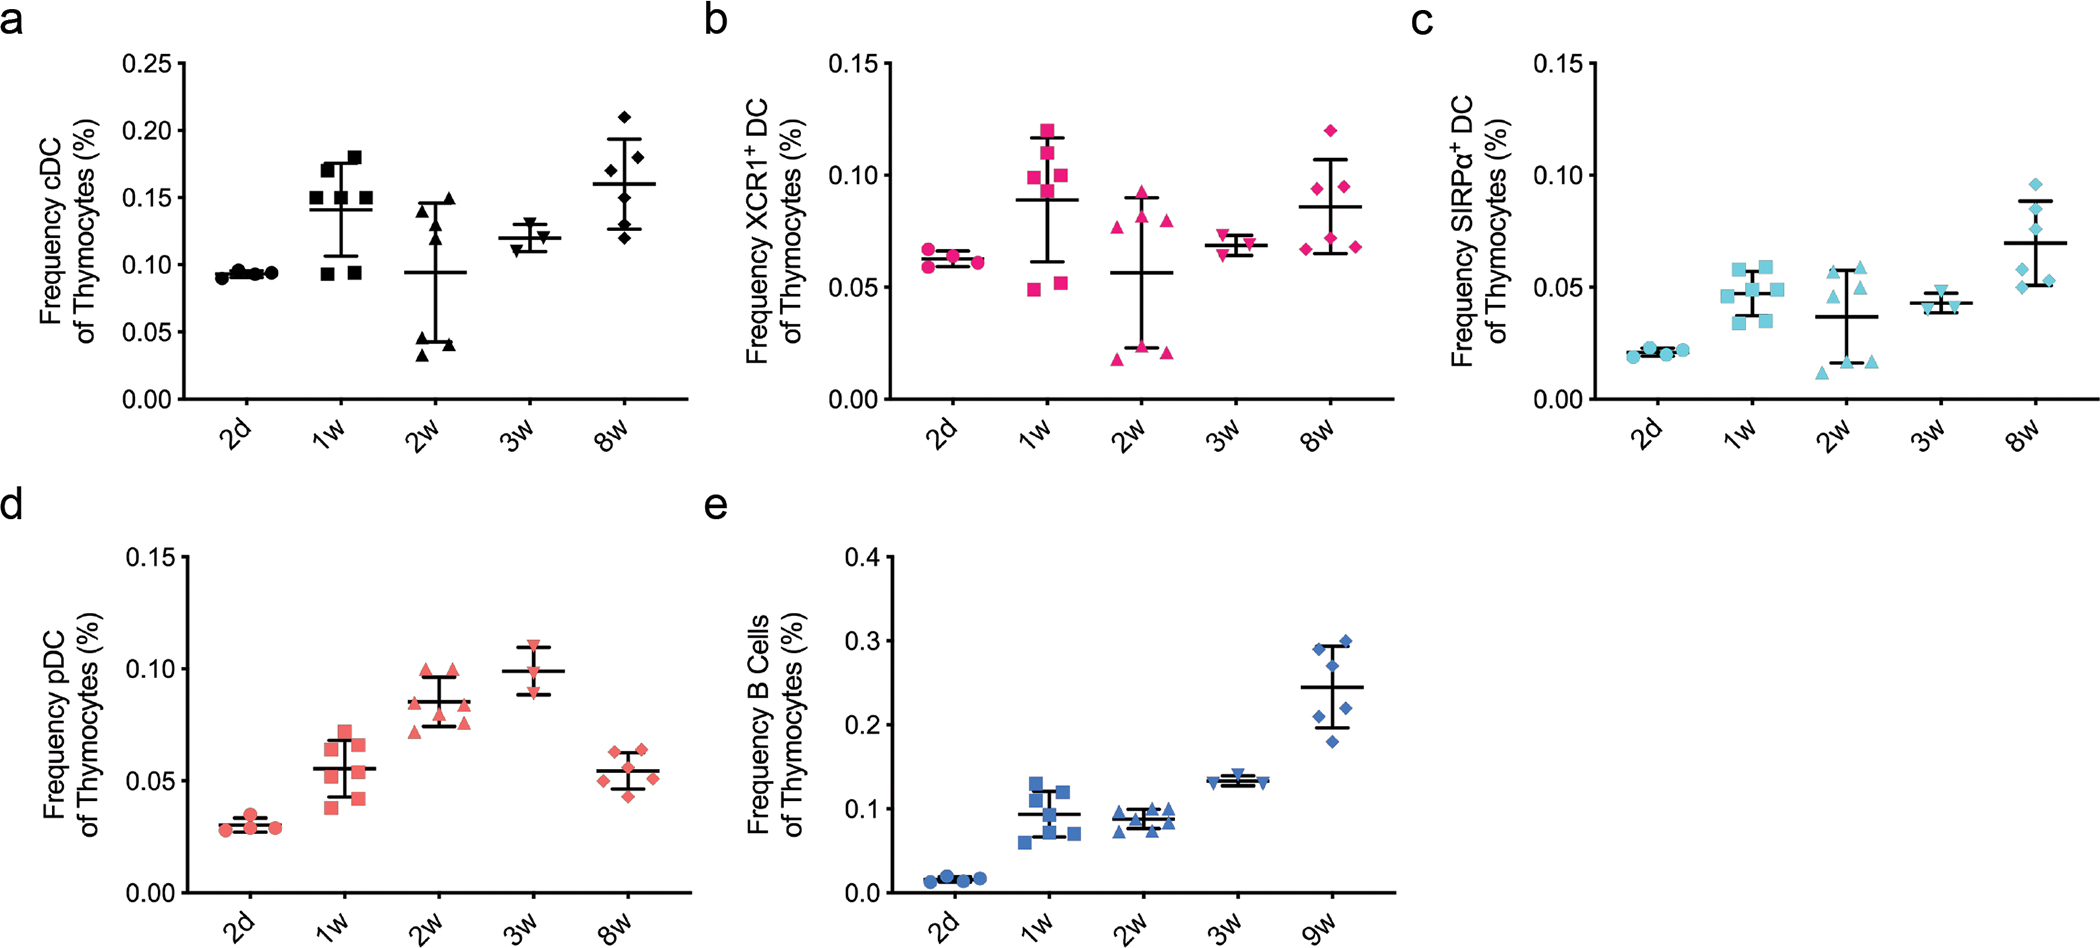
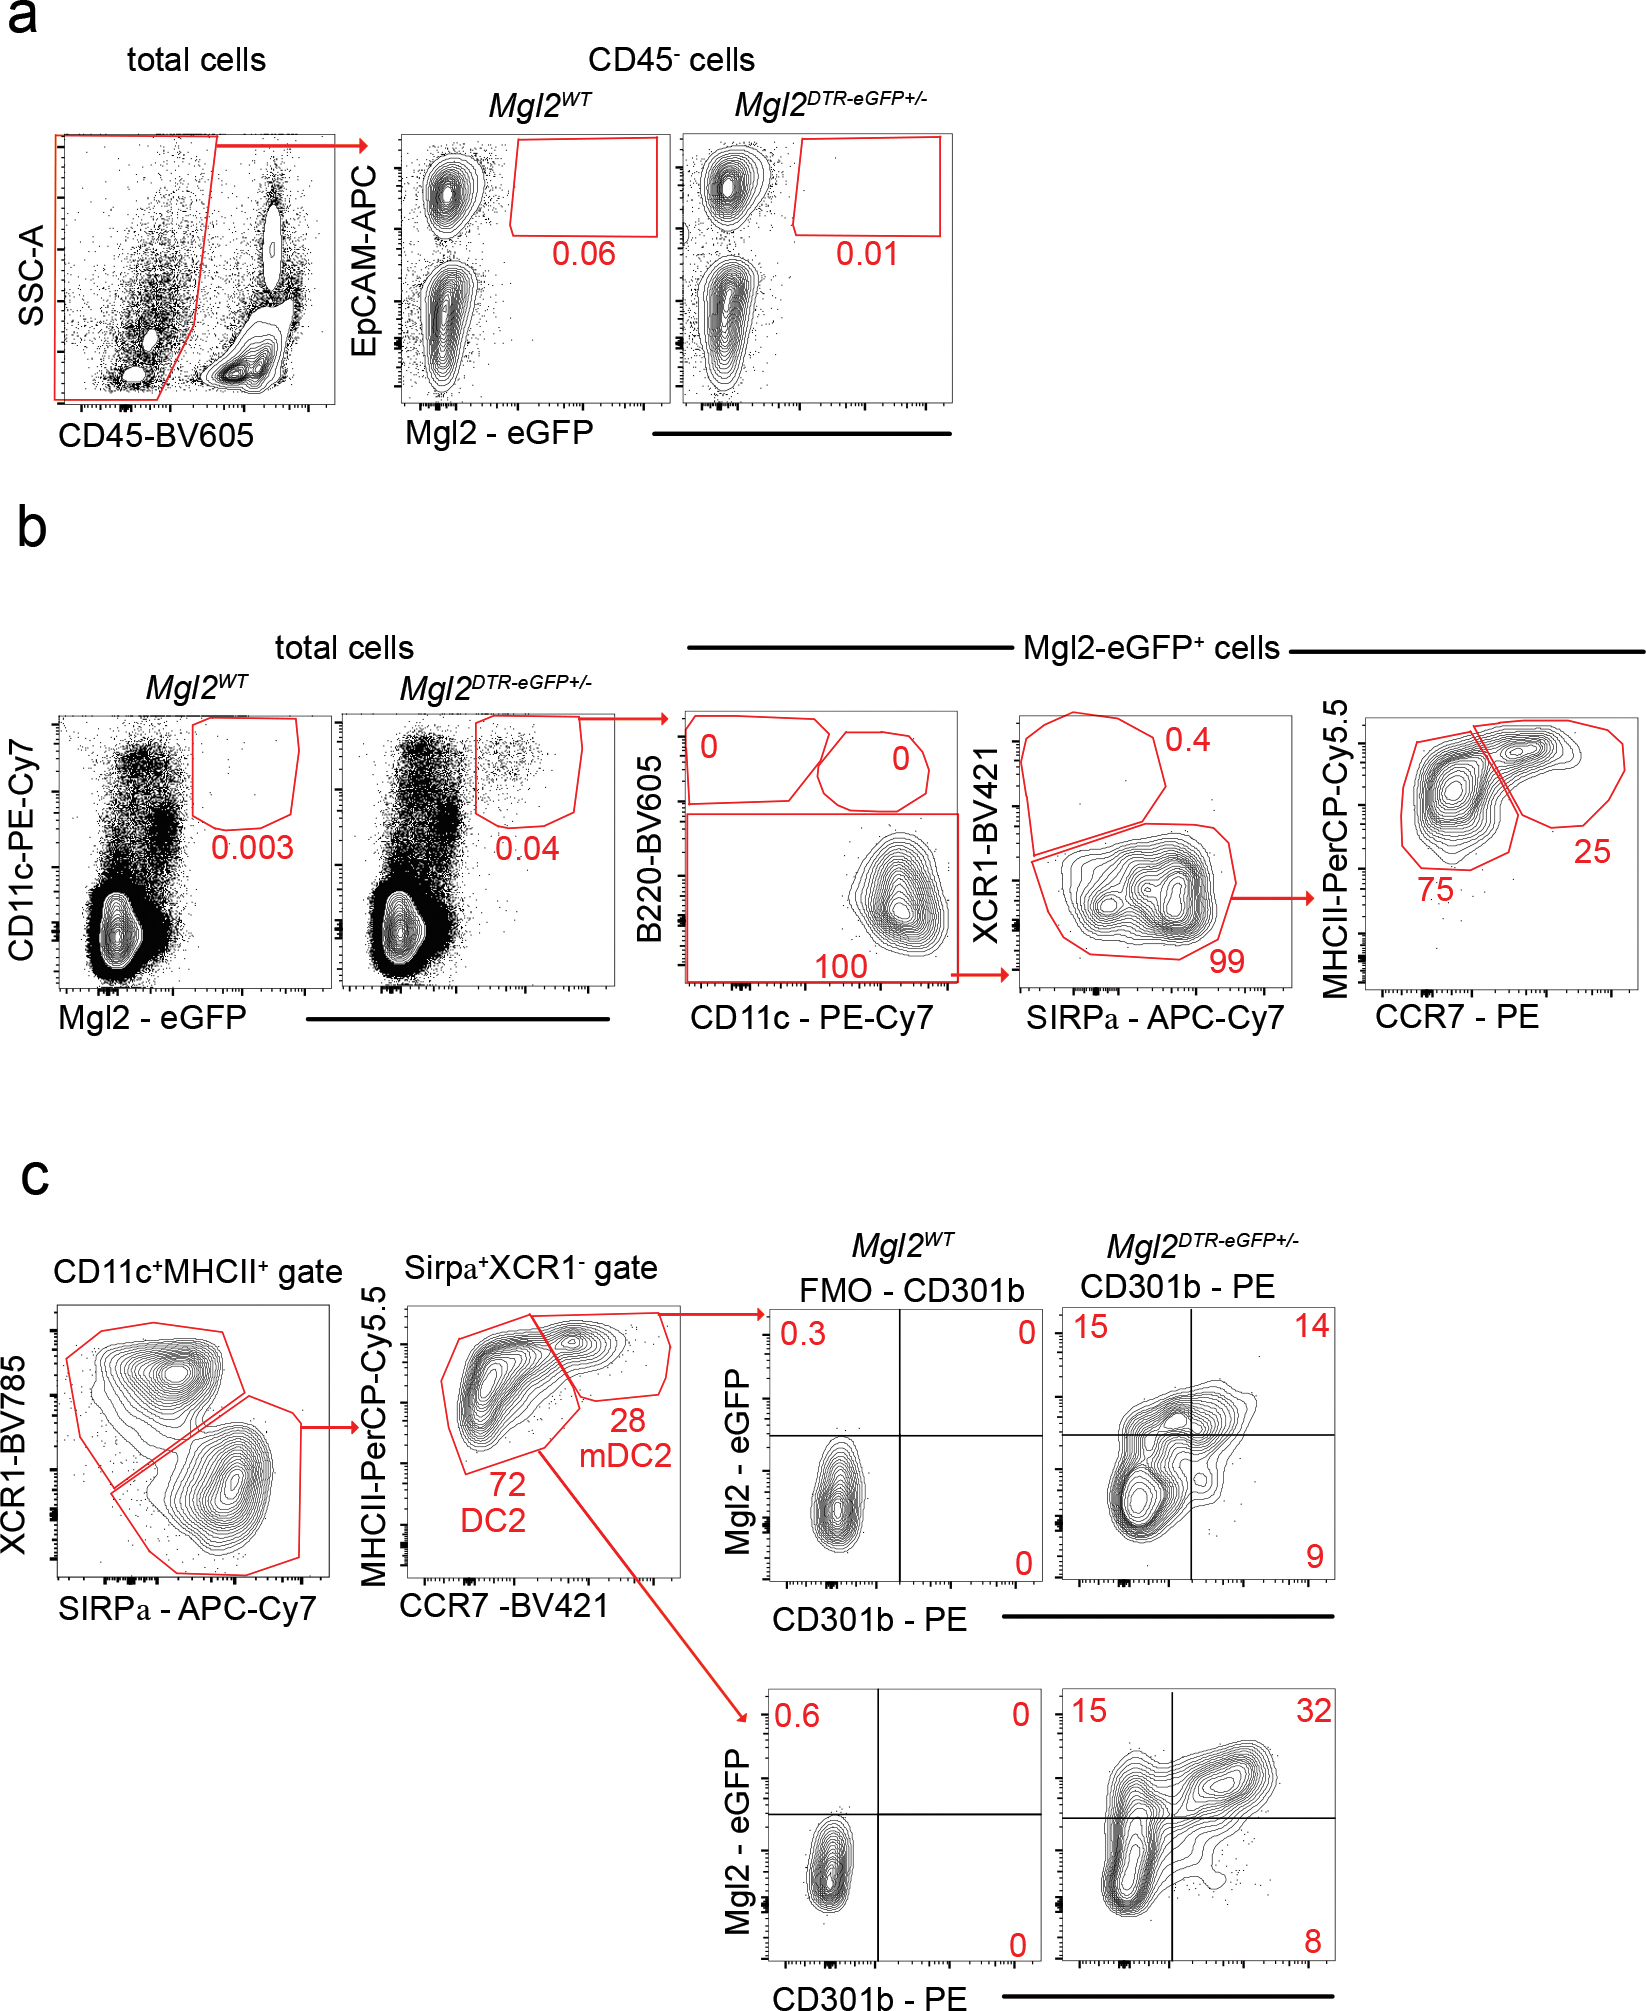
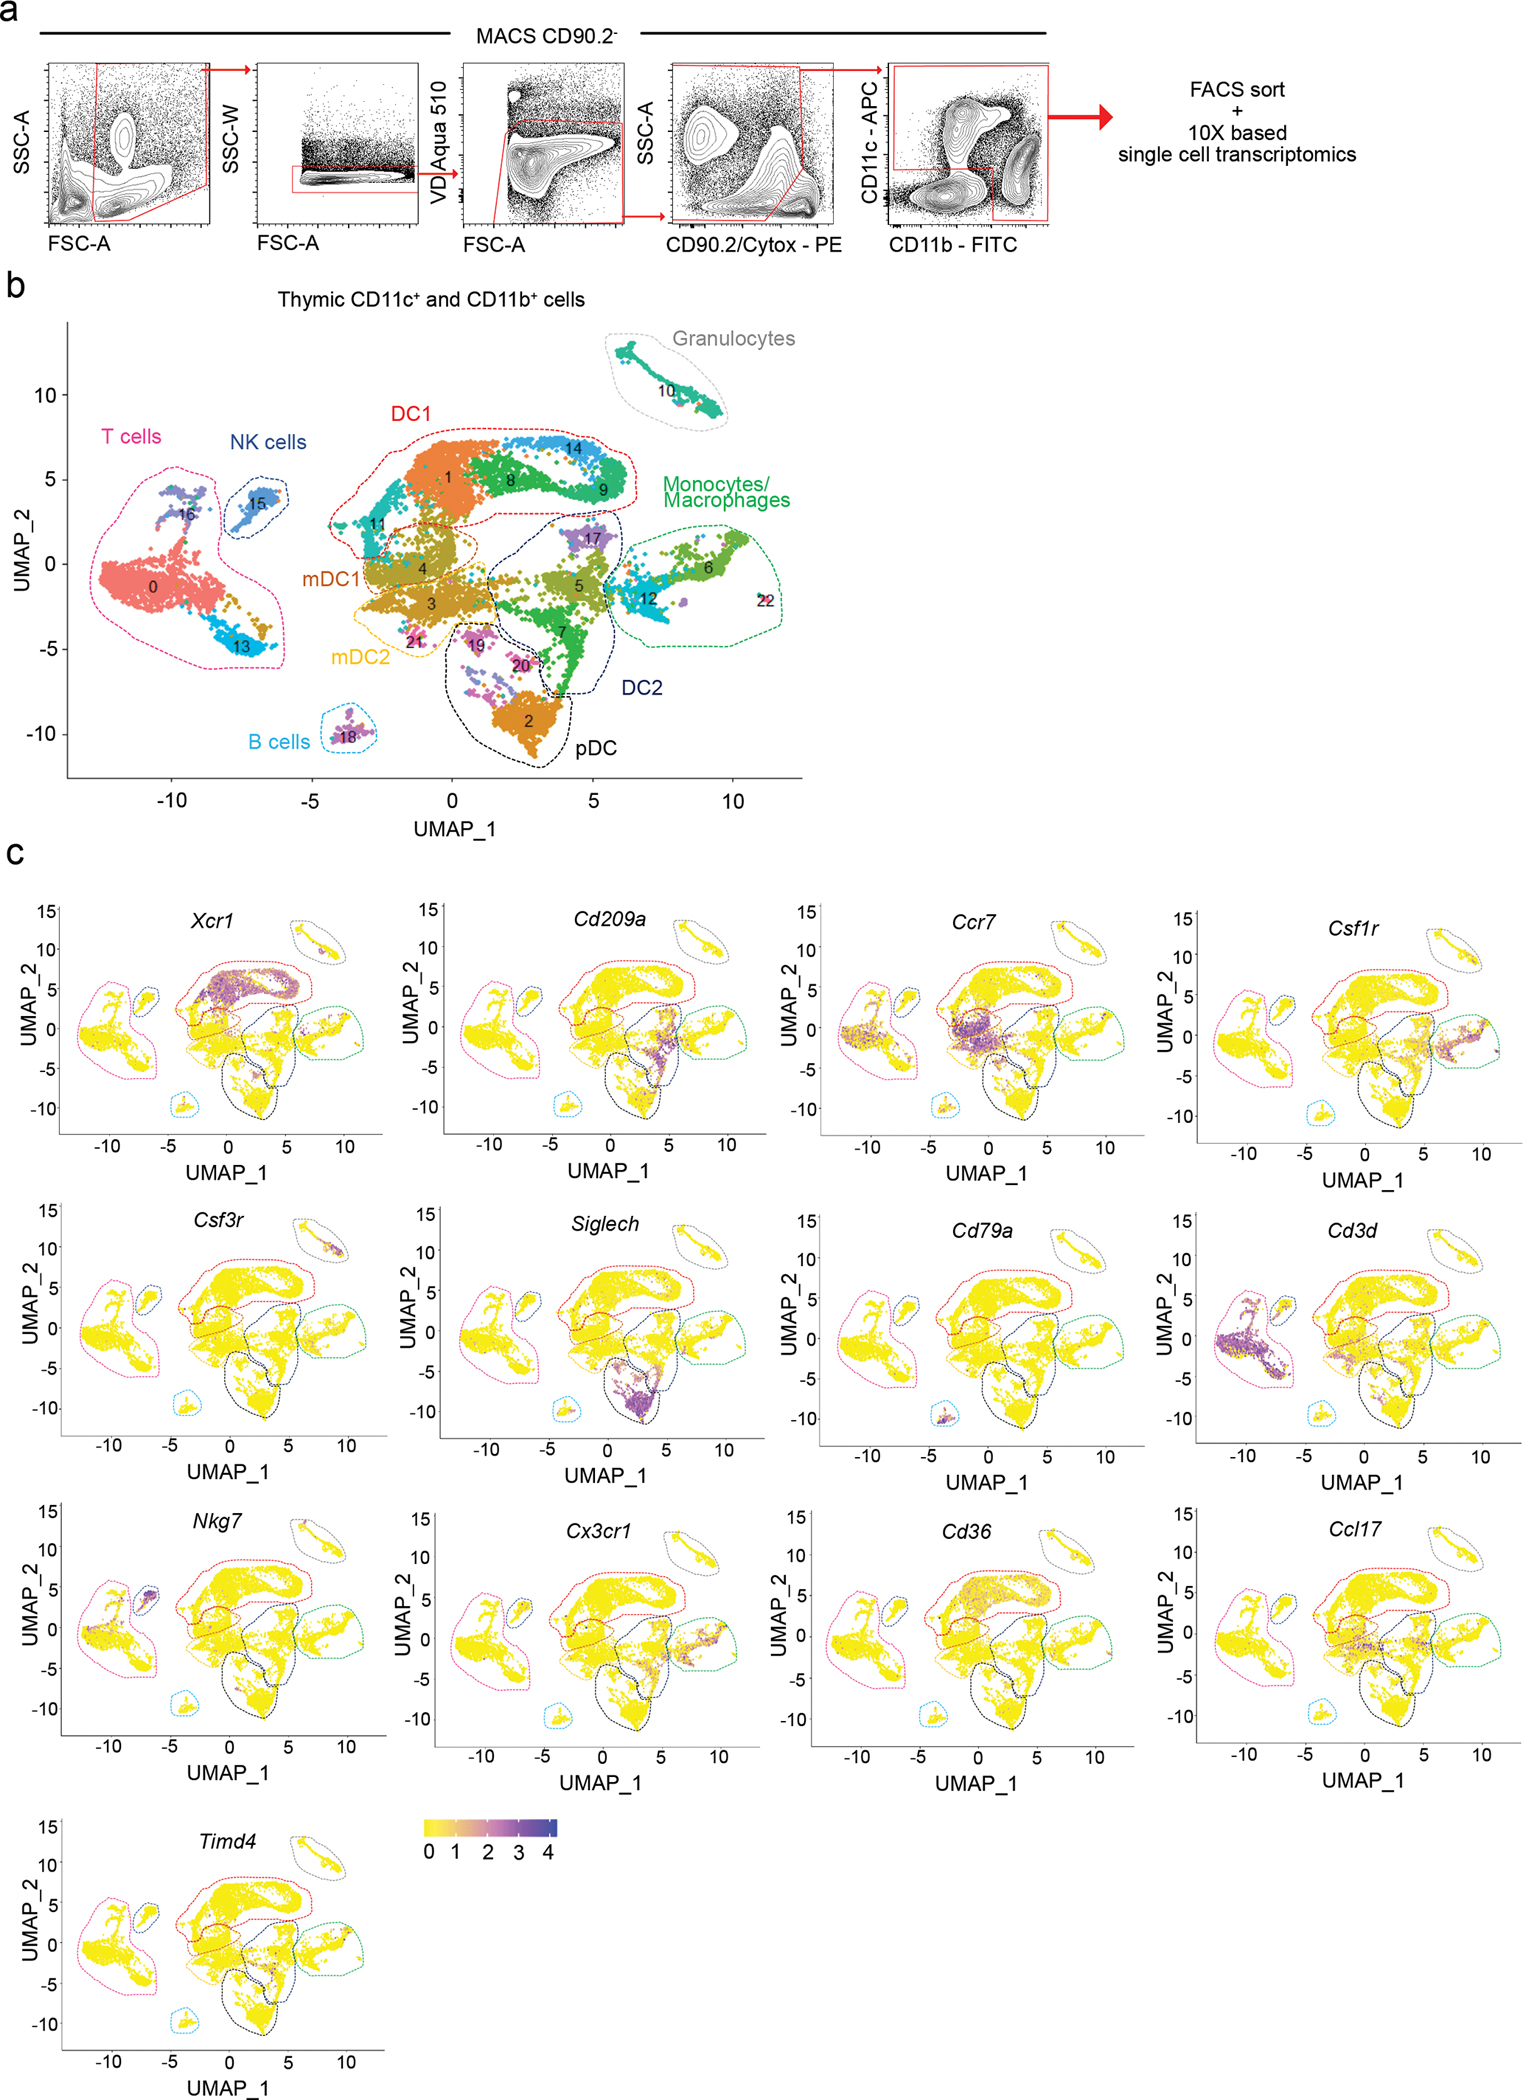
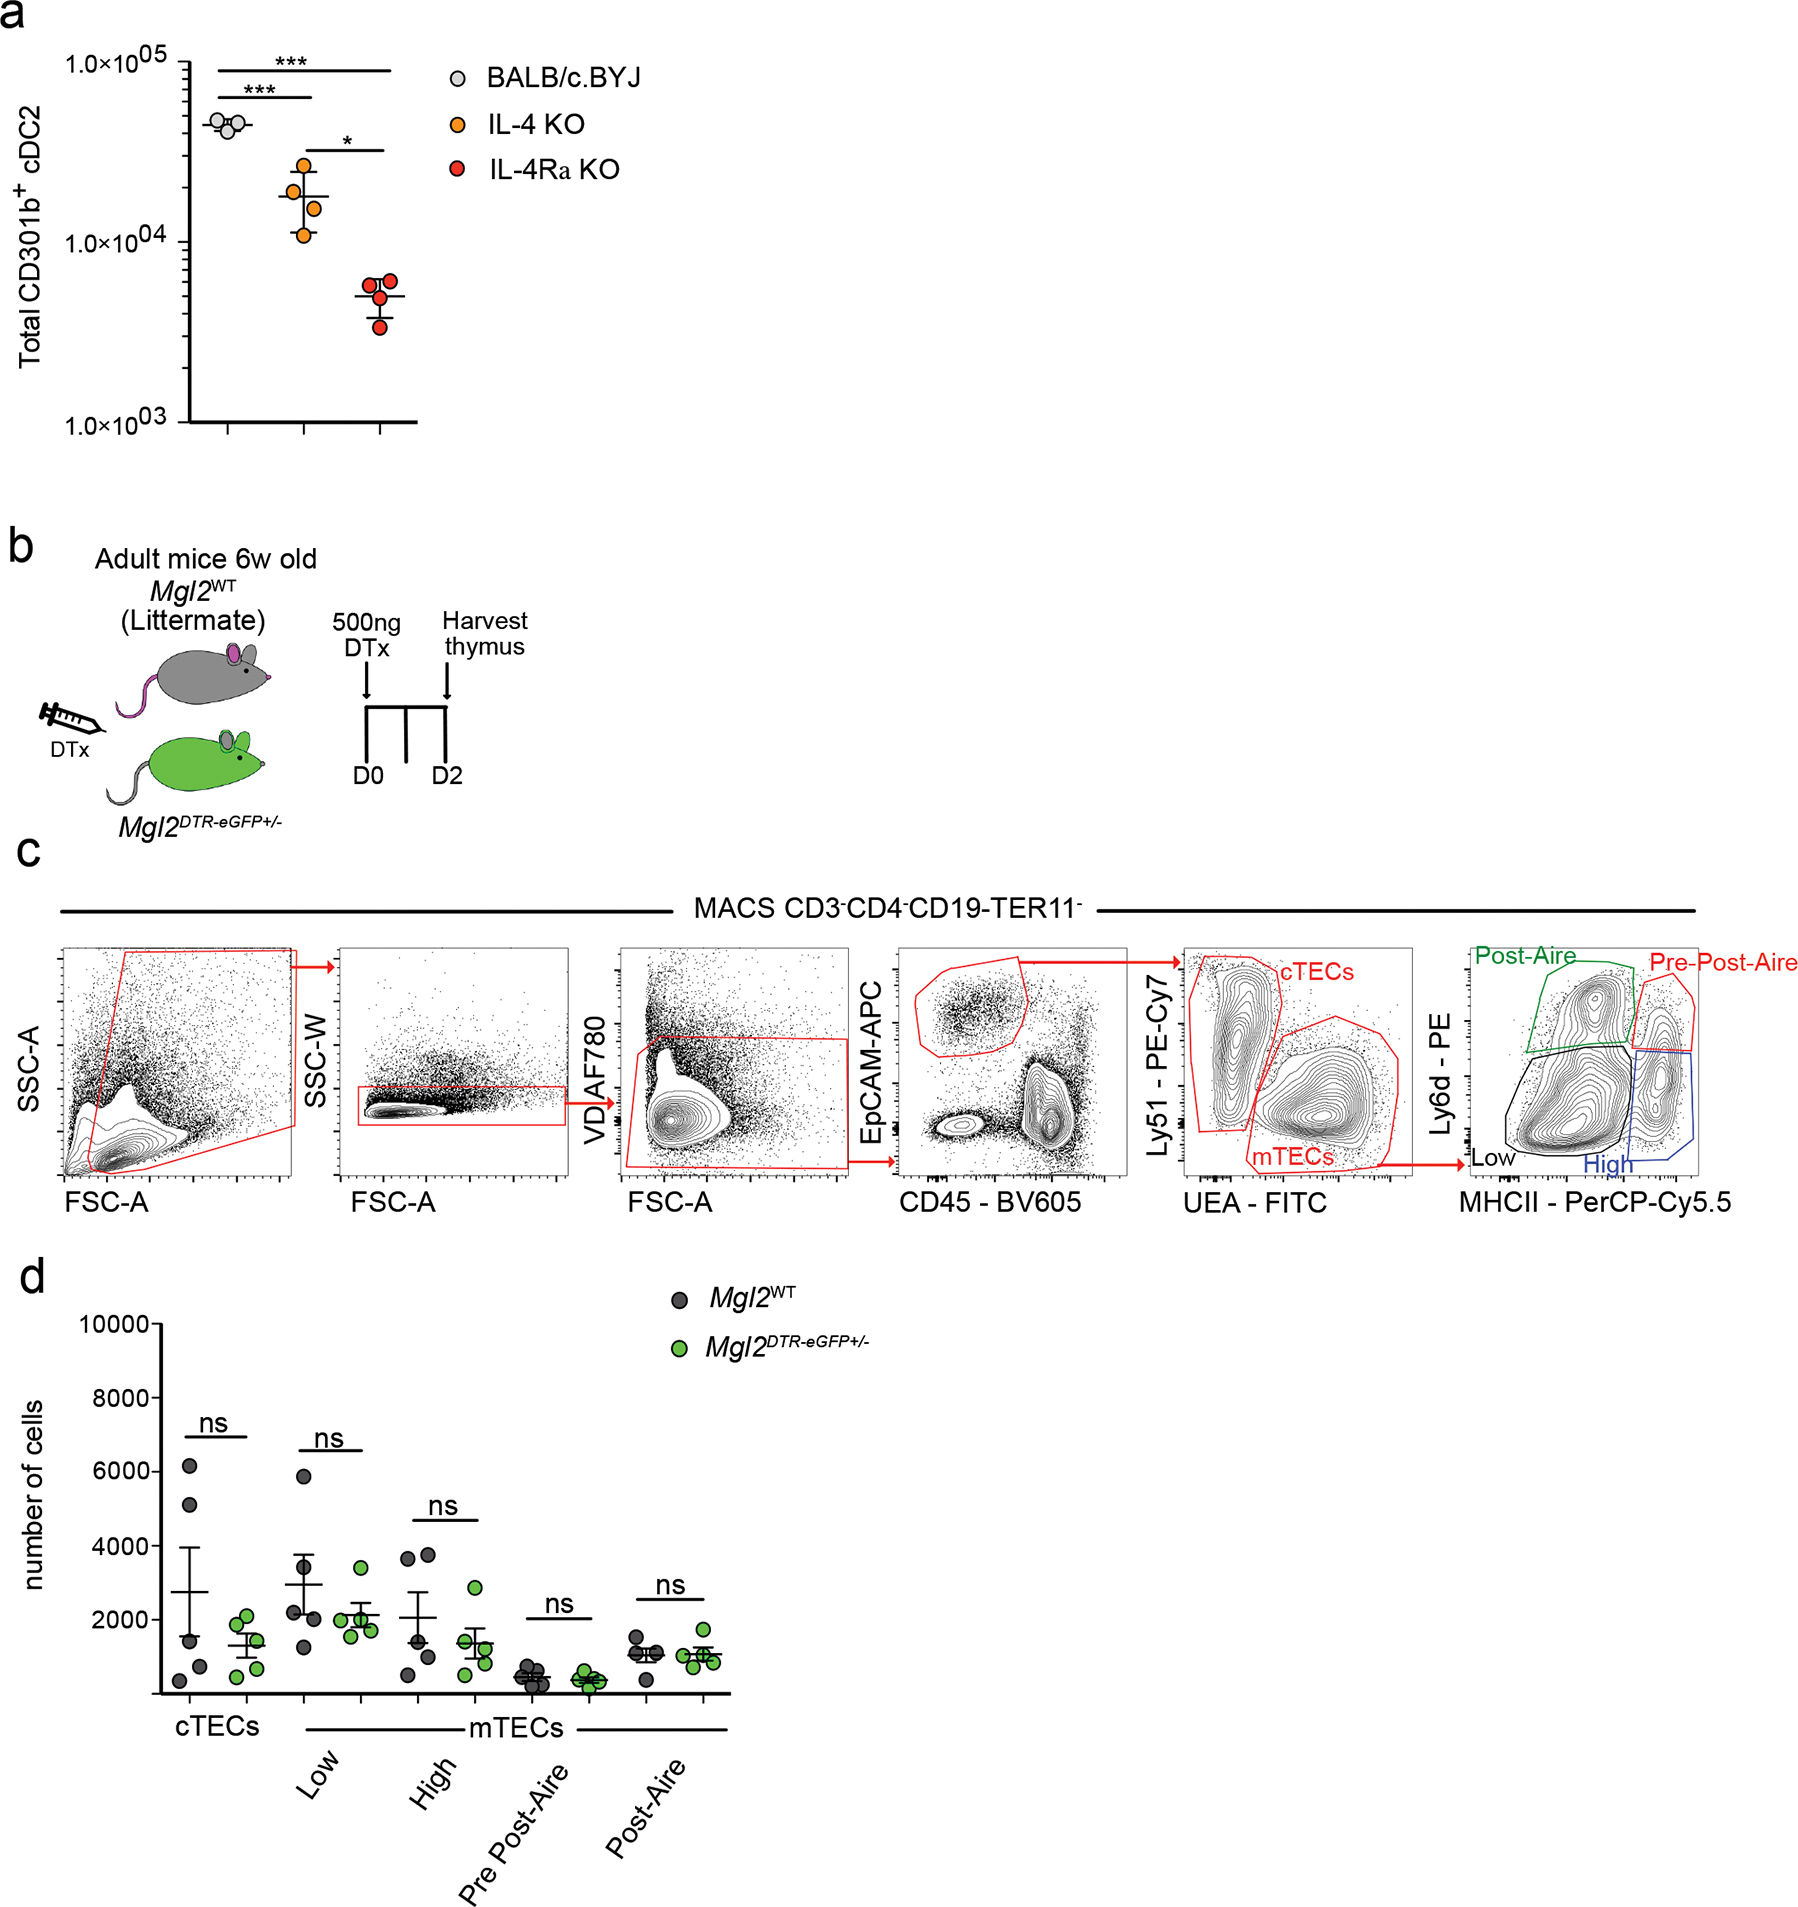
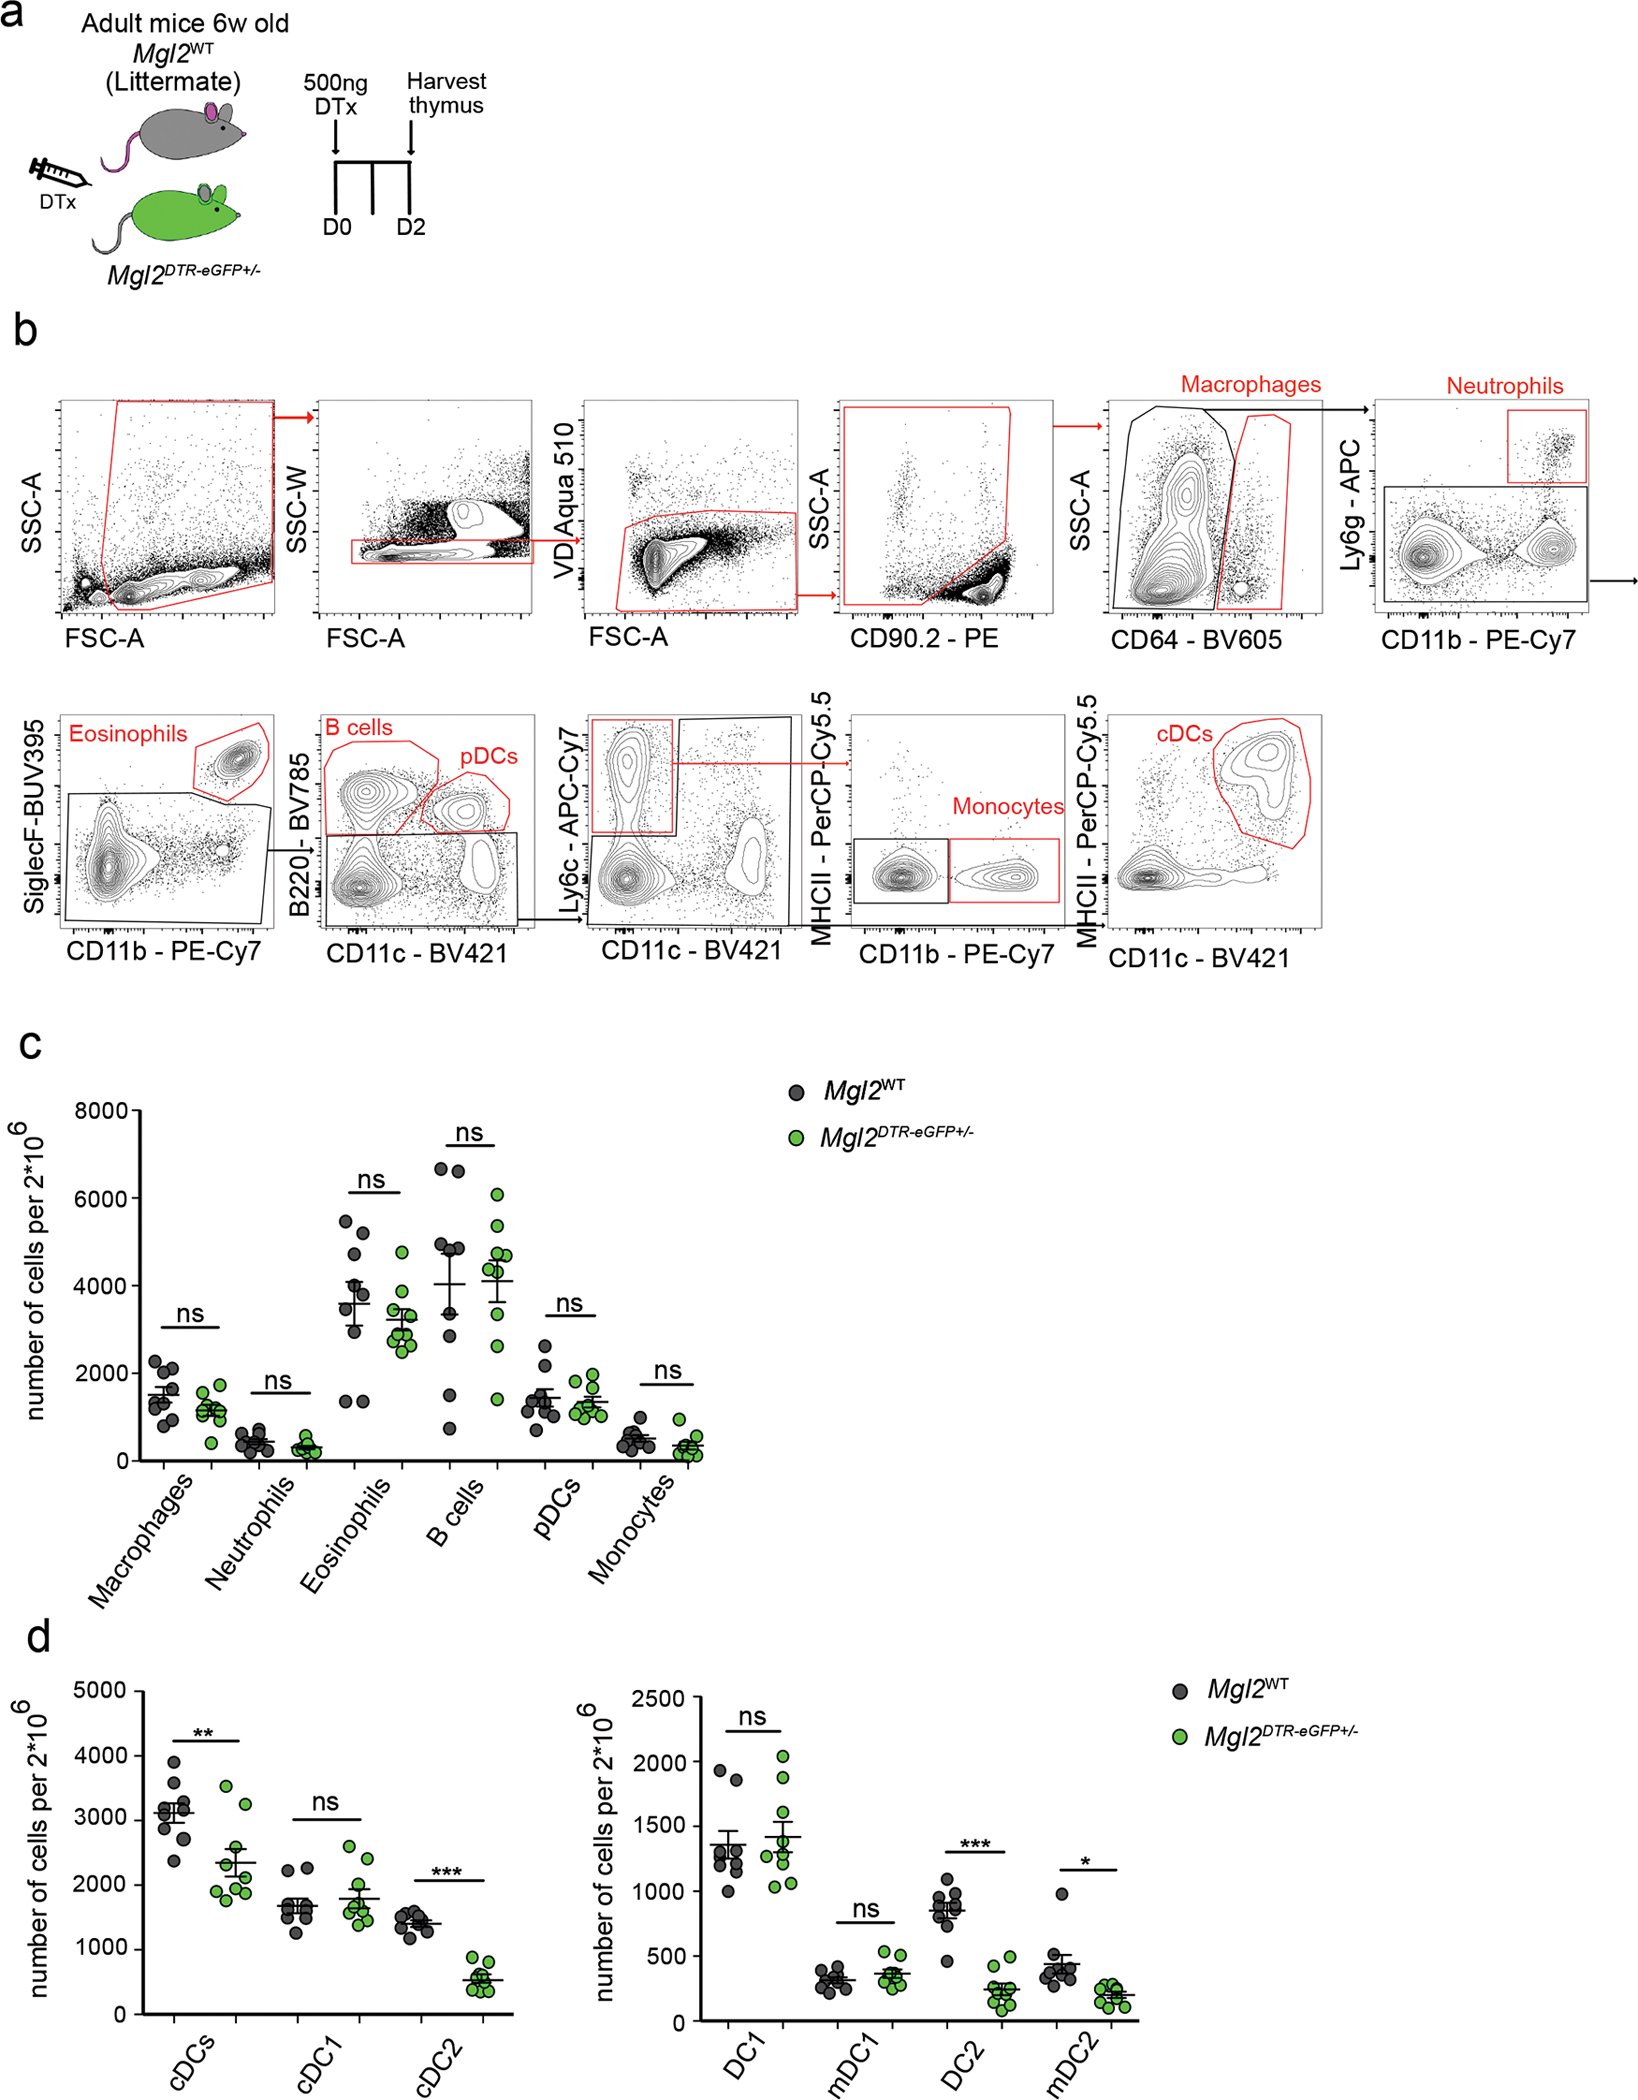
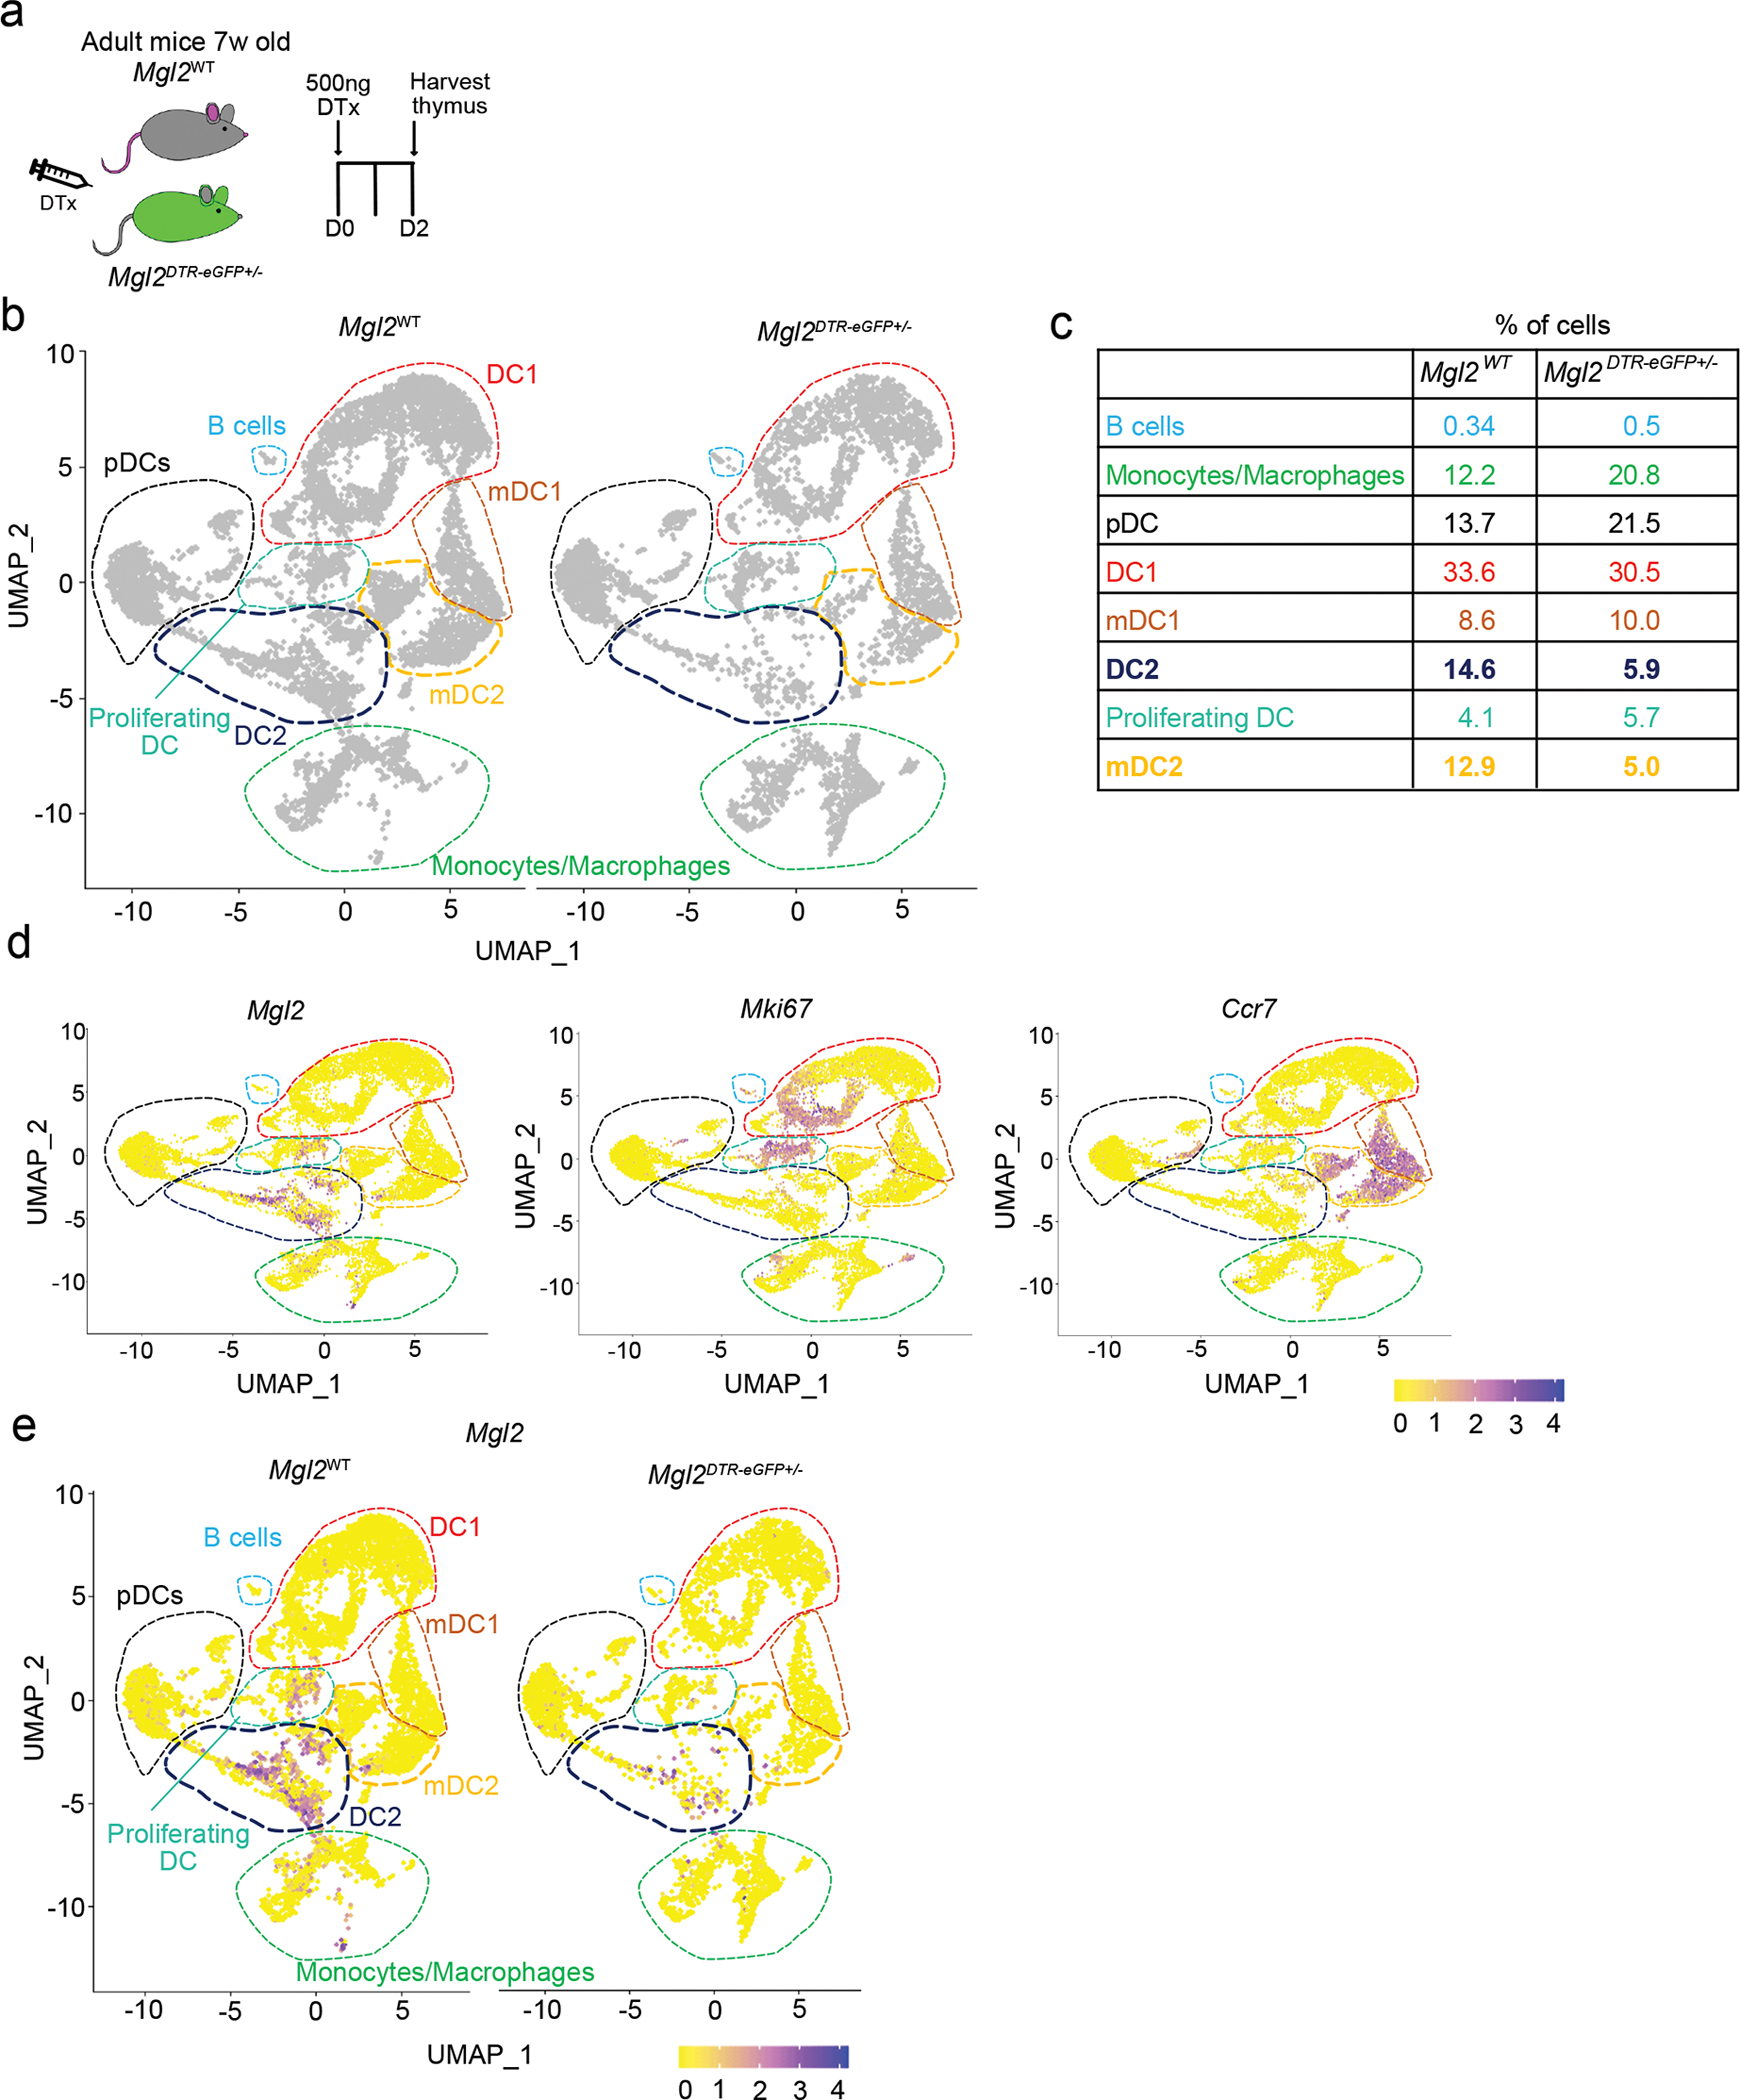
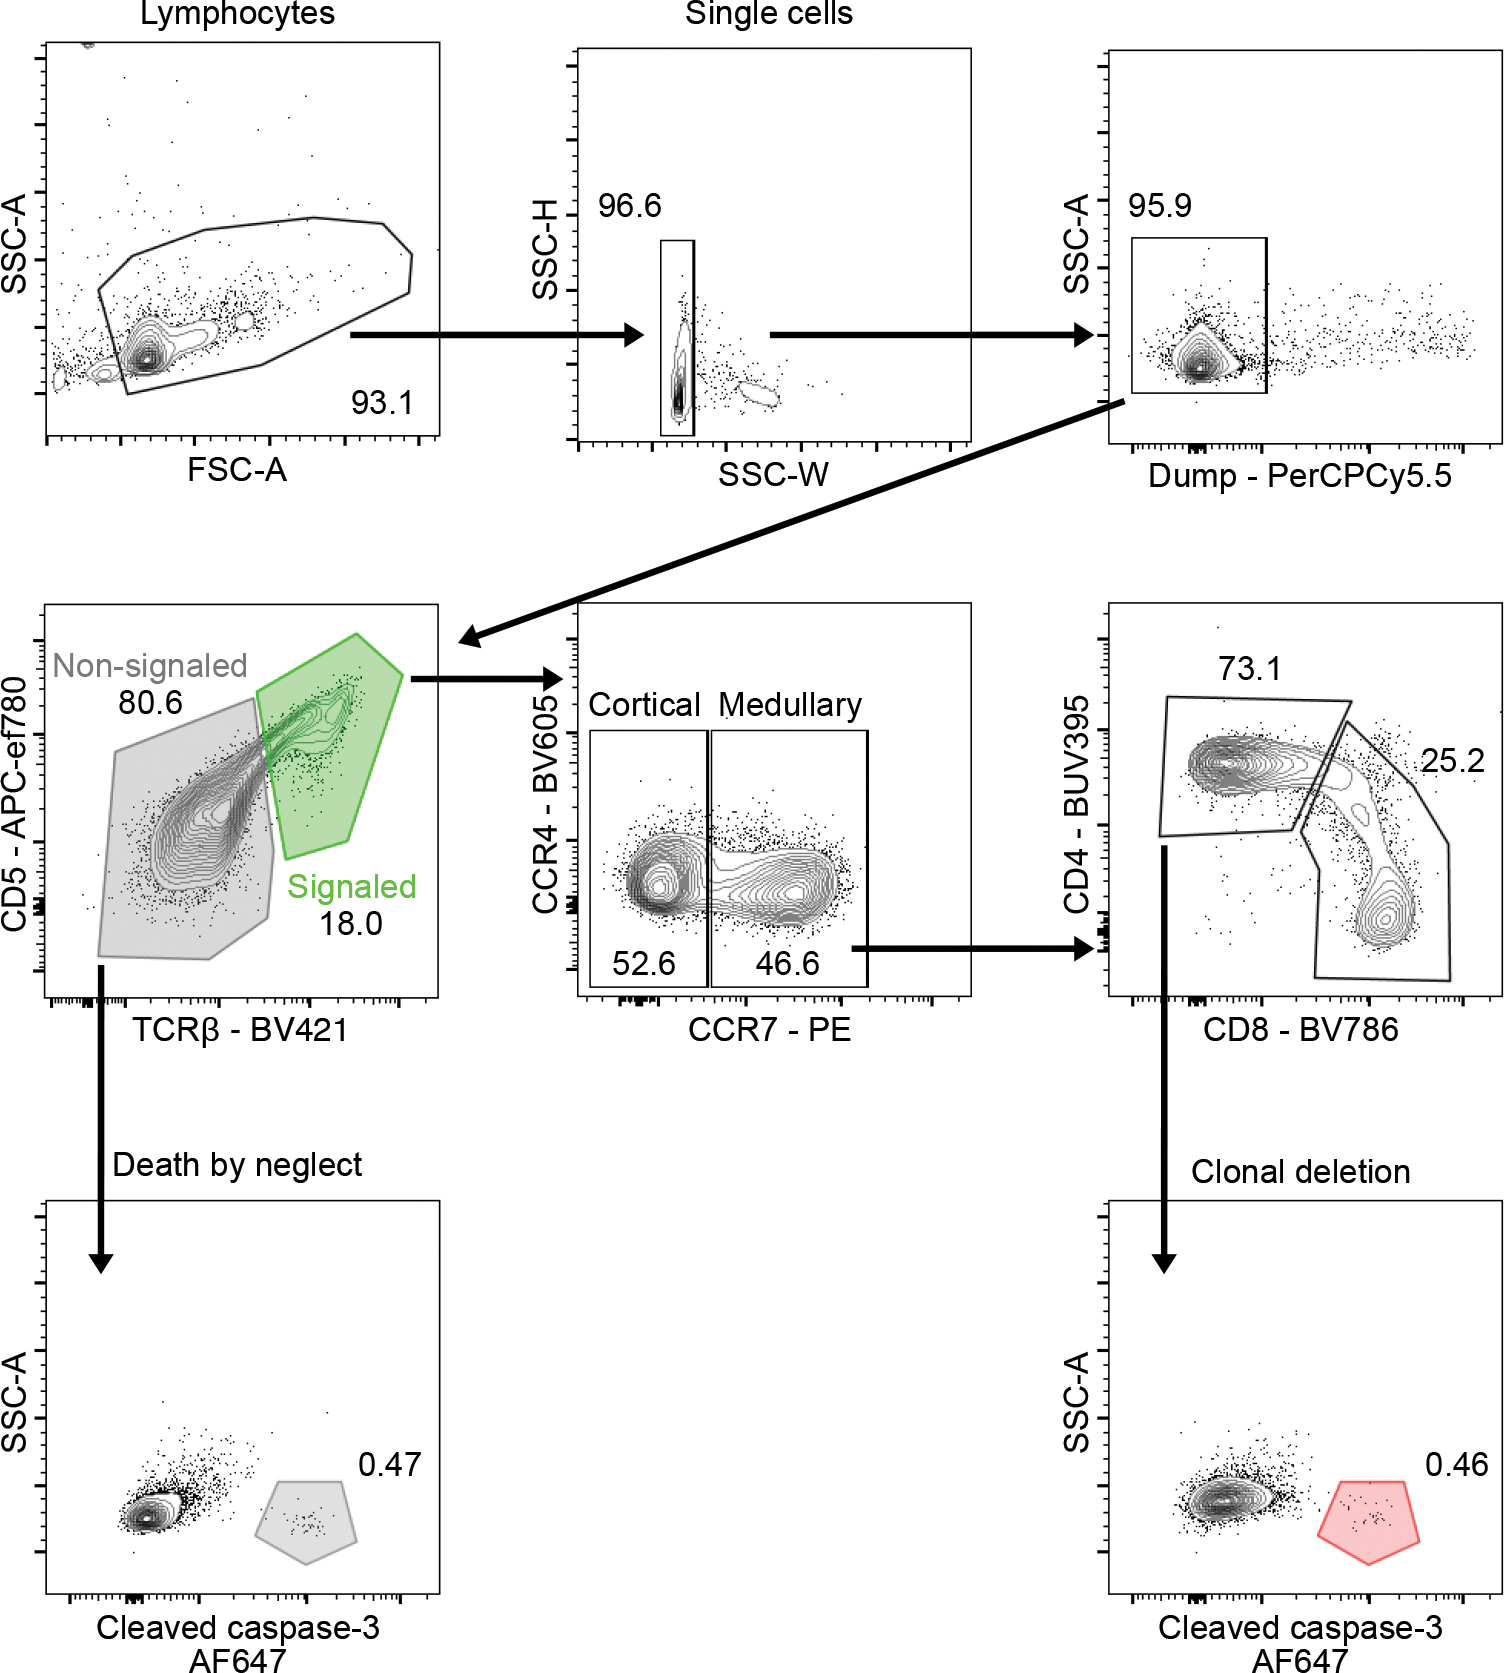
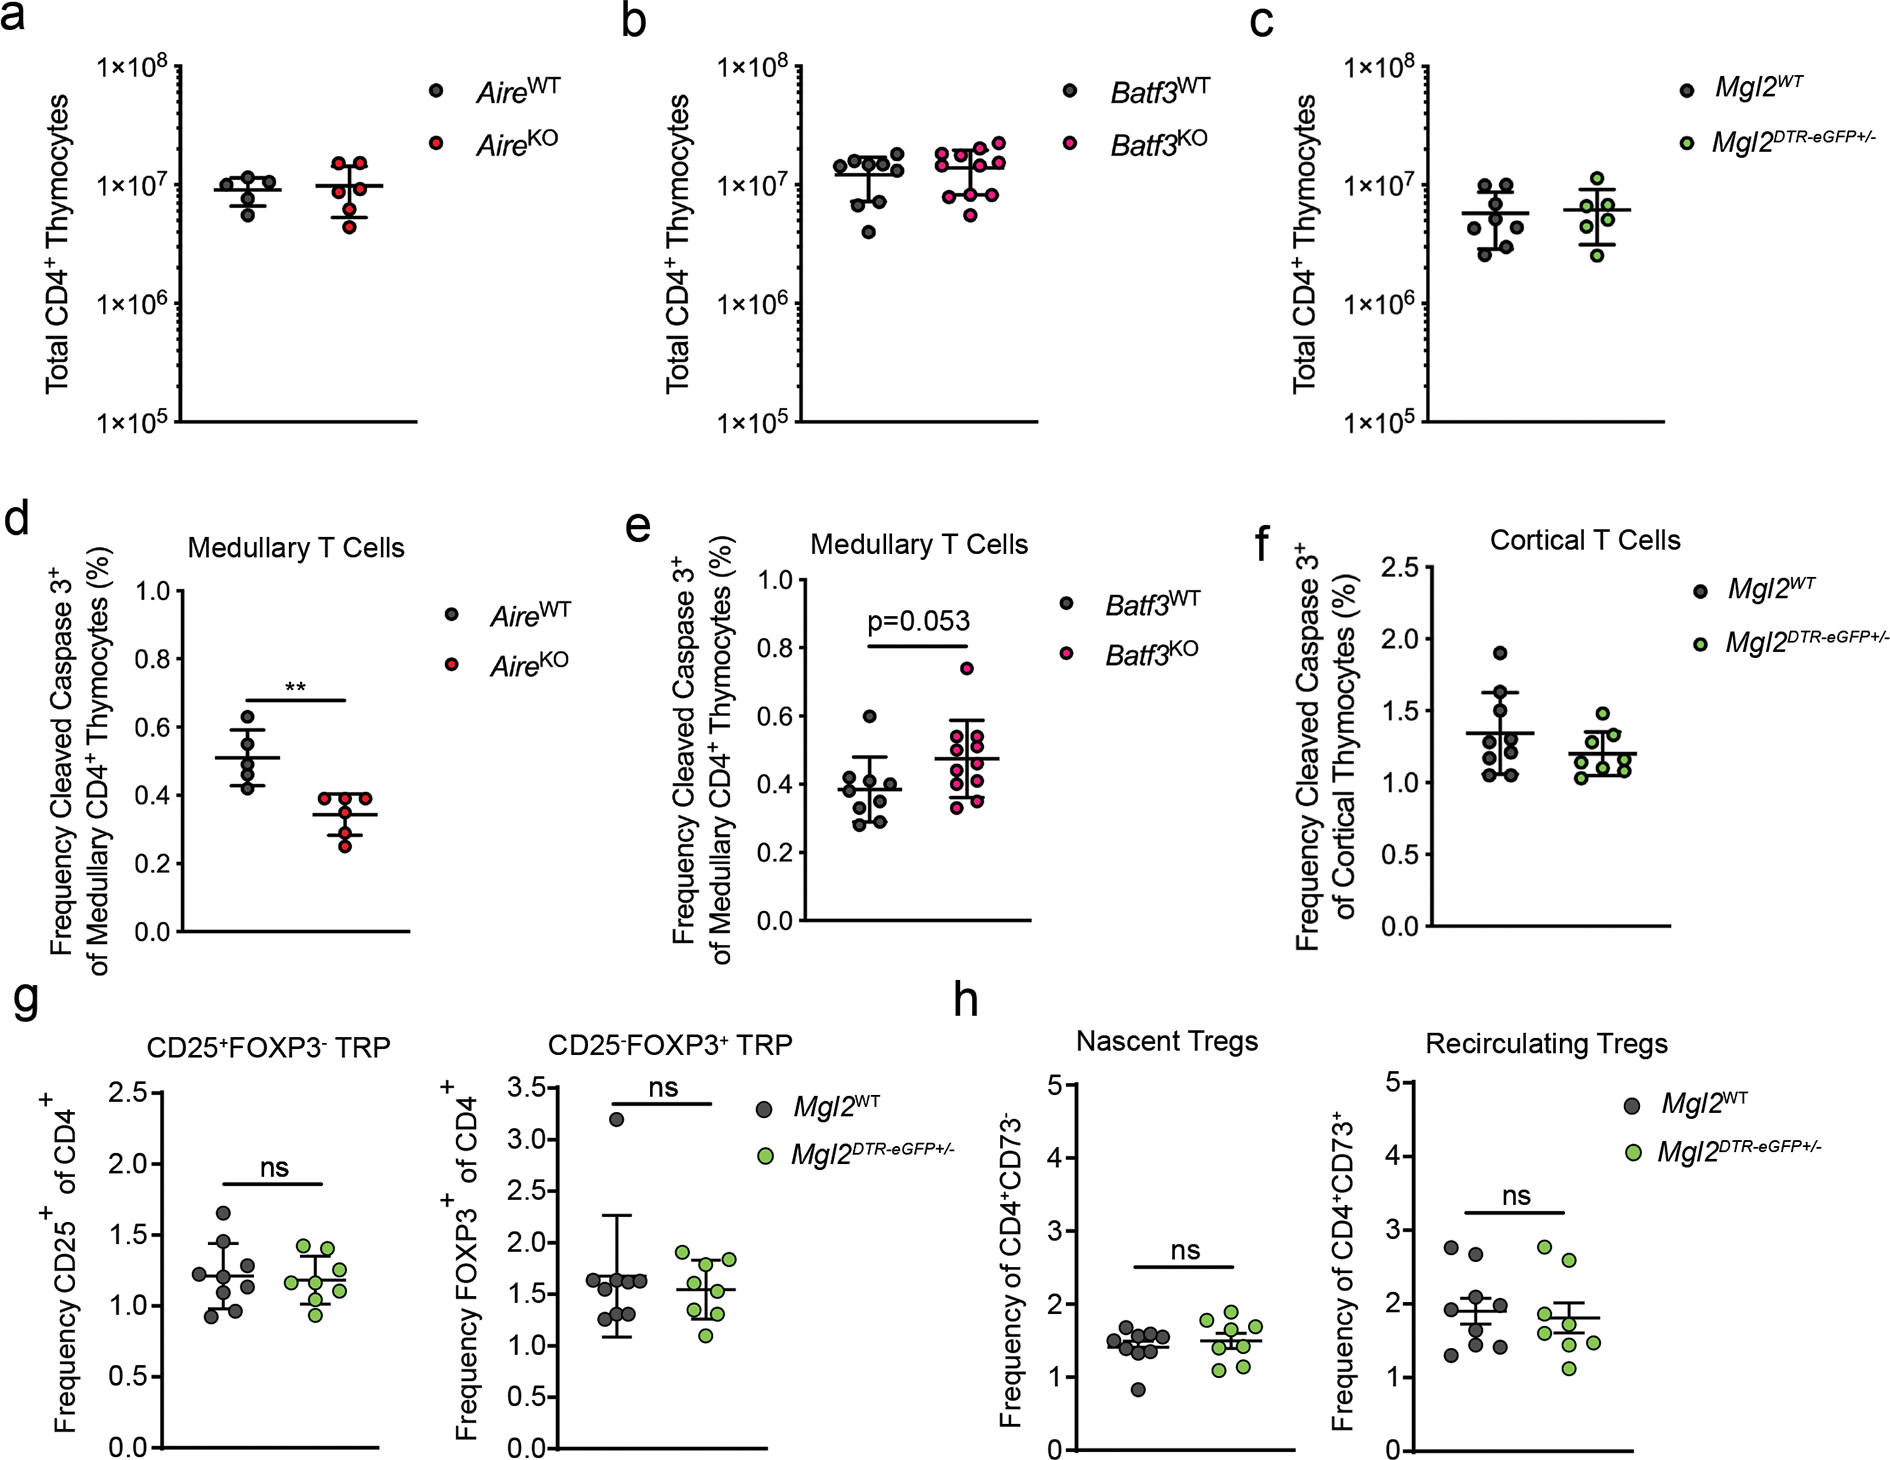
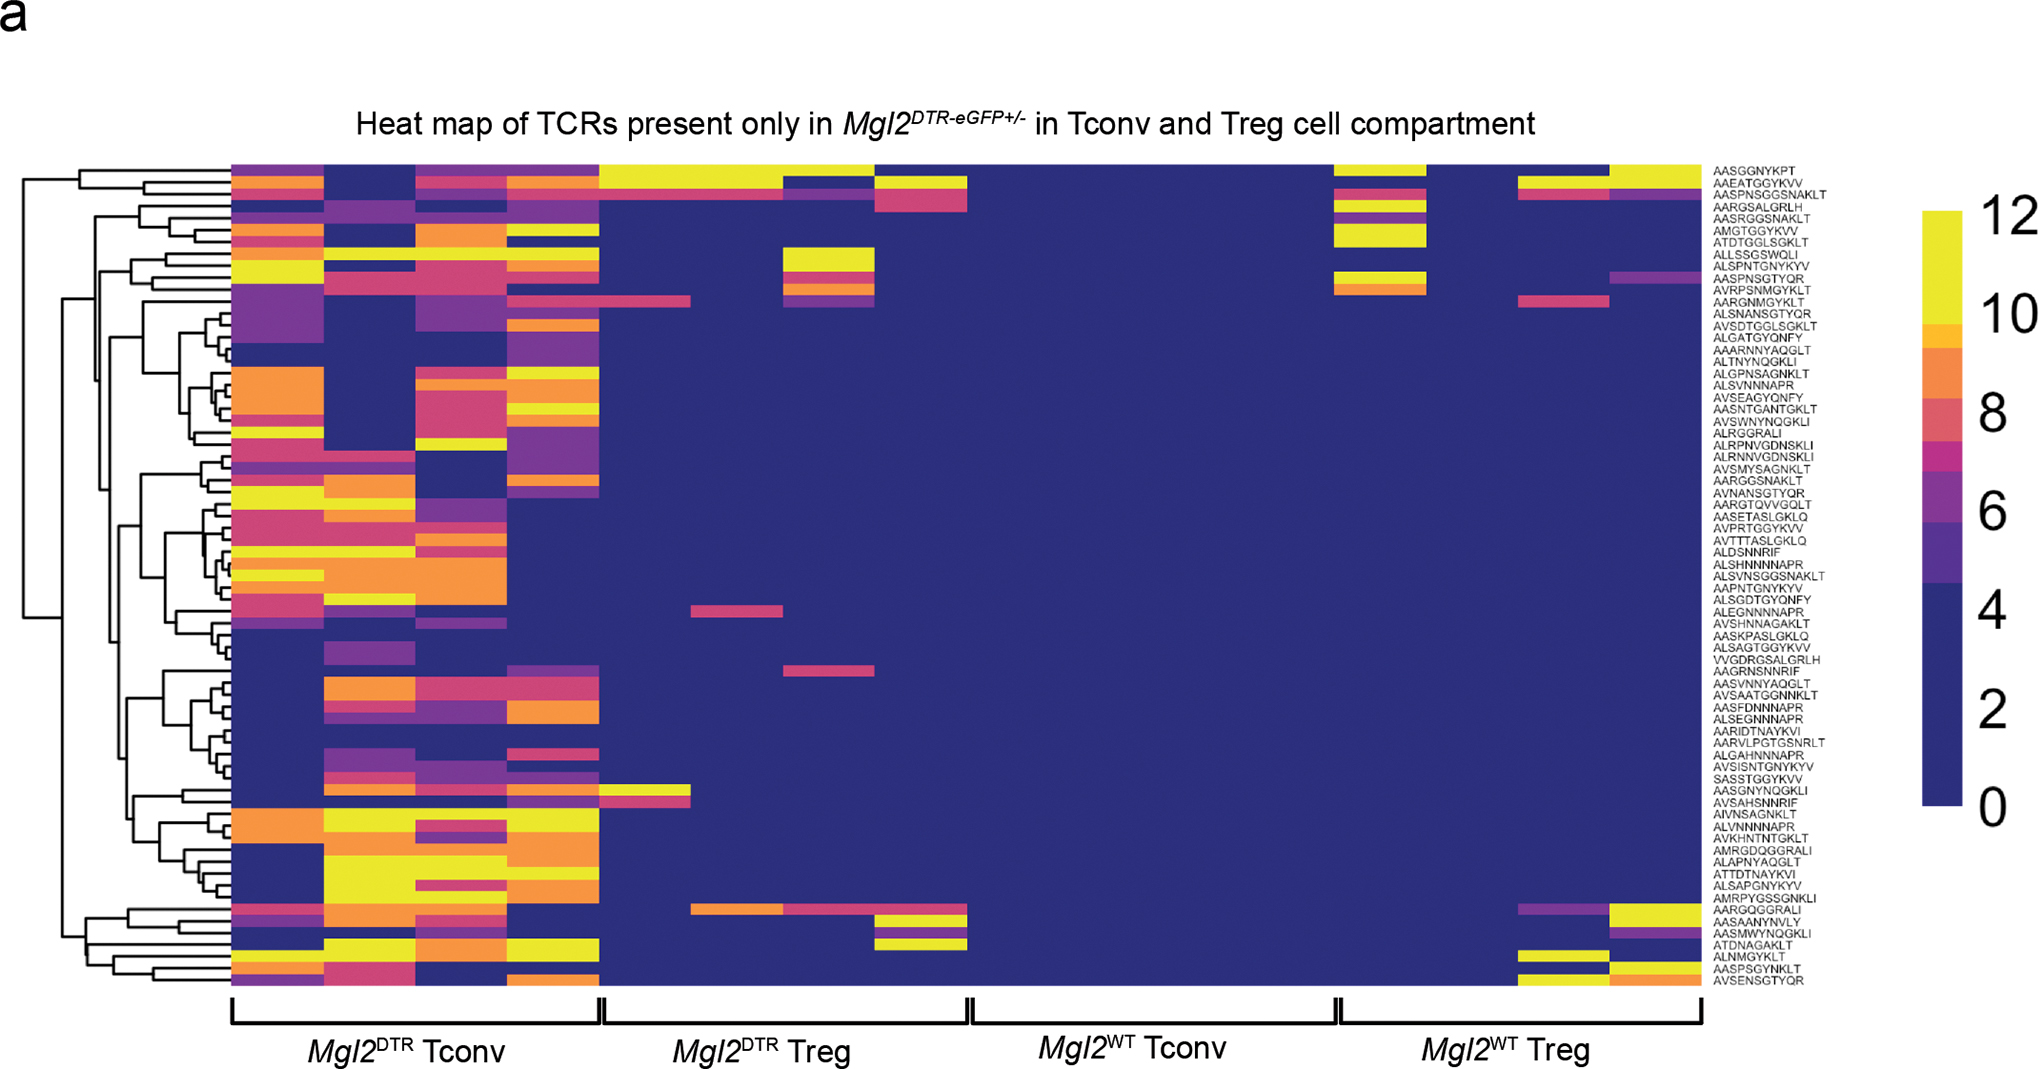
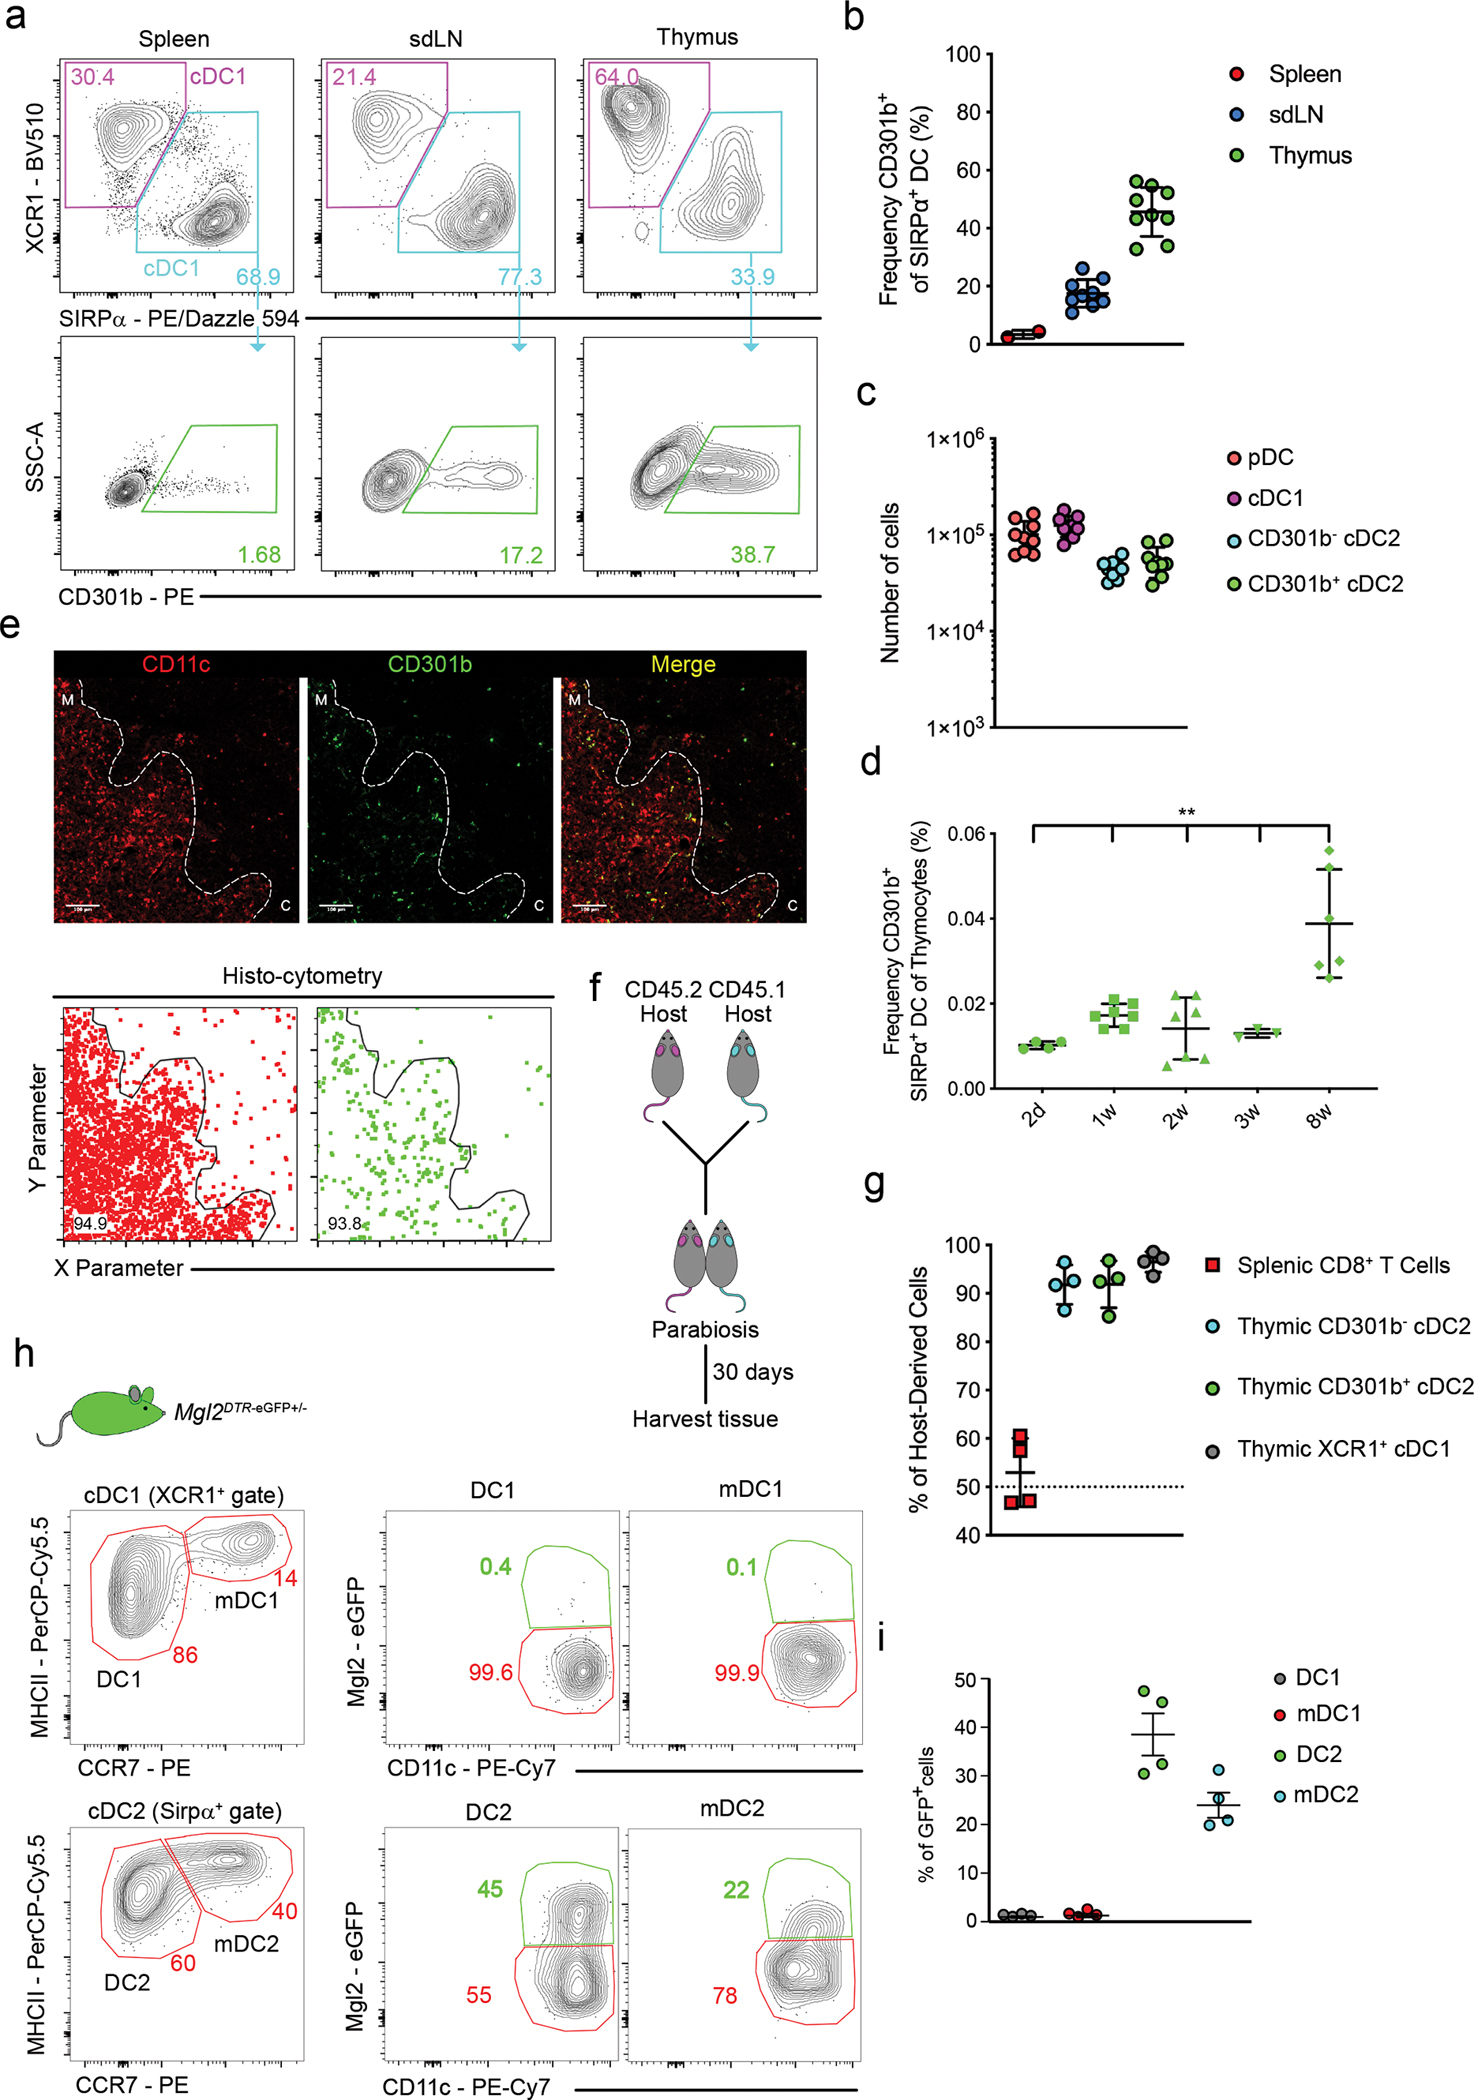
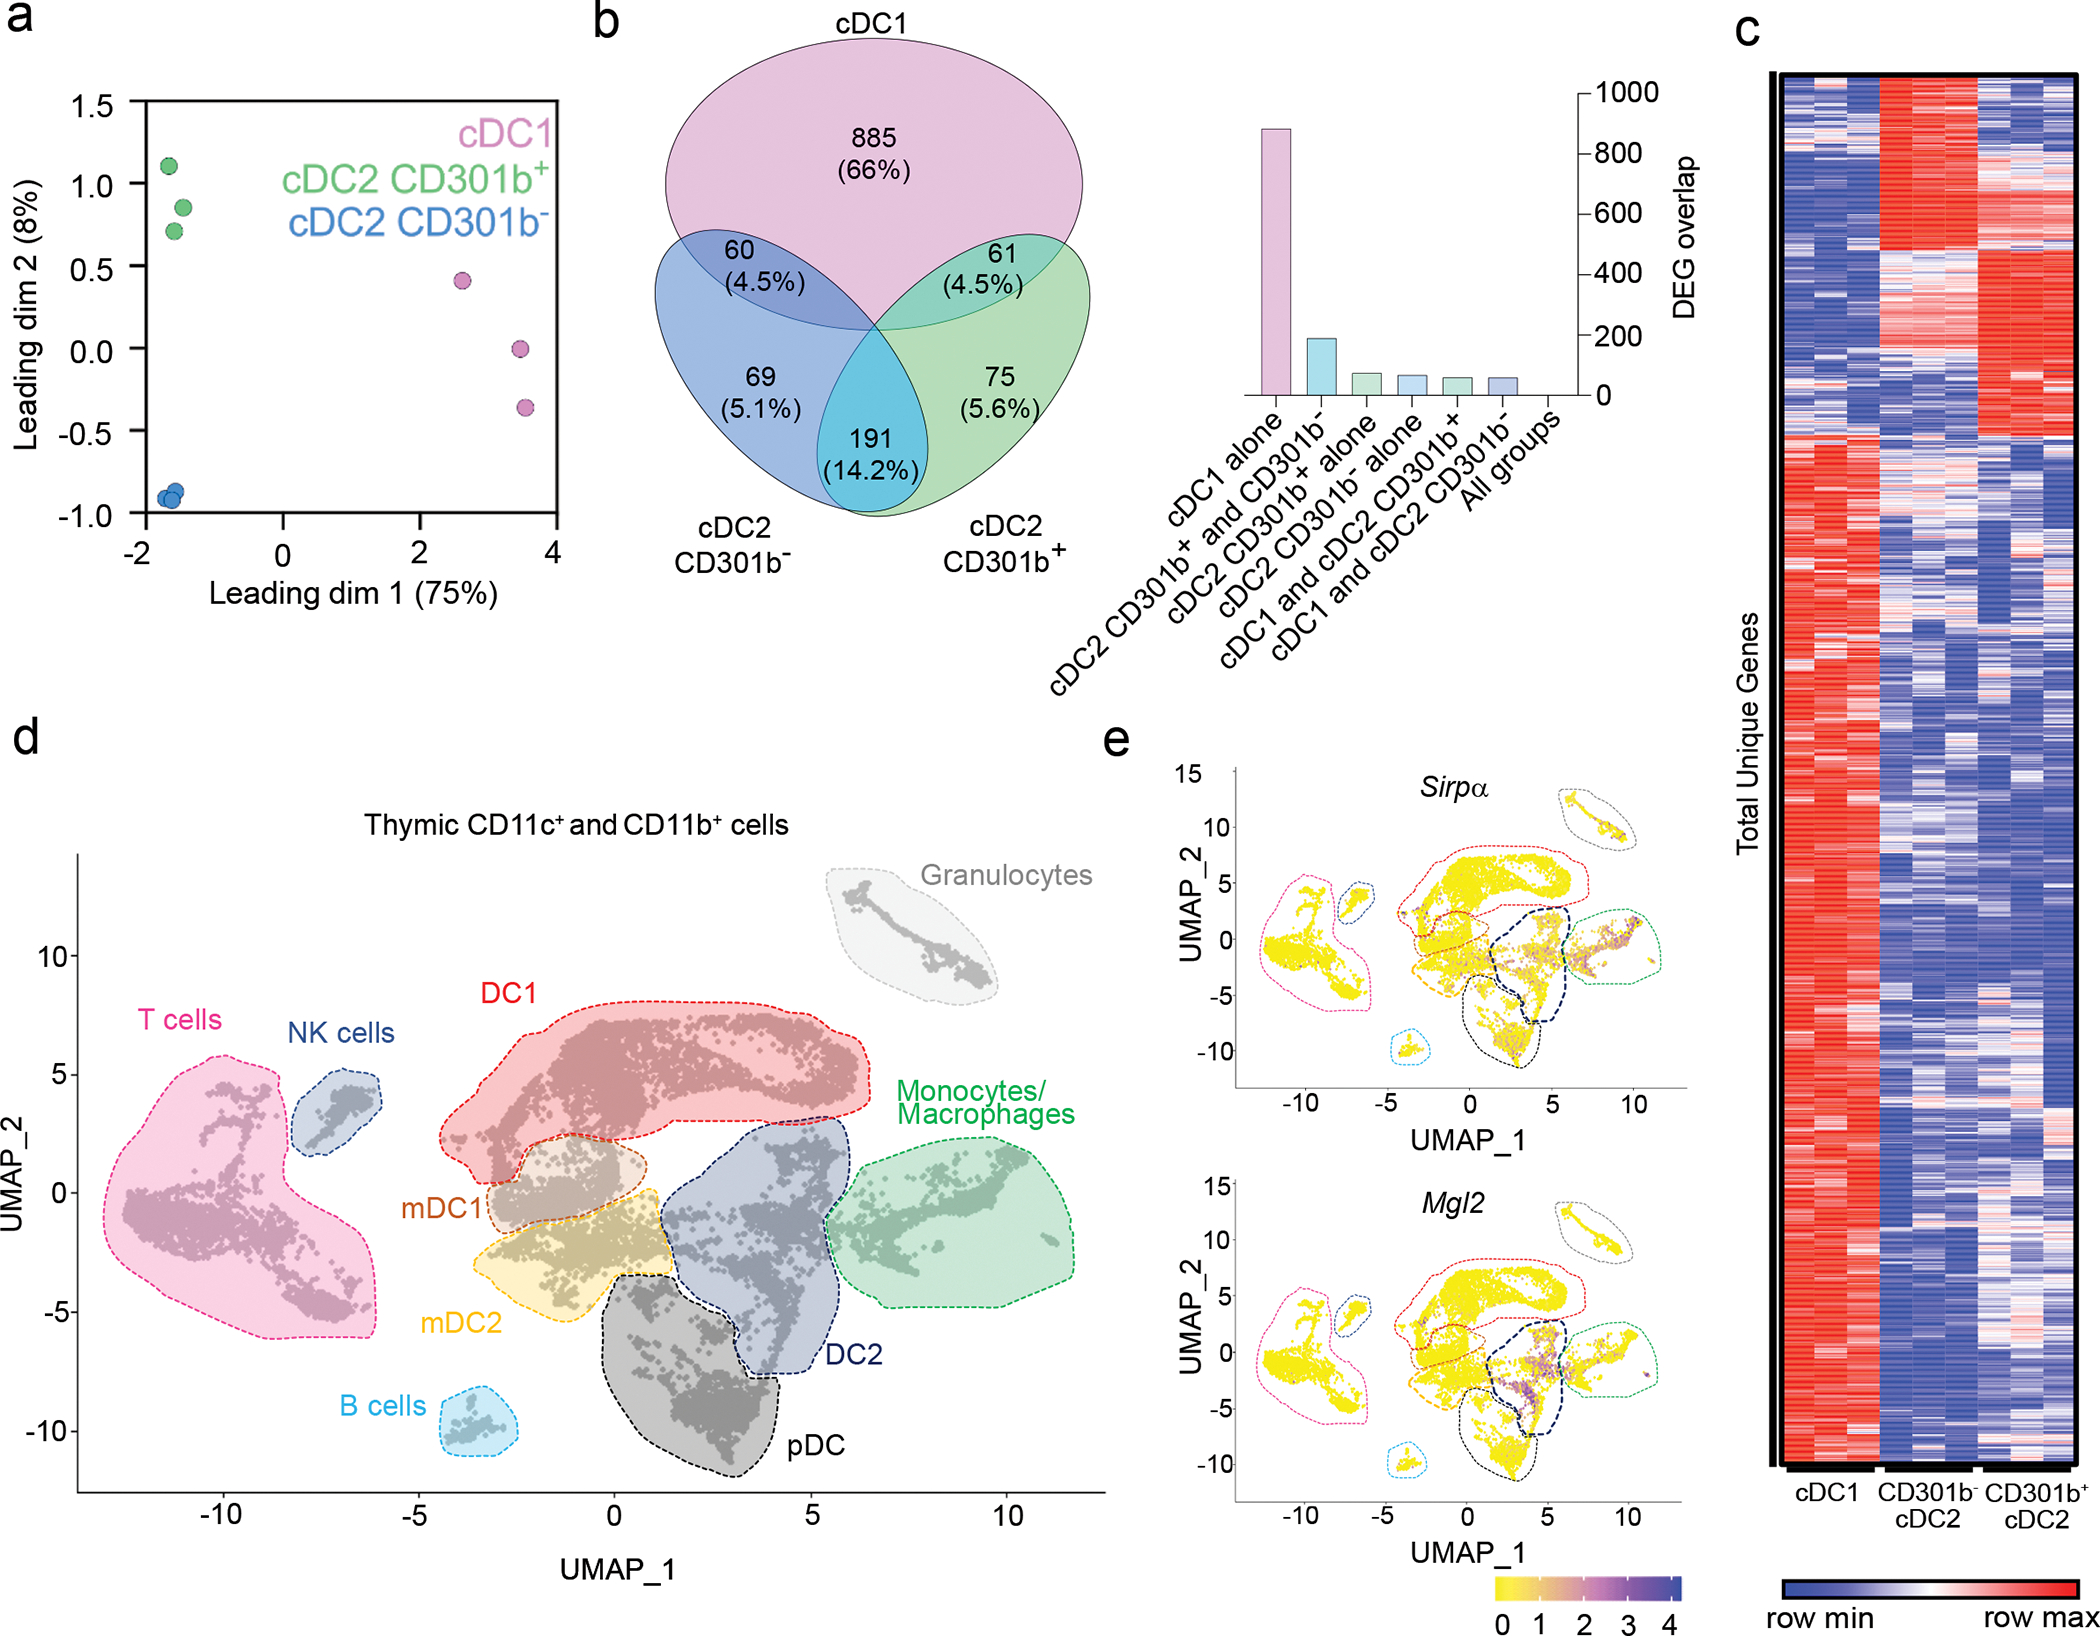
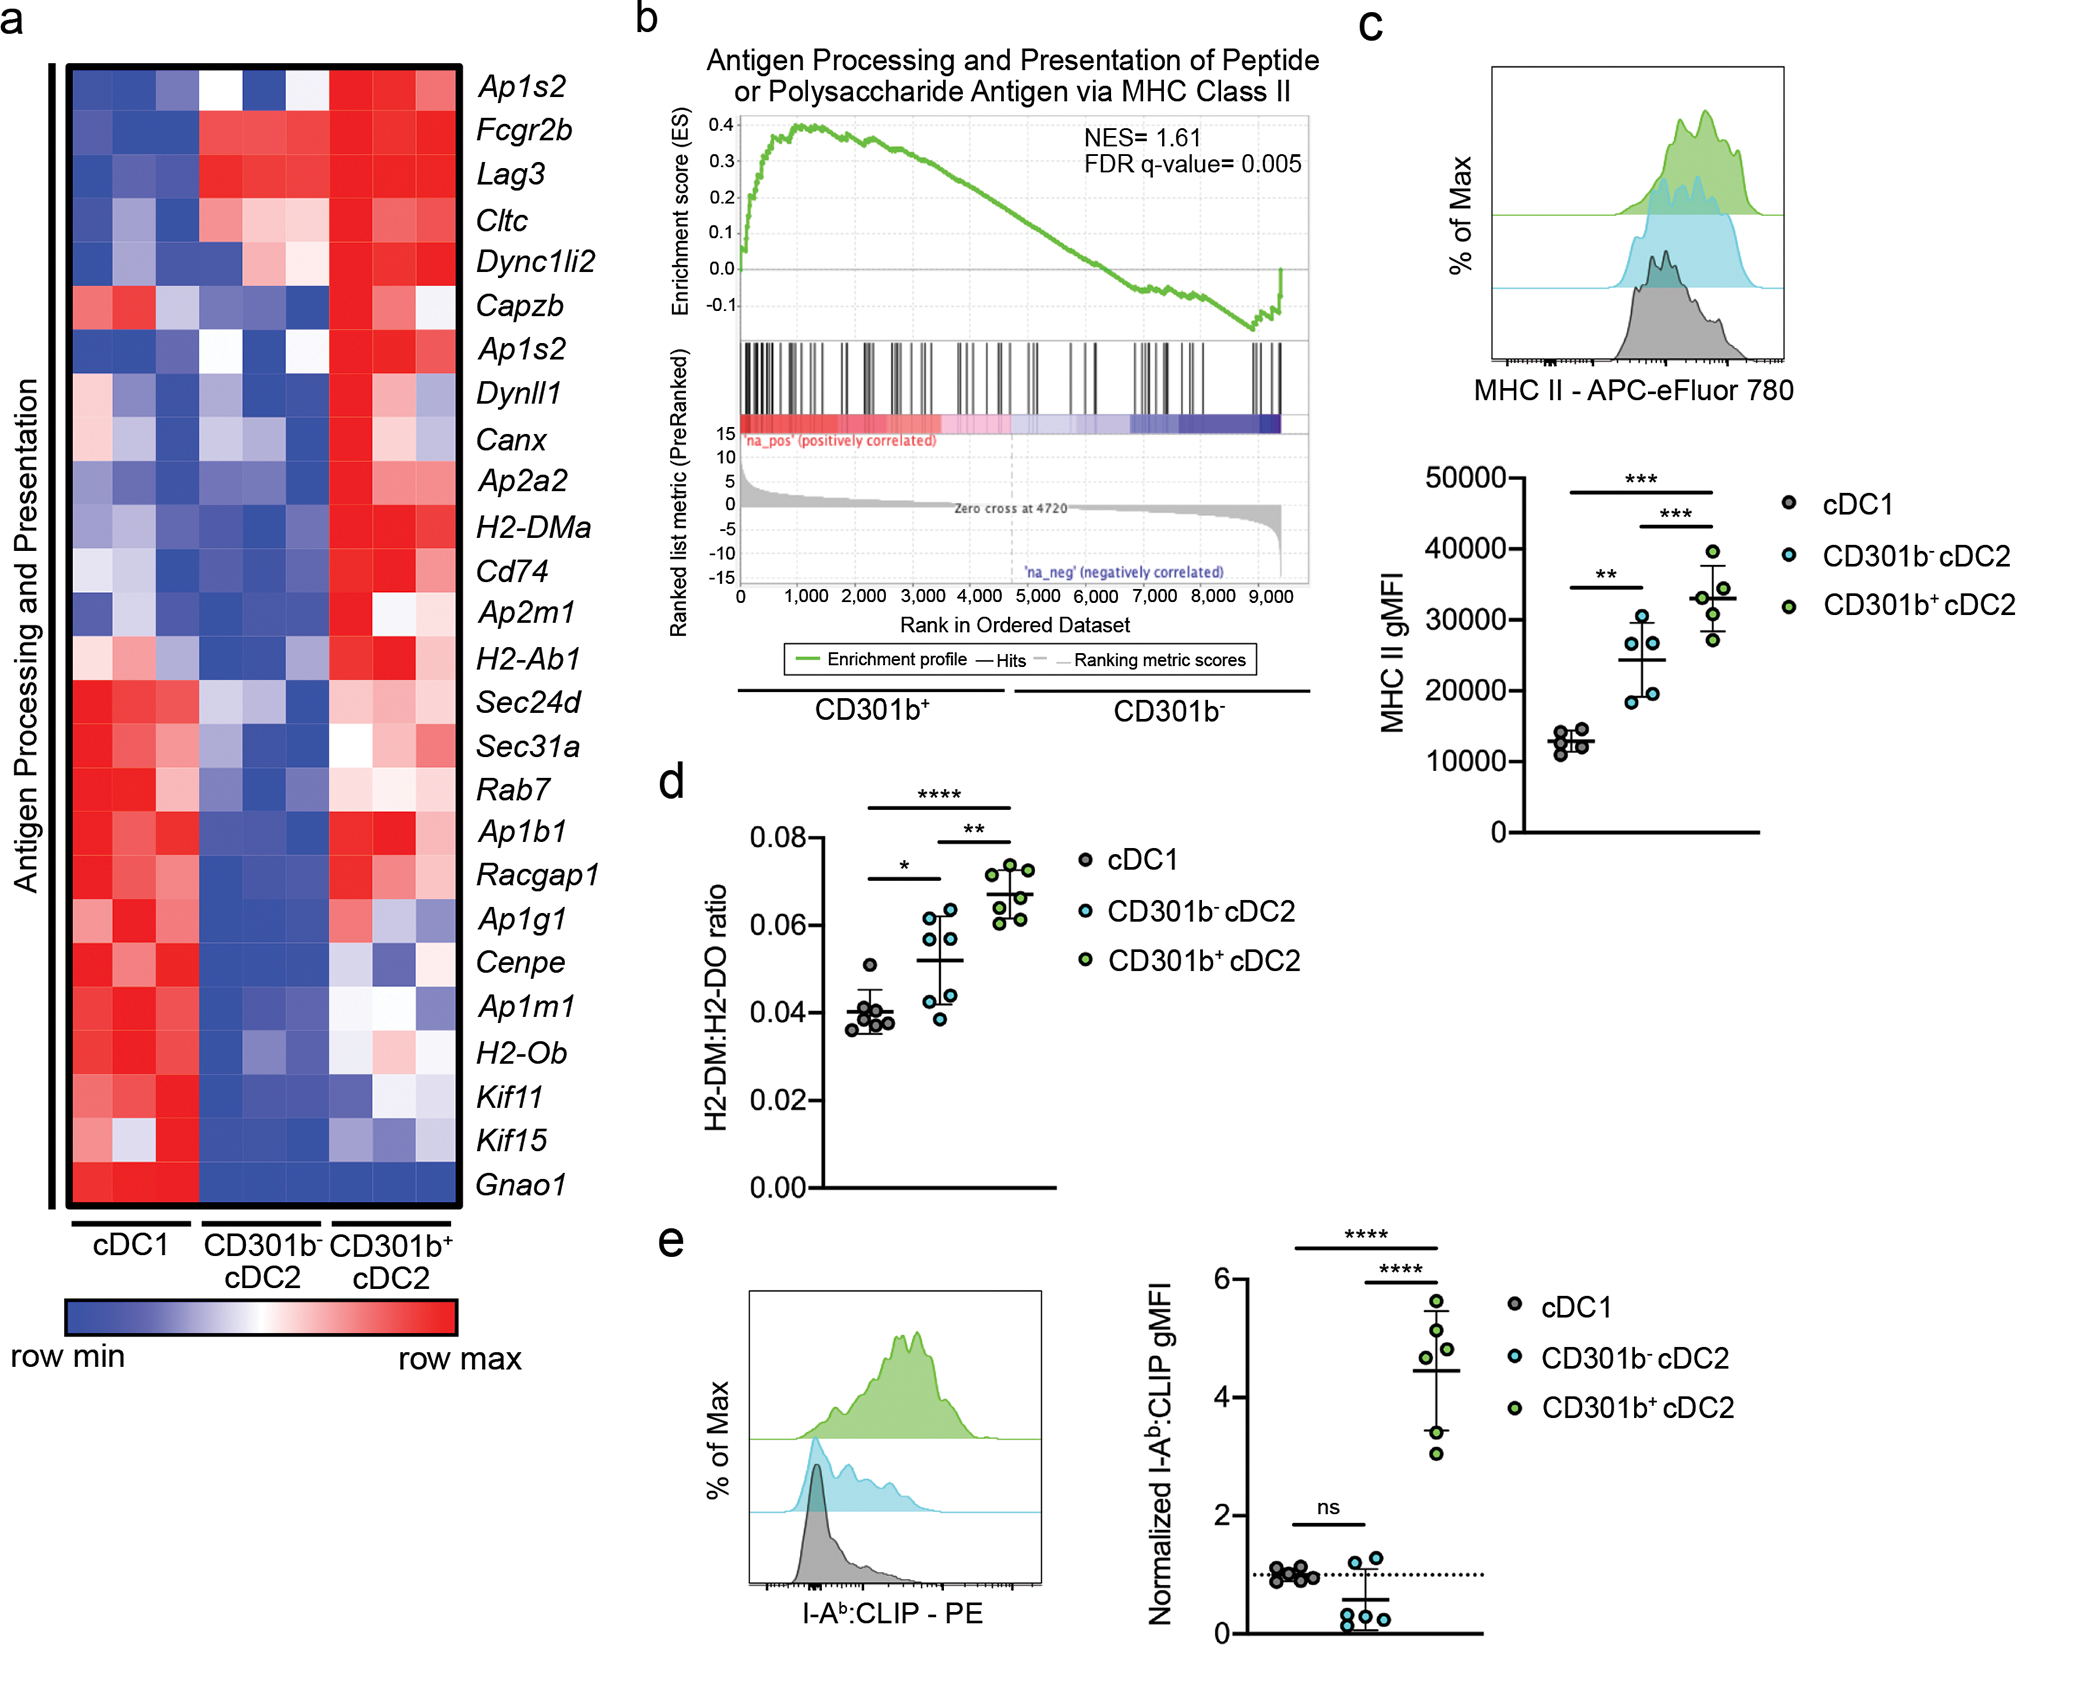
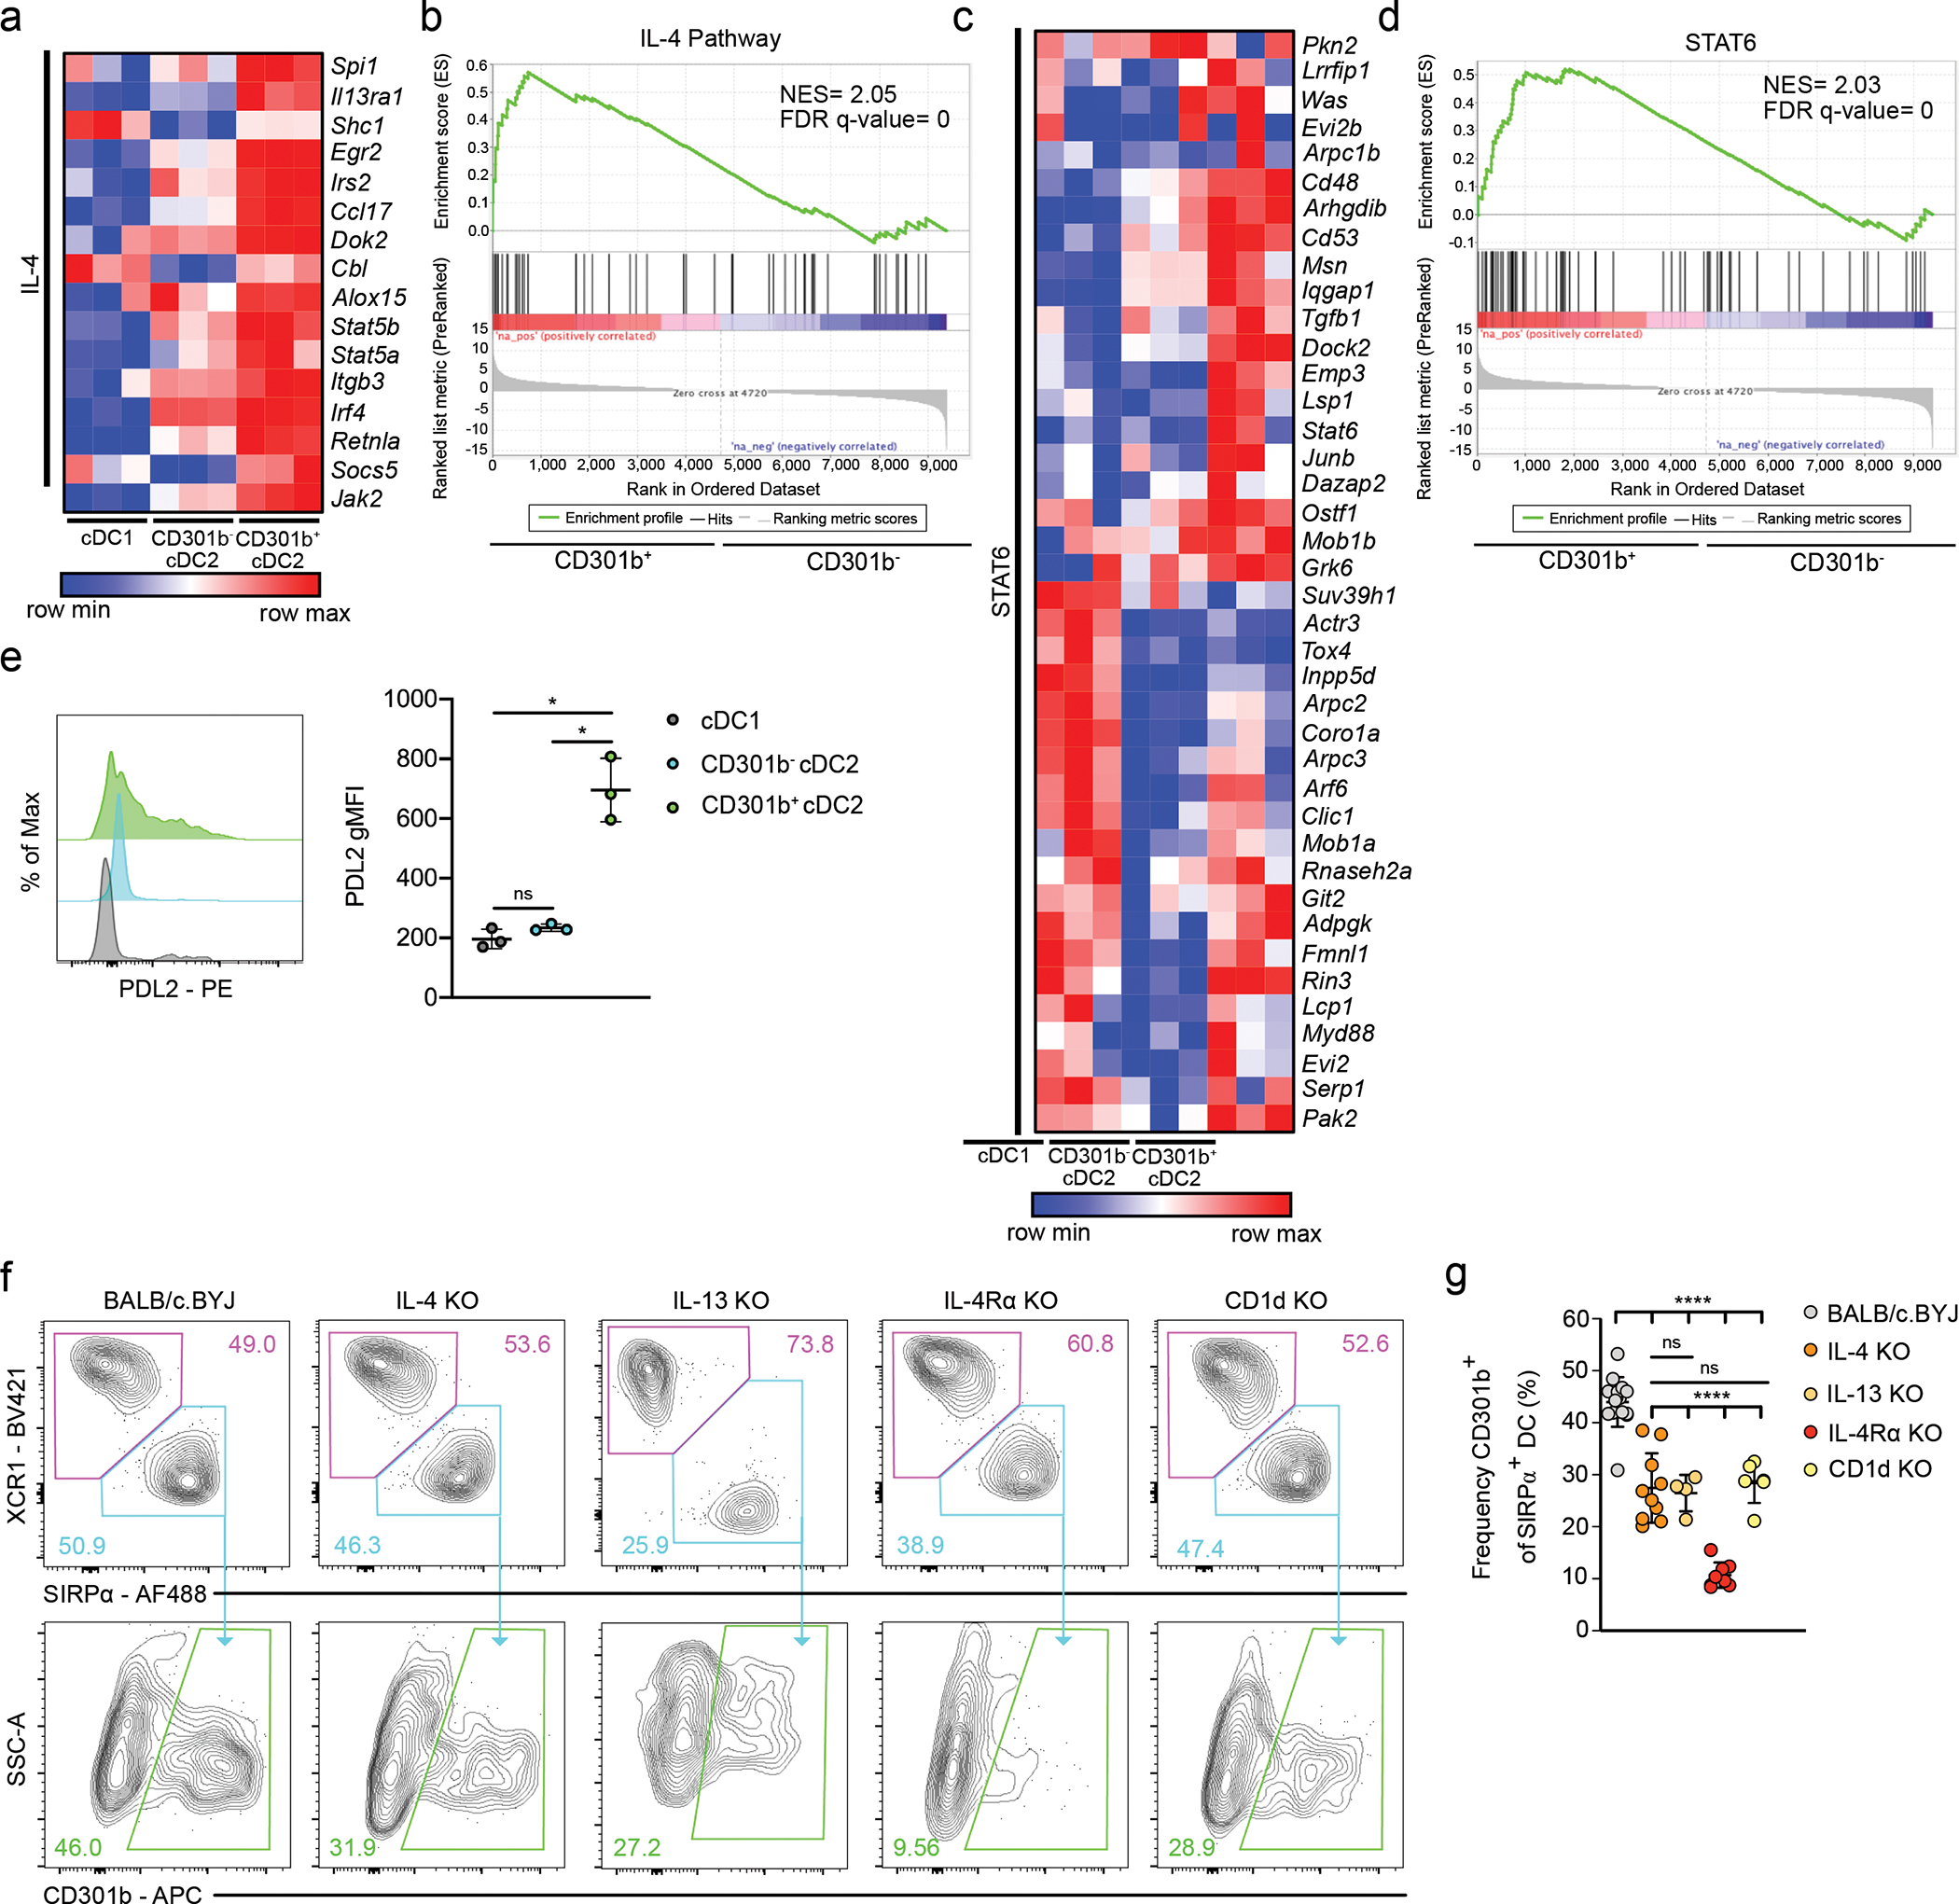
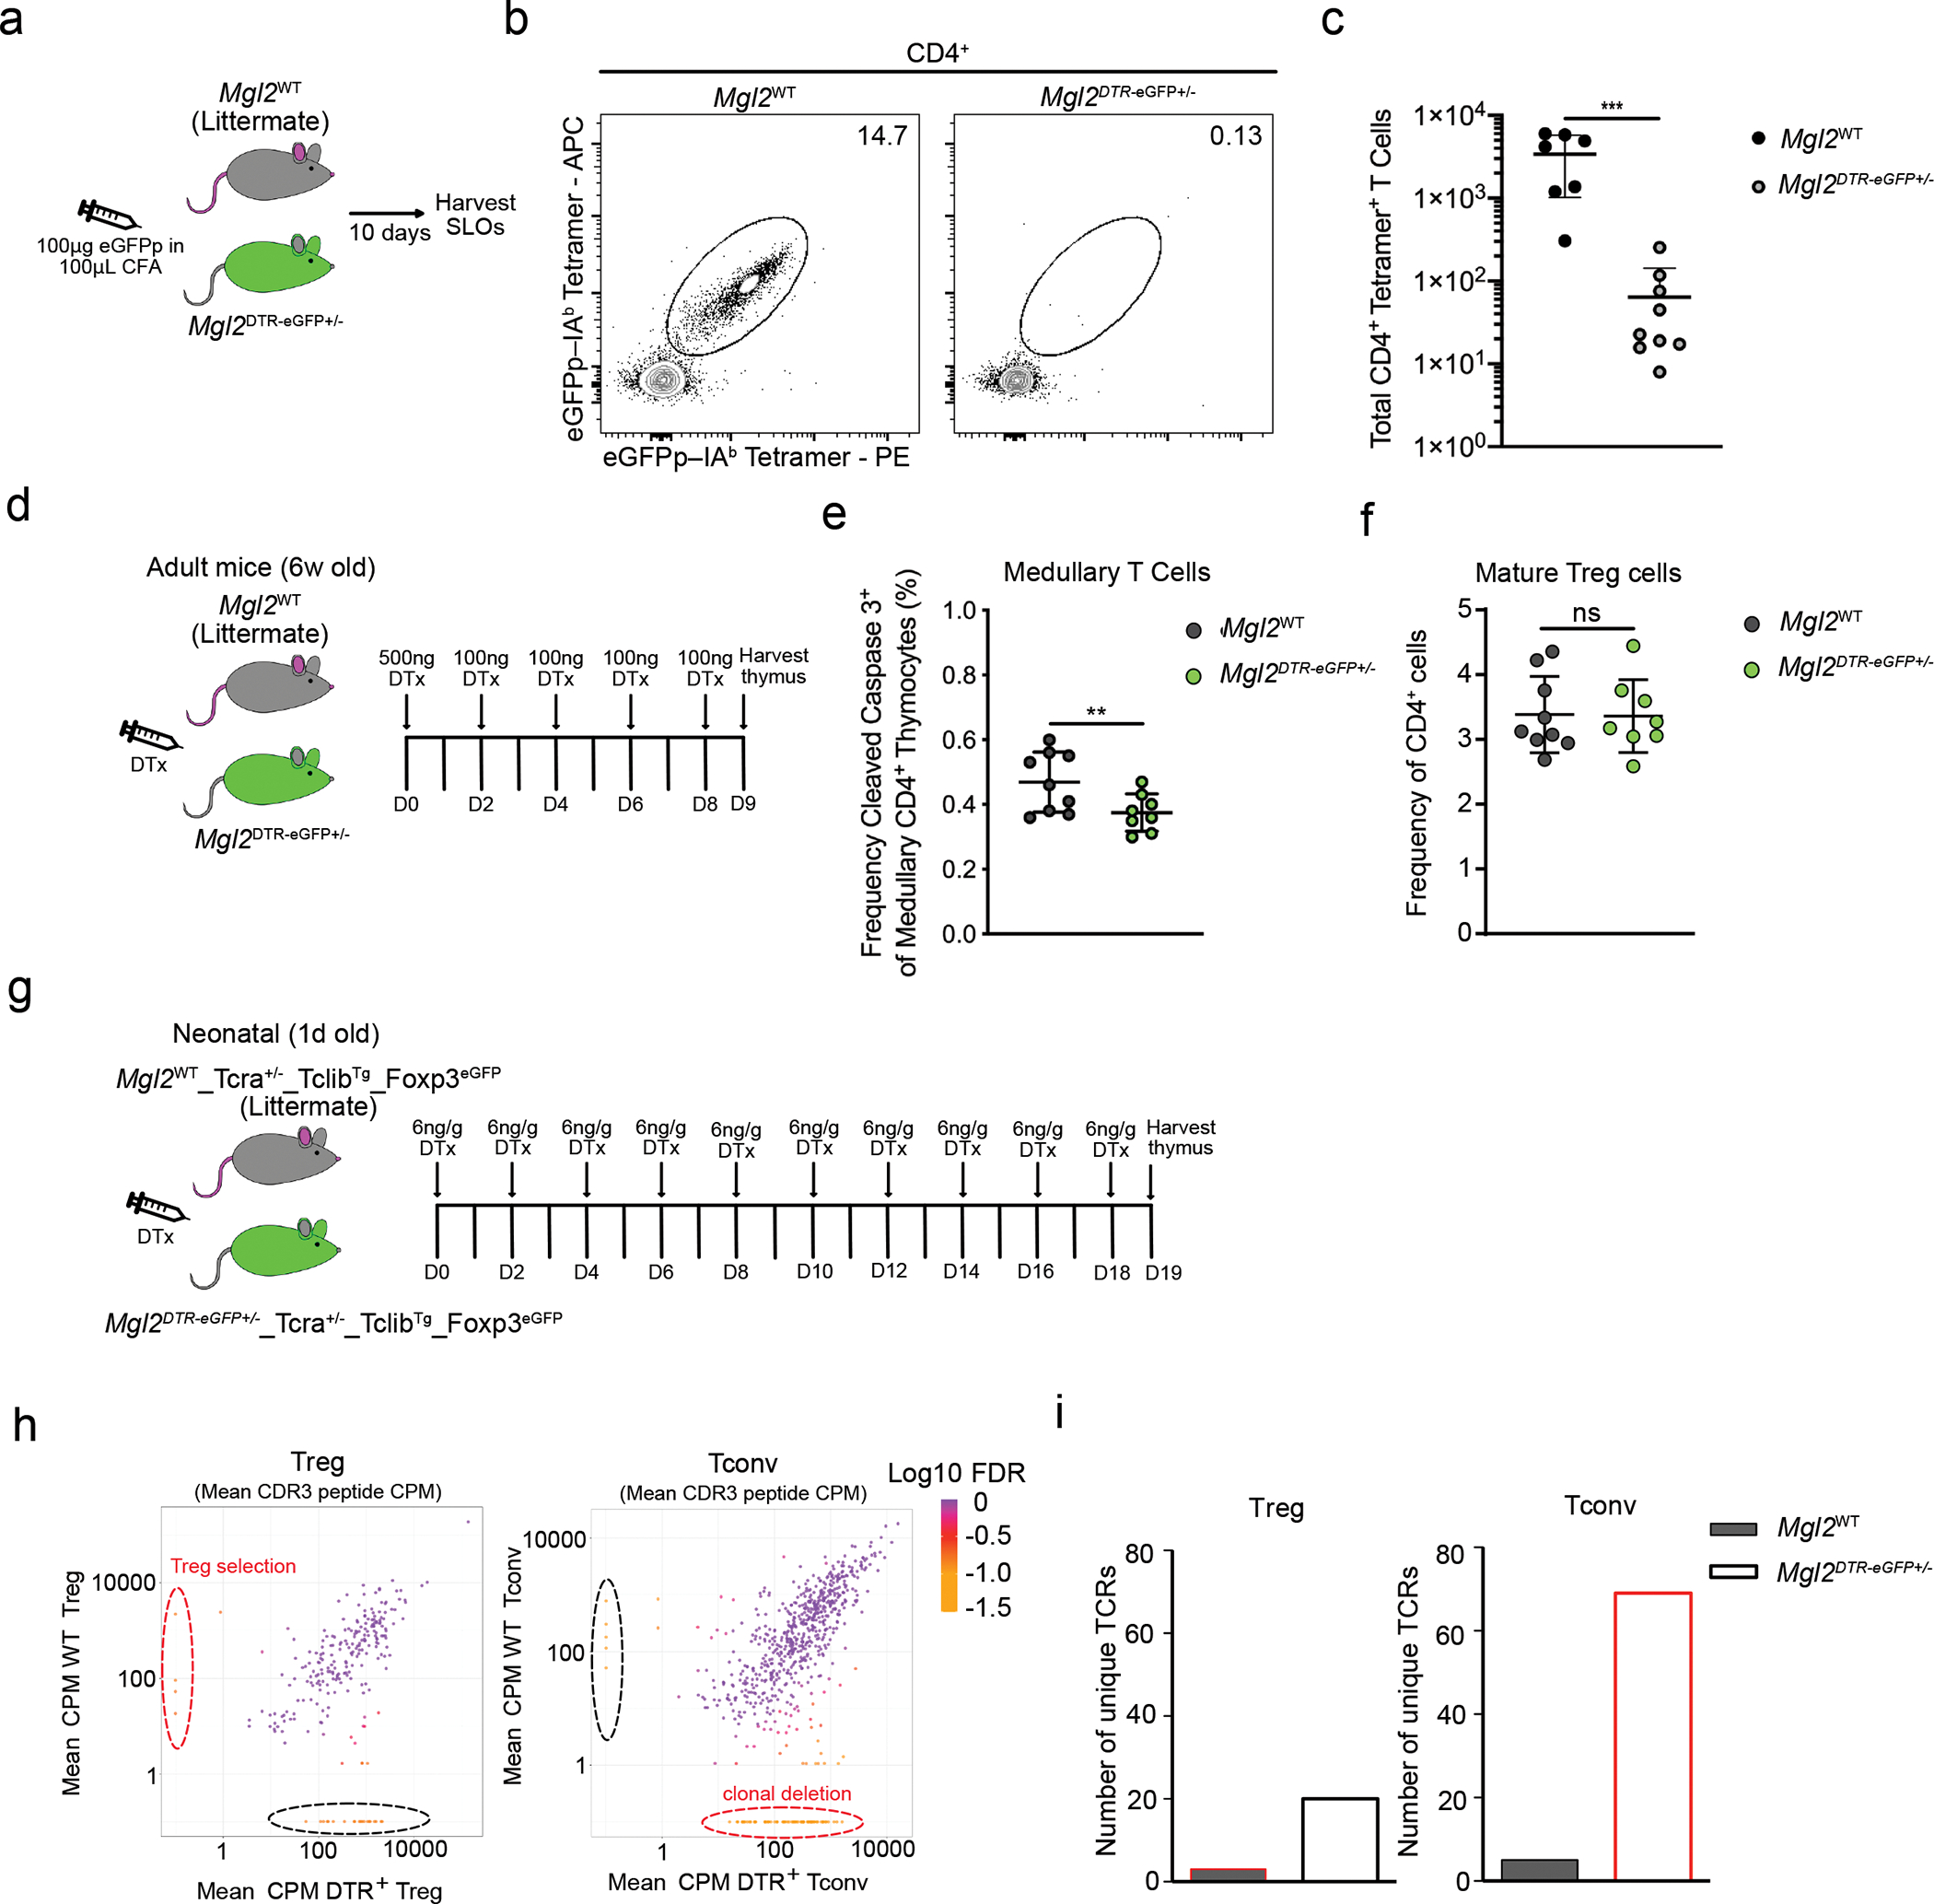
The thymus contains a diversity of dendritic cells (DCs) that exist in defined locations and have different antigen-processing and -presenting features. This suggests that they play nonredundant roles in mediating thymocyte selection. In an effort to eliminate SIRPα+ classic DC2 subsets, we discovered that a substantial proportion expresses the surface lectin, CD301b, in the thymus. These cells resemble the CD301b+ type 2 immune response promoting DCs that are present in the skin-draining lymph nodes. Transcriptional and phenotypic comparison to other DC subsets in the thymus revealed that thymic CD301b+ cDCs represent an activated state that exhibits enhanced antigen processing and presentation. Furthermore, a CD301b+ cDC2 subset demonstrated a type 2 cytokine signature and required steady-state interleukin-4 receptor signaling. Selective ablation of CD301b+ cDC2 subsets impaired clonal deletion without affecting regulatory T cells (Treg cells). The T cell receptor α repertoire sequencing confirmed that a cDC2 subset promotes deletion of conventional T cells with minimal effect on Treg cell selection. Together, these findings suggest that cytokine-induced activation of DCs in the thymus substantially enforces central tolerance.


Conflict of interest statement

Competing Interests

The authors have no financial conflicts of interest.

Figures

Extended Data Fig. 1.
Extended Data Fig. 1.. Thymic APC Gating Strategy.
Flow cytometric gating strategy for identifying B cells and dendritic cell subsets. B cells were identified by the expression of CD19 and B220 (blue; top, middle). Plasmacytoid DC (pDC) were identified by the expression of B220, CD11c, and PDCA-1 (CD317) (salmon; bottom, middle). Conventional dendritic cells were identified by the expression of MHC II and CD11c (top, middle right). cDC1 were identified by the expression of XCR1 (magenta) and cDC2 were identified by the expression of SIRPα (teal; top, right). CD301b expression is shown on cDC1 (green; right) and cDC2 green; (green; bottom).
Extended Data Fig. 2.
Extended Data Fig. 2.. Ontogeny of bone marrow-derived APC subsets in the thymus.
(a-e) Frequency of thymic APC subsets (as indicated) among total thymocytes in 2d (n=4), 1w (n=7), 2w (n=7), 3w (n=3), and 8w-old (n=6) C57BL/6 mice (gated as in Extended Data Fig. 1a). Each symbol represents an individual mouse. Male and female mice were used. Small horizontal lines indicate the mean, and error bars represent SD. Data are pooled from three independent experiments.
Extended Data Fig. 3.
Extended Data Fig. 3.. Thymic eGFP expression in Mgl2DTR-eGFP mice.
(a) Representative flow cytometry of Mgl2-eGFP expression by CD45 EpCAM+ thymic epithelial cells (TECs). Cell were MACS enriched as CD3 CD4 CD19 TER119. Mgl2WT mouse was used as control. (b) Representative flow cytometry of Mgl2-eGFP expression by CD11c+ cells in the thymus. The Mgl2-eGFP+ cells represent B220 XCR1 SIRPα+ cells that can be divided by the expression of MHC II and CCR7 to two main populations (as in Figure 1h). (c) Representative flow cytometry of Mgl2-eGFP expression and CD301b protein staining of thymic SIRPα+ DCs divided according to the MHC II and CCR7 expression to DC2 (bottom) and mDC2 (top). Mgl2WT and CD0301b-PE FMO were used as control. Numbers adjacent to outlined areas represent percent cells in each. Six to ten-week-old male and female mice were used. Data are representative of at least three independent experiments.
Extended Data Fig. 4.
Extended Data Fig. 4.. Identification of clusters in scRNA sequence data of thymic myeloid (CD11c+ CD11b+) cells.
(a) Flow cytometric gating strategy for sorting the thymic CD11c+ and CD11b+ populations for single-cell RNA (scRNA) sequencing. Cells were MACS enriched for CD90.2 cells. Dead cells were gated out using Viability Dye Aqua 510 and Cytox. CD90.2 CD11c+ and CD11b+ cells were sorted, captured with a 3’ Single Cell V5 chemistry platform, and sequenced. (b) UMAP plot showing the analysis of 10,234 transcriptome events identifying 22 color-coded clusters that were divided into 10 main populations marked by dashed lines. (c) Feature plots showing normalized expression of signature genes associated with clusters defined in b. Seven-week-old male mice were used.
Extended Data Fig. 5.
Extended Data Fig. 5.. No depletion of thymic epithelial cells in Mgl2DTR-eGFP mice.
(a) Quantification of total numbers of CD301b+ cDC2 from BALB/c/BYJ (n=3), IL-4 KO (n=4) and IL-4Ra KO (n=4) mice. (b) Experimental strategy for selective depletion of CD301b expressing cells in Mgl2DTR-eGFP mice. (c) Representative flow cytometric gating strategy of thymic epithelial cell (TEC) populations. Cells were MACS enriched as CD3 CD4 CD19 TER119. TECs were gated as CD45 EpCAM+, then divided to cortical TECs (cTECs) and medullary TECs (mTECs) according to the expression of Ly51 and UEA, respectively. mTECs were then divided based on the Ly6d and MHC II expression to mTECsLow (black), mTECsHigh (blue), Pre-post-Aire (red), and Post-Aire (green). (d) Quantification of numbers of TEC populations (gated as in c) from diphtheria toxin (DTx) treated Mgl2WT (gray dots) (n=5) or Mgl2DTR-eGF (green dots) (n=5). Six to ten-week-old male and female mice were used. Small horizontal lines indicate mean, and error bars represent SD. Data are representative of at least 3 independent experiments (c) or are pooled from at least 2 independent experiments (a, d). ns=not significant, *P<0.05, ***P< 0.001. One-way ANOVA test with Tukey’s multiple comparisons test was used.
Extended Data Fig. 6.
Extended Data Fig. 6.. Selectivity of thymic myeloid cell depletion in Mgl2DTR-eGFP mice.
(a) Experimental strategy for selective depletion of cells in Mgl2DTR-eGFP mice. (b) Representative flow cytometric gating strategy of thymic cell populations. Cells were enriched for CD90.2 negative cells to eliminate thymocytes. Macrophages were identified by the expression of CD64. Neutrophils were identified by the expression of CD11b and Ly6g. Eosinophils were gated as CD11b+ SiglecF+. B cells were identified as CD11c B220+ and plasmacytoid DCs (pDC) as CD11c+ B220+. Monocytes were gated as Ly6c+ CD11c CD11b+ and cDCs as MHCII+ CD11c+. (b) Quantification of cell numbers of thymic populations (gated as in a) from diphtheria toxin (DTx) treated Mgl2WT (gray dots) or Mgl2DTR-eGFP (green dots) (n=9). (c) Quantification of thymic cDC numbers (gated as in Supplementary Figure 1) and thymic cDC subpopulations (gate as in Figure 1h) from diphtheria toxin (DTx) treated Mgl2WT (gray dots) (n=9) or Mgl2DTR-eGFP (green dots) (n=9). Six to ten-week-old male and female mice were used. Small horizontal lines indicate mean, and error bars represent SD. Data are representative of at least 3 independent experiments (b) or are pooled from at least 3 independent experiments (c, d). ns=not significant, *P<0.05, **P<0.01, ***P< 0.001. One-way ANOVA test with Tukey’s multiple comparisons test was used.
Extended Data Fig. 7.
Extended Data Fig. 7.. scRNA sequencing analysis of thymic myeloid cell depletion in Mgl2DTR-eGFP mice.
(a) Experimental strategy for selective depletion of cells in Mgl2DTR-eGFP mice. (b) The CD11c+ and CD11b+ cells (gated as in Supplementary figure 4) from diphtheria toxin (DTx) treated Mgl2WT (left plot) or Mgl2DTR-eGFP (right plot) were FACS-sorted, captured with a 3’ Single Cell V5 chemistry platform, and sequenced. Cell hashing was used to distinguish the genotypes of origin. The non-myeloid and granulocyte populations was bioinformatically depleted from the analysis. UMAP plots showing the analysis of 13,129 transcriptome events (Mgl2WT = 8,175, Mgl2DTR-eGFP = 4,959) and identified 8 major clusters marked by dashed lines. The clusters showing the most diffence in abundance of events between the genotypes (cDC2 and mDC2) are marked by bold navy and yellow lines. (c) Enumeration of clusters frequencies from CD11c/CD11b+ cells identified in b. (d) Feature plots showing normalized expression of Mgl2, Mki67 and Ccr7 genes in clusters identified in b. (e) Feature plots comparing the Mgl2 expression between Mgl2WT and Mgl2DTR-eGFPmice. Seven-week-old male mice were used.
Extended Data Fig. 8.
Extended Data Fig. 8.. Clonal deletion gating strategy.
Flow cytometry gating strategy for identifying thymocytes undergoing clonal deletion or death by neglect. Signaled and non-signaled cells were identified based on expression of CD5 and TCRβ (middle, left; green gate (signaled), gray gate (non-signaled). Thymocytes undergoing death by neglect were identified from non-signaled cells based on expression of cleaved caspase-3 (bottom, left; gray gate). Cortical and medullary thymocytes were identified based on expression of CCR7 (middle, middle). Medullary CD4 thymocytes undergoing clonal deletion were identified from signaled CCR7+ CD4+ cells based on expression of cleaved caspase-3+ (bottom, right; red gate). Numbers adjacent to outlined areas represent percent cells in each.
Extended Data Fig. 9.
Extended Data Fig. 9.. Frequencies of thymic T cell populations.
(a-c) Total CD4 T cells in mice with selective deficiencies. The administration of DTx into Mgl2DTR-eGFP mice was done as in Figure 5d. (d and e) Frequency of CD5+ TCRβ+ cleaved caspase 3+ thymocytes among CCR7+ CD4 T cells in in mice with selective deficiencies (gated as in Extended Data Fig. 8). (f) Frequency of CD5+ TCR+ cleaved caspase 3+ thymocytes among DP T cells in Mgl2WT (n=9) or Mgl2DTR-eGFP (n=8). The administration of DTx into Mgl2DTR-eGFP mice was done as in Figure 5d. (a-e) AireWT (n=5) or AireKO (n=6), Batf3WT (n=9) or Batf3KO (n=11) and Mgl2WT (n=8) or Mgl2DTR-eGFP (n=6) mice were used. (g) Frequency of CD25+FOXP3 and CD25FOXP3+ Treg cell progenitors (TRP) and (h) nascent CD25+ FOXP3+ CD73 and recirculating CD25+ FOXP3+ CD73+ Treg cells in Mgl2WT (n=9) or Mgl2DTR-eGFP (n=8) mice following 9 days of diphtheria toxin treatment. The administration of DTx into Mgl2DTR-eGFP mice was done as in Figure 5d. Each symbol represents an individual mouse. Six to twelve-week-old male and female mice were used. Small horizontal lines indicate the mean and error bars represent SD. ns=not significant, *P< 0.05, **P<0.01. Data are pooled from at least three independent experiments. Unpaired Mann-Whitney test was used.
Extended Data Fig. 10.
Extended Data Fig. 10.. RNA sequencing of TCRs from Mgl2DTR-eGFP mice.
(a) Heatmap analysis of CPM (counts per million reads mapped) of CDR3 peptides that were deferentially expressed between CD4+ Tconv thymocytes from Mgl2WTTcra+/−TclibTgFoxp3eGFP and Mgl2DTR-eGFPTcra+/−TclibTgFoxp3eGFP mice (n=4 mice per genotype). The plot also displays the expression of those CDR3 peptides in CD4+ Treg thymocytes from the same mice. The Log10 FDR (False discovery rate) of for each CDR3 peptide CPM is shown.
Fig. 1.
Fig. 1.. CD301b+ cDC are enriched amongst thymic SIRPα+ cDC2.
(a) Representative flow cytometry of XCR1+ cDC1 (top; magenta gate), SIRPα+ cDC2 (top; teal gate), and CD301b+ cDC2 (bottom; green gate) in spleen (left; n=2), sdLN (middle; n=9), and thymus (right; n=9) from C57BL/6 mice (gated as in Extended Data Fig. 1). Numbers adjacent to outlined areas indicate percent cells in each. (b) Frequency of CD301b+ among SIRPα+ cDC2 in the spleen (n=2), sdLN (n=9), and thymus (n=9) from C57BL/6 mice. (c) Numbers of pDC, XCR1+ cDC1, CD301b and CD301b+ cDC2 in thymus from C57BL/6 mice (n=9). (d) Frequency of CD301b+ cDC2 among total thymocytes in thymus of 2d (n=4), 1w (n=7), 2w (n=7), 3w (n=3), and 8w-old (n=6) C57BL/6 mice. (e) Immunofluorescence microscopy (top) of thymic sections from C57BL/6 mice stained for CD11c (red) and CD301b (green). White lines indicate cortical-medullary border based on UEA I staining. C, cortex; M, medulla. Scale bars 100μm. Analysis of images by histo-cytometry (bottom). Frequency of CD301b+ (bottom, right) and CD11c+ (bottom, left) cells identified as localized in the medulla by histo-cytometry. Numbers indicate percent cells in each outlined area. (f) Experimental strategy for generating parabiotic mice. (g) Frequency of cells derived from the host parabiont amongst splenic CD8 T cells, thymic SIRPα+ cDC2, thymic CD301b+ cDC2, or thymic XCR1+ cDC1 (n=4). (h) Representative flow cytometry analysis of Mgl2-eGFP expression in XCR1+ and SIRPα+ populations of thymic DCs. Populations were divided according to the expression of MHCII and CCR7 to XCR1+ DC1 (MHCII+ CCR7), mDC1 (MHCIIHighCCR7+) and SIRPα+ DC2 (MHCII+ CCR7) and mDC2 (MHCIIHigh CCR7+). (i) Frequency of Mgl2-eGFP+ cell among DC1, mDC1, DC2 and mDC2 thymic populations (n=4). Each symbol (b, c, d, g, i) represents an individual mouse; small horizontal lines indicate the mean, and error bars represent SD. Six to twelve-week-old male and female mice were used, except as specified in (d). Data are representative of more than 3 independent experiments (a, h), or are pooled from two, or three independent experiments (b, c, d, e, g, i), **P<0.01. One-way ANOVA with Holm-Sidak’s multiple comparisons test was used.
Fig. 2.
Fig. 2.. Thymic CD301b+ cDC2 express a distinct gene signature.
(a) Multidimensional scaling (MDS) analysis of RNA-seq of sorted thymic XCR1+ cDC1, SIRPα+ cDC2, and CD301b+ cDC2 from 8-week-old C57BL/6 mice (n=3). (b) Venn diagram showing the number and percentage of unique genes from XCR1+ cDC1, CD301b and CD301b+ cDC2 based on a pairwise comparisons with corrected P-values ≤ 0.05. (c) Heat map of total unique differentially expressed genes (n=1,341) between XCR1+ cDC1, CD301b and CD301b+ cDC2 (p≤0.05). Graph showing the number of overlapping differentially expressed genes (DEGs) between previously described groups of DCs. (d) Single cell RNA sequencing of CD11c+ and CD11b+ FACS sorted cells from the thymus of seven-week-old male mice (gated as in Extended Data Fig. 4). UMAP plots show the analysis of 10,234 transcriptome events and identify 10 major clusters marked by dashed lines. (e) Feature plots showing normalized expression of Sirpa (upper panel) and Mgl2 (lower panel) in clusters identified in d. The quasi-likelihood F test (QLF) was used to calculate statistics in b and c.
Fig. 3.
Fig. 3.. Thymic CD301b+ cDC2 have characteristics of enhanced antigen presentation.
(a) Heatmap displaying the relative expression of leading-edge genes from ANTIGEN_PROCESSING_AND_PRESENTATION_OF_PEPTIDE_OR_POLYSACHARIDE_ANTIGEN_VIA_MHC_CLASS_II gene set in sorted thymic XCR1+ cDC1, CD301b cDC2, and CD301b+ cDC2 from 8-week-old C57BL/6 mice. (b) Gene set enrichment analysis showing the enrichment for antigen processing and presentation signature genes in thymic CD301b and CD301b+ cDC2. NES, normalized enrichment score. FDR q-value, false discovery rate. (c) Representative flow cytometry of thymic XCR1+ cDC1, CD301b cDC2, and CD301b+ cDC2 stained for MHC II (top) and geometric mean fluorescence intensity (gMFI) (bottom) in C57BL/6 mice (n=5). (d) gMFI ratio of intracellular H2-DM:H2-DO in XCR1+ cDC1, CD301b cDC2, and CD301b+ cDC2 in C57BL/6 mice (n=7). (e) Representative flow cytometry of thymic XCR1+ cDC1, CD301b cDC2, and CD301b+ cDC2 stained intracellularly for IAb:CLIP (left) and gMFI normalized to controls (right) in C57BL/6 mice (n=6). Each symbol (c, d, e) represents an individual mouse. Six to twelve-week-old male and female mice were used. Small horizontal lines indicate the mean, and error bars represent SD. Data are pooled from at least two independent experiments (c, d, e). ns=not significant, *P<0.05, **P<0.01, ***P< 0.001, ****P< 0.0001. One-way ANOVA with Tukey’s multiple comparisons test was used.
Fig. 4.
Fig. 4.. Thymic CD301b+ cDC2 require type 2 cytokines.
(a) Heatmap displaying the relative expression of leading-edge genes from the PID_IL4_2PATHWAY gene set among sorted thymic XCR1+ cDC1, CD301b cDC2, and CD301b+ cDC2 from 8-week-old C57BL/6 mice. (b) Gene set enrichment analysis showing the enrichment for IL-4 signature genes among sorted thymic CD301b cDC2 and CD301b+ cDC2. NES, normalized enrichment score. FDR q-value, false discovery rate. (c) Heatmap displaying the relative expression of leading-edge genes from the GNF2_STAT6 gene set among sorted thymic XCR1+ cDC1, CD301b cDC2, and CD301b+ cDC2 from 8-week-old C57BL/6 mice. (d) Gene set enrichment analysis showing the enrichment of STAT6 related genes among sorted thymic CD301b and CD301b+ cDC2. NES, normalized enrichment score. FDR q-value, false discovery rate. (e) Representative flow cytometry of thymic XCR1+ cDC1, CD301b cDC2, and CD301b+ cDC2 stained for PDL2 (left) and PDL2 gMFI (right) in C57BL/6 mice (n=3). (f) Representative flow cytometry of XCR1+ cDC1 (top; magenta gate) and SIRPα+ cDC2 (top; teal gate) and CD301b+ DC2 (bottom; green gate) from BALB/c.BYJ (left), IL-4 KO (middle left), IL-13 KO (middle; from separate experiment), IL-4Rα KO (middle right), and CD1d KO (right) mice, all on a BALB/c background. Numbers adjacent to outlined areas represent percent cells in each. (g) Frequency of CD301b+ among SIRPα+ cDC2 in thymus of BALB/c.BYJ (n=15), IL-4 KO (n=10), IL-13 KO (n=4), IL-4Rα KO (n=8), and CD1d KO (n=6) mice. Six to twelve-week-old male and female mice (e, f) were used. Each dot represents an individual mouse (e, g). Small horizontal lines indicate the mean, and error bars represent SD. Data are representative of at least three independent experiments (e, f), are pooled from at least three independent experiments (g). ns=not significant, *P<0.05, ****P< 0.0001. One-way ANOVA with Tukey’s multiple comparisons test was used.
Fig. 5.
Fig. 5.. CD301b+ cDC2 mediate clonal deletion.
(a) Experimental strategy for eGFPp immunization. (b) Representative flow cytometry of eGFPp–IAb–PE and eGFPp–IAb–APC staining of tetramer-enriched CD4 T cells from pooled spleens and lymph nodes of Mgl2WT (n=7) and Mgl2eGFP+/− (n=9) mice 10 days after immunization with 100μg eGFPp emulsified with CFA. (c) Total eGFPp–IAb–tetramer-binding CD4 T cells (as in Fig. 5b). (d) Experimental strategy for selective depletion of CD301b+ cDC2 (Mgl2DTR). (e) Frequency of CD5+ TCRβ+ cleaved caspase 3+ thymocytes among CCR7+ CD4 T cells in Mgl2WT (n=9) or Mgl2DTR (n=8) mice following 9 days of diphtheria toxin treatment (gated as in Extended Data Fig. 8). (f) Frequency of mature (CD4+CD25+FOXP3+) Tregs in Mgl2WT (n=9) or Mgl2DTR (n=8) mice following 9 days of diphtheria toxin treatment. (g) Experimental strategy for selective depletion of CD301b+ cDC2 and further bulk RNA sequencing of TCRs. (h) Changes in mean CDR3 peptide CPM (counts per million reads mapped) in Tregs (left graph) and CD4+ Tconvs (right graph) from Mgl2WTTcra+/−TclibTgFoxp3eGFP and Mgl2DTRTcra+/−TclibTgFoxp3eGFP mice (n=4 mice per genotype). The Log10 FDR (False discovery rate) of for each CDR3 peptide CPM is shown. (i) Comparison of numbers of unique TCRs (marked by dashed lines in h) between the Tregs and Tconvs from mice described in h. The color code is similar as in h. Each symbol (c, e) represents an individual mouse. Six to twelve-week-old male and female mice were used except for (h, i) where newborn mice were used. Small horizontal lines indicate mean and error bars represent SD. Data are representative of at least three independent experiments (b), are pooled from at least three independent experiments (c, e, f) or are generated from 4 mice per genotype (h, i). **P<0.01, ***P< 0.001. Two-tailed Unpaired Student’s t test was used.

References

    1. Guilliams M et al. Unsupervised high-dimensional analysis aligns dendritic cells across tissues and species. Immunity 45, 669–684 (2016). - PMC - PubMed
    1. Li J, Park J, Foss D & Goldschneider I Thymus-homing peripheral dendritic cells constitute two of the three major subsets of dendritic cells in the steady-state thymus. J Exp Med 206, 607–622 (2009). - PMC - PubMed
    1. Klein L, Kyewski B, Allen PM & Hogquist KA Positive and negative selection of the T cell repertoire: what thymocytes see (and don’t see). Nat Rev Immunol 14, 377–391 (2014). - PMC - PubMed
    1. Steinman RM, Hawiger D & Nussenzweig MC Tolerogenic dendritic cells*. Annu Rev Immunol 21, 685–711 (2003). - PubMed
    1. Lei Y et al. Aire-dependent production of XCL1 mediates medullary accumulation of thymic dendritic cells and contributes to regulatory T cell development. J Exp Med 208, 383–394 (2011). - PMC - PubMed

Materials and Methods References

    1. Neill DR et al. Nuocytes represent a new innate effector leukocyte that mediates type-2 immunity. Nature 464, 1367–1370 (2010). - PMC - PubMed
    1. Wong P, Goldrath AW & Rudensky AY Competition for Specific Intrathymic Ligands Limits Positive Selection in a TCR Transgenic Model of CD4 + T Cell Development. The Journal of Immunology 164, 6252–6259 (2000). - PubMed
    1. Skon CN et al. Transcriptional downregulation of S1pr1 is required for the establishment of resident memory CD8+ T cells. Nature Immunology 14, 1285–1293 (2013). - PMC - PubMed
    1. Moon JJ et al. Naive CD4+ T Cell Frequency Varies for Different Epitopes and Predicts Repertoire Diversity and Response Magnitude. Immunity 27, 203–213 (2007). - PMC - PubMed
    1. Xing Y & Hogquist KA Isolation, Identification, and Purification of Murine Thymic Epithelial Cells. Journal of Visualized Experiments (2014) doi: 10.3791/51780. - DOI - PMC - PubMed

Publication types