. 2022 Jun;3(6):696-709.
doi: 10.1038/s43018-022-00376-z. Epub 2022 May 30.

A local human Vδ1 T cell population is associated with survival in nonsmall-cell lung cancer

Collaborators, Affiliations

A local human Vδ1 T cell population is associated with survival in nonsmall-cell lung cancer

Yin Wu et al. Nat Cancer. 2022 Jun.

Abstract

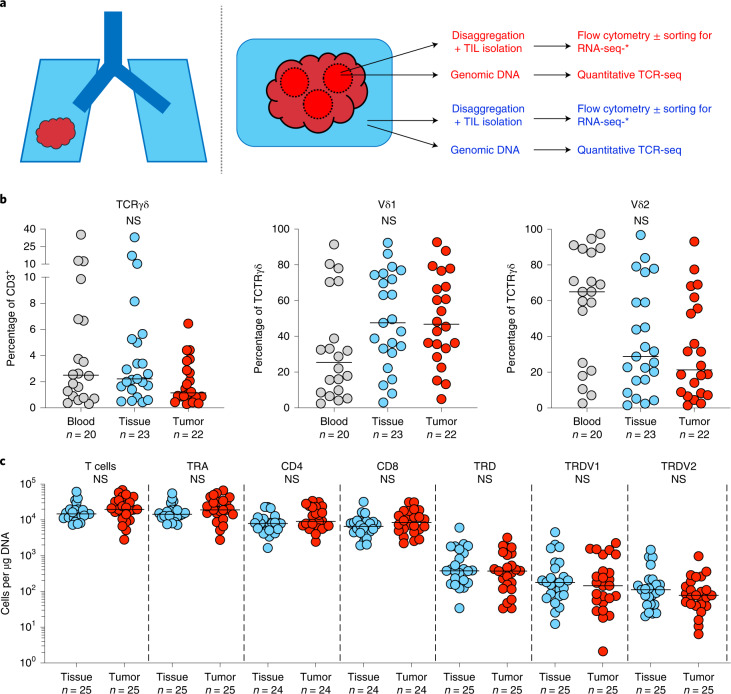
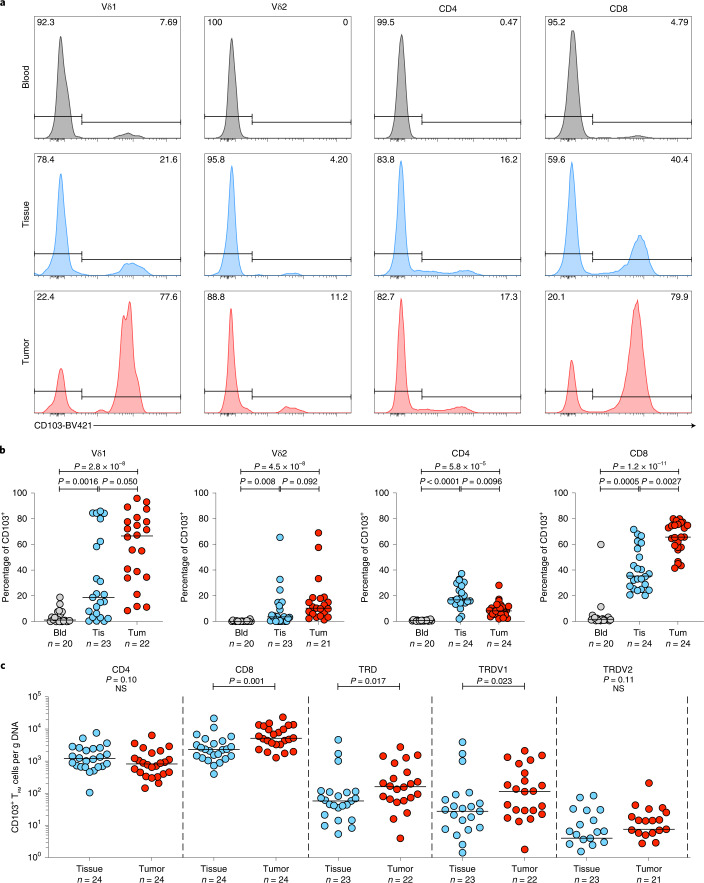
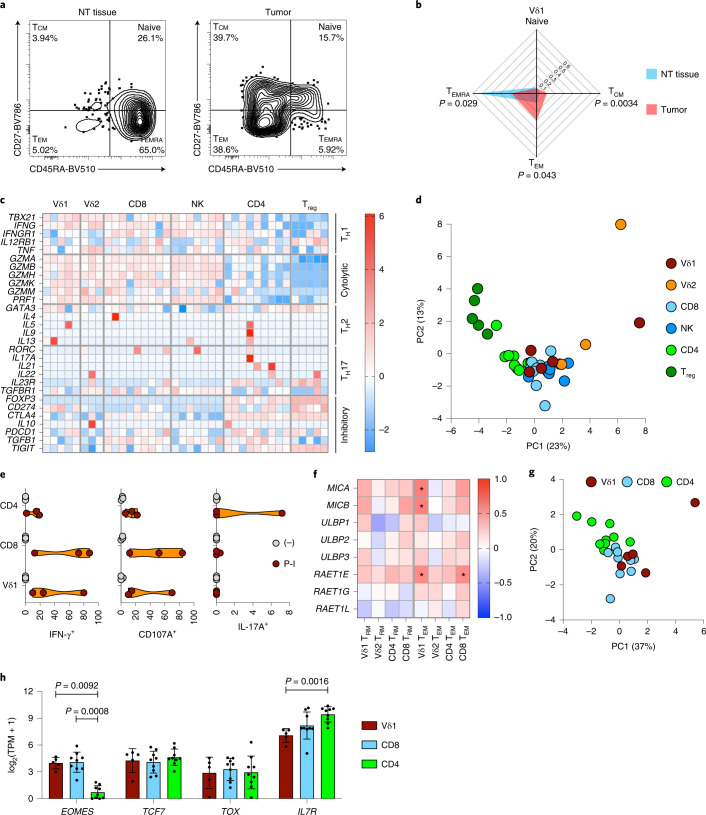
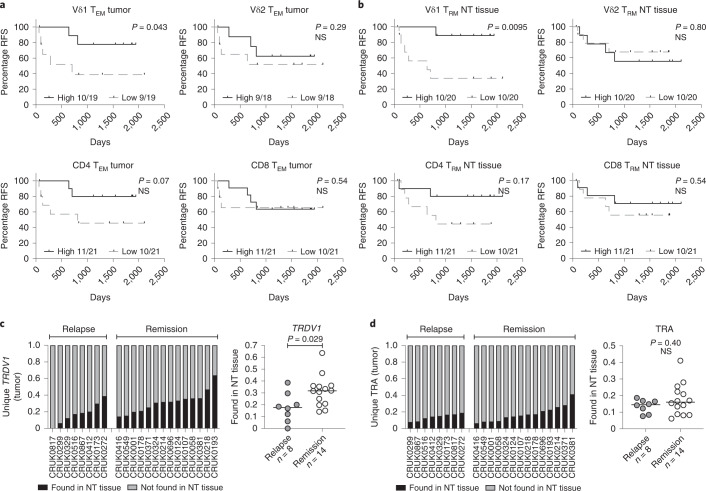
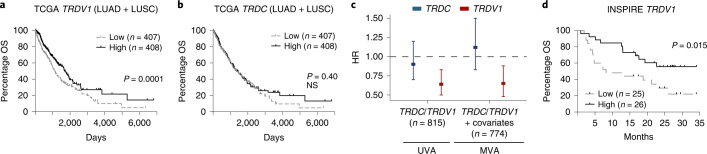
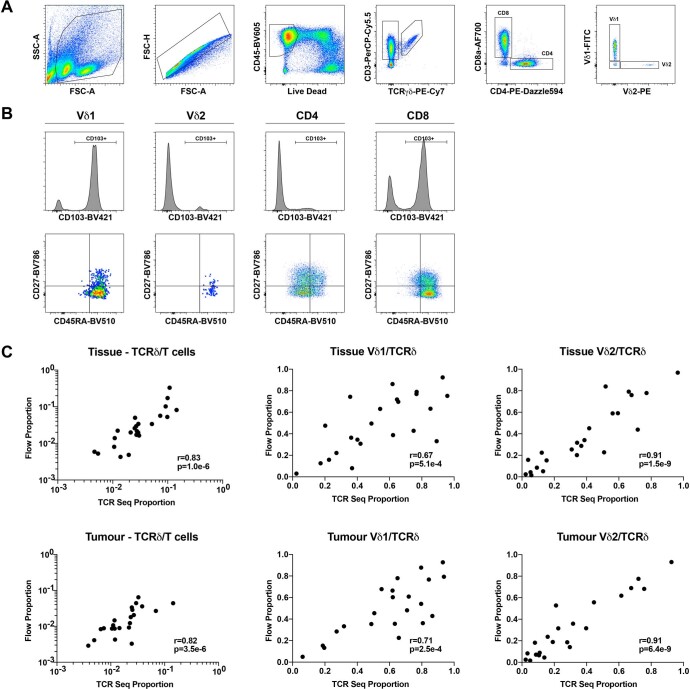
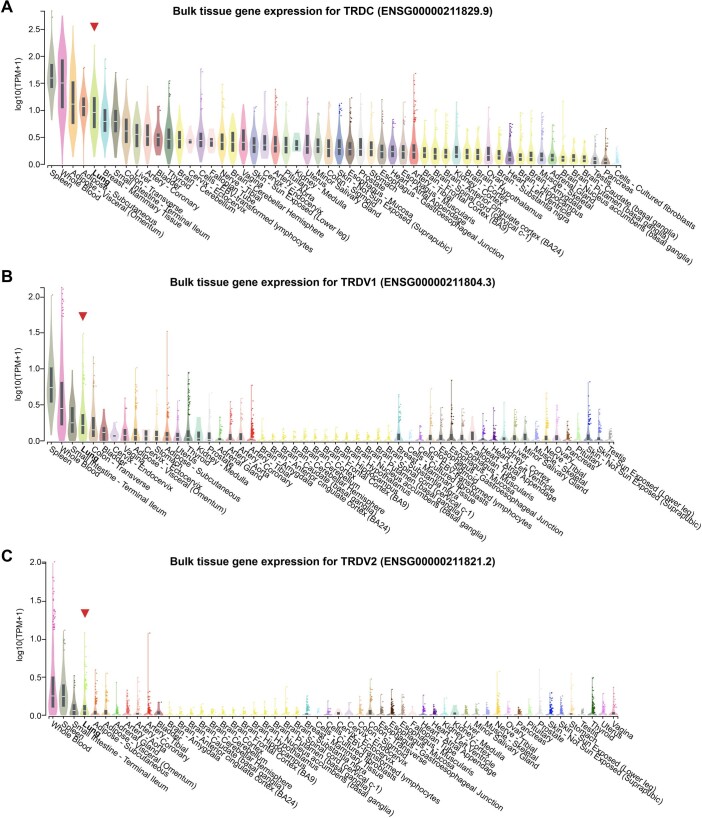
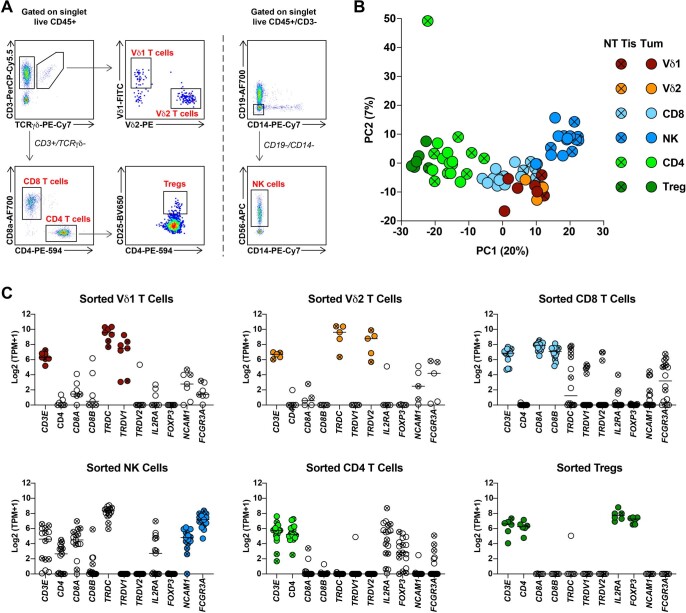
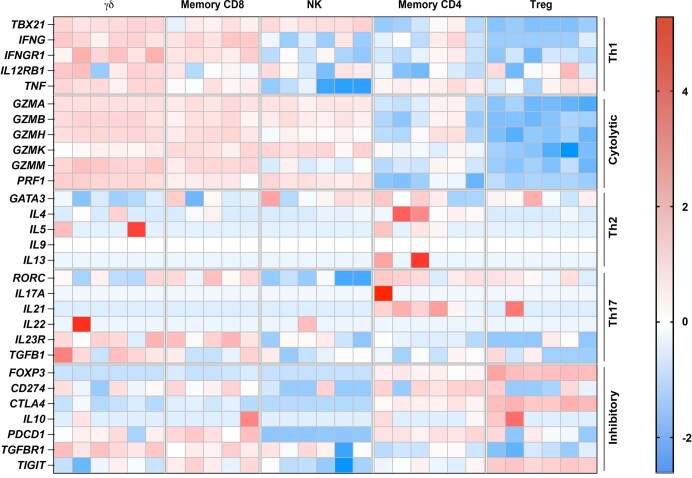
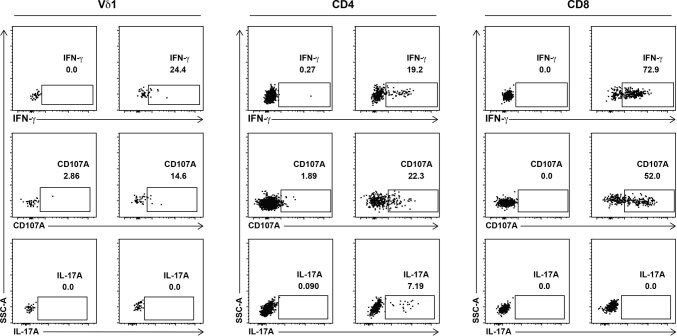
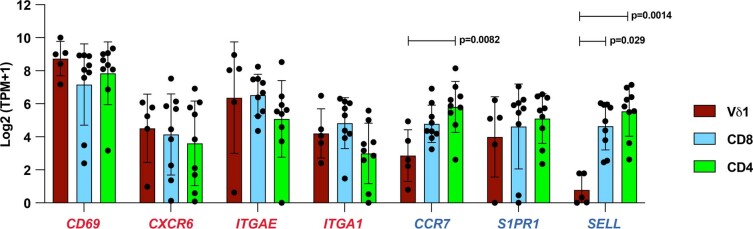
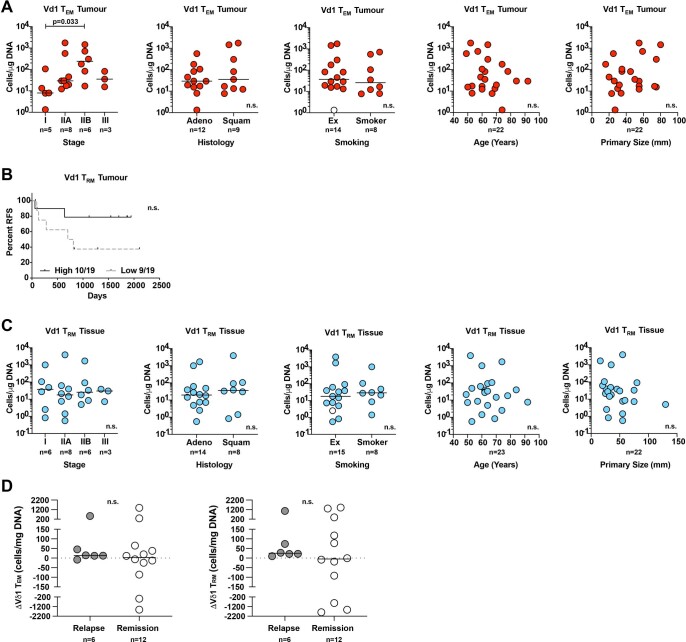
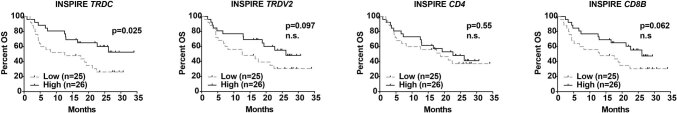
Murine tissues harbor signature γδ T cell compartments with profound yet differential impacts on carcinogenesis. Conversely, human tissue-resident γδ cells are less well defined. In the present study, we show that human lung tissues harbor a resident Vδ1 γδ T cell population. Moreover, we demonstrate that Vδ1 T cells with resident memory and effector memory phenotypes were enriched in lung tumors compared with nontumor lung tissues. Intratumoral Vδ1 T cells possessed stem-like features and were skewed toward cytolysis and helper T cell type 1 function, akin to intratumoral natural killer and CD8+ T cells considered beneficial to the patient. Indeed, ongoing remission post-surgery was significantly associated with the numbers of CD45RA-CD27- effector memory Vδ1 T cells in tumors and, most strikingly, with the numbers of CD103+ tissue-resident Vδ1 T cells in nonmalignant lung tissues. Our findings offer basic insights into human body surface immunology that collectively support integrating Vδ1 T cell biology into immunotherapeutic strategies for nonsmall cell lung cancer.


Conflict of interest statement

D.B. has consulted for NanoString, reports honoraria from AstraZeneca and has a patent (PCT/GB2020/050221) issued on methods for cancer prognostication. J.R. and M.A.B. have consulted for Achilles Therapeutics. N.M. has stock options in and has consulted for Achilles Therapeutics. N.M. holds European patents relating to targeting neoantigens (PCT/EP2016/059401), identifying patient response to immune checkpoint blockade (PCT/EP2016/071471), determining HLA loss of heterozygosity (PCT/GB2018/052004) and predicting survival rates of patients with cancer (PCT/GB2020/050221). A.H. attended one advisory board for Abbvie, Roche and GRAIL, and reports personal fees from Abbvie, Boehringer Ingelheim, Takeda, AstraZeneca, Daiichi Sankyo, Merck Serono, Merck/MSD, UCB and Roche for delivering general education/training in clinical trials. A.H. owned shares in Illumina and Thermo Fisher Scientific (sold in 2020) and receives fees for membership of Independent Data Monitoring Committees for Roche-sponsored clinical trials. S.A.Q. is co-founder and Chief Scientific Officer of Achilles Therapeutics. A.C.H. is a board member and equity holder in ImmunoQure, AG and Gamma Delta Therapeutics, and is an equity holder in Adaptate Biotherapeutics and chair of the scientific advisory board. C.S. acknowledges grant support from Pfizer, AstraZeneca, Bristol Myers Squibb, Roche-Ventana, Boehringer Ingelheim, Archer Dx Inc (collaboration in minimal residual disease-sequencing technologies) and Ono Pharmaceuticals, is an AstraZeneca Advisory Board member and Chief Investigator for the MeRmaiD1 clinical trial. C.S has consulted for Amgen, AstraZeneca, Bicycle Therapeutics, Bristol Myers Squibb, Celgene, Genentech, GlaxoSmithKline, GRAIL, Illumina, Medixci, Metabomed, MSD, Novartis, Pfizer, Roche-Ventana and Sarah Cannon Research Institute. C.S. has stock options in Apogen Biotechnologies, Epic Biosciences and GRAIL, and has stock options and is co-founder of Achilles Therapeutics. C.S. holds patents relating: to assay technology to detect tumor recurrence (PCT/GB2017/053289); to targeting neoantigens (PCT/EP2016/059401), identifying patent response to immune checkpoint blockade (PCT/EP2016/071471), determining HLA loss of heterozygosity (PCT/GB2018/052004), predicting survival rates of patients with cancer (PCT/GB2020/050221); to treating cancer by targeting Insertion/deletion (indel) mutations (PCT/GB2018/051893); to identifying indel mutation targets (PCT/GB2018/051892); to methods for lung cancer detection (PCT/US2017/028013); and to identifying responders to cancer treatment (PCT/GB2018/051912). The remaining authors declare no competing interests.

Figures

Fig. 1
Fig. 1. Experimental design and γδ T cell composition in lung tissues and NSCLCs.
a, Overview of study design. Paired tumor regions (red) and NT lung tissues (blue) collected under the TRACERx Study were enzymatically digested to extract tissue/TILs. TILs were cryopreserved and thawed at a later date for flow cytometry ± RNA-seq. In parallel, gDNA was extracted from undigested matched tumor regions and NT lung tissues and sent for subsequent quantitative TCR-seq. In addition, PBMCs were isolated from contemporaneous blood draws and cryopreserved before subsequent thaw for flow cytometry. b, Percentage of CD3+ T cells staining for TCRγδ (left) and percentage of TCRγδ T cells staining for Vδ1 (middle) and Vδ2 (right) in PBMCs (blood), NT lung tissues (tissue) and tumors (tumor). Not all patients had paired samples. The bar represents the median. The Kruskal–Wallis test with post-hoc Dunn’s test corrected for multiple testing was used. c, Absolute counts of total T cells, αβ T cells (TRA), γδ T cells (TRD) and Vδ1 (TRDV1) and Vδ2 (TRDV2) T cells per microgram of DNA determined by TCR-seq. Absolute counts of CD4+ αβ T cells (CD4) and CD8+ αβ T cells (CD8) were determined by mapping the proportion of CD3+/TCRγδ T cells staining for CD4 or CD8 in flow cytometry analysis of paired TILs. No significant differences were observed within demarcated T cell subsets between NT tissues and tumors. Samples with <1 cell μg−1 of DNA were not plotted for the purposes of visualization. The bar represents the median. A two-tailed Mann–Whitney U-test was used within demarcated T cell subsets. Significant P values are shown. NS, not significant. The n numbers and datapoints represent independent patients. Source data
Fig. 2
Fig. 2. NT lung tissue harbors tissue-resident Vδ1T cells that are enriched in NSCLCs.
a, Representative plots of CD103 expression (%) by flow cytometry on Vδ1 (representing n = 20, n = 23 and n = 22 patients for blood, NT tissue and tumor, respectively) and Vδ2 (representing n = 20, n = 23 and n = 21 patients for blood, NT tissue and tumor, respectively), CD4+ (representing n = 20, n = 24 and n = 24 patients for blood, NT tissue and tumor, respectively) and CD8+ T cells (representing n = 20, n = 24 and n = 24 patients for blood, NT tissue and tumor, respectively) were isolated from blood, NT tissue and tumor of one patient. b, Summary flow cytometry data of CD103 expression in T cell subsets isolated from blood (Bld), NT tissues (Tis) and tumors (Tum). Not all patients had paired samples. The bar represents the median. A Kruskal–Wallis test with a post-hoc Dunn’s test corrected for multiple testing was used. c, Absolute counts of CD103+ TRM CD4+, CD8+, Vδ1 and Vδ2 T cells per microgram of DNA from NT tissues and tumors. Samples with <1 cell μg−1 of DNA were not plotted for the purposes of visualization. Not all patients had paired samples. The bar represents the median. A two-tailed Mann–Whitney U-test was used within demarcated T cell subsets. Significant P values are shown. NS, not significant. The n numbers and datapoints represent independent patients. Source data
Fig. 3
Fig. 3. Intratumoral Vδ1 T cells have a memory phenotype, are Tc1 skewed and demonstrate features of tissue residency and stemness.
a, Representative flow cytometry plots of effector memory status (defined by CD27 and CD45RA expression) of Vδ1 T cells isolated from the NT tissue and tumor of one patient (representing n = 23 and n = 22 patients for NT tissue and tumor, respectively). b, Summary radar plot of effector memory status of Vδ1 T cells isolated from NT tissues (n = 23) and tumors (n = 22). The median proportion is plotted. A two-tailed Mann–Whitney U-test was used between NT tissue and tumor within Vδ1 memory subsets. Significant P values are shown. c, Expression of T cell master transcription factors and signature effector molecules of lymphocytes sorted directly from tumors grouped into TH cell, cytolytic and inhibitory modules. Each column represents the denoted cell type from an individual patient. Not all cell types were sorted from matched patients. The color scale denotes the z-score of log2(TPM + 1) of each gene. d, PCA of expression (normalized counts) of genes included in c colored by cell type (n = 9, n = 9, n = 7, n = 5, n = 3 and n = 5 patients for CD4+, CD8+, NK, Treg, Vδ2 and Vδ1 cells, respectively). e, Violin plots showing intracellular cytokine staining for IFN-γ and IL-17A and cell surface staining for CD107A in Vδ1, CD8+ and CD4+ T cells after in vitro stimulation of bulk TILs (n = 3 patients) with PMA and ionomycin (P-I). f, Summary data of correlation between region-matched gene expression of NKG2D ligands and absolute numbers of Vδ1 (n = 14 patients), Vδ2 (n = 14 patients), CD4+ (n = 15 patients) and CD8+ (n = 15 patients) TRM and TEM cells in tumors. The color scale denotes a two-tailed Spearman’s r. * denotes significant correlations as follows: MICA:Vδ1 TEM P = 0.027, MICB:Vδ1 TEM P = 0.031, RAET1E:Vδ1 TEM P = 0.048 and RAET1E:CD8 TEM P = 0.045. g, PCA of expression (normalized counts) of core TRM gene signature (CCR7, CD69, CXCR6, ITGAE, ITGA1, S1PR1 and SELL) in Vδ1 (n = 5 patients), CD4+ (n = 9 patients) and CD8+ T cells (n = 9 patients) sorted from tumors. h, Expression of genes that define ‘stem-like’ CD8+ T cells in Vδ1 (n = 5 patients), CD4+ (n = 9 patients) and CD8+ (n = 9 patients) T cells sorted from tumors. The mean ± s.d. is plotted. A Kruskal–Wallis test with post-hoc Dunn’s test correction for multiple testing was used. All datapoints represent independent patients. Source data
Fig. 4
Fig. 4. Presence of Vd1 T cells associates with RFS in resected NSCLCs.
a, RFS split on median absolute numbers of Vδ1, Vδ2, CD4+ and CD8+ TEM cells in tumors. The Gehan–Breslow–Wilcoxon test was used. b, RFS split on median absolute numbers of Vδ1, Vδ2, CD4+ and CD8+ TRM cells in NT tissues. The Gehan–Breslow–Wilcoxon test was used. c, Proportion of unique Vδ1 (TRDV1) T cell clones present in tumors and also found in paired NT tissues. The bar represents the median. A two-tailed Mann–Whitney U-test was used. d, Proportion of unique αβ (TRA) T cell clones present in tumors and also found in paired NT tissues. The bar represents the median. A two-tailed Mann–Whitney U-test was used. Significant P values are shown. NS, not significant. The n numbers and datapoints represent independent patients. Source data
Fig. 5
Fig. 5. Expression of TRDV1 gene predicts NSCLC survival in TCGA and survival post-pembrolizumab in advanced solid cancers.
a, OS of patients with LUAD or LUSC in TCGA split on median TRDV1 expression in primary tumor as a proxy for intratumoral Vδ1 T cells (n = 815 patients). The Gehan–Breslow–Wilcoxon test was used. b, OS of the same cohort of patients split on median TRDC expression as a proxy for intratumoral γδ T cells (n = 815 patients). The Gehan–Breslow–Wilcoxon test was used. NS, not significant. c, HRs for death in patients with above-median intratumoral expression of TRDC or TRDV1 in UVA (n = 815 patients) and MVA (n = 774 patients) with age, gender, histology, smoking status, stage and CD4 and CD8B gene expression. Rounded rectangles denote HRs and error bars denote 95% CIs. d, OS of patients with advanced solid cancers (mixed histologies) treated with pembrolizumab in the INSPIRE trial. There was a survival split on median TRDV1 expression in primary tumor before pembrolizumab. The results were plotted in months after the third cycle of pembrolizumab. The Gehan–Breslow–Wilcoxon test was used. Significant P values are shown. Source data
Extended Data Fig. 1
Extended Data Fig. 1. Lung γδ T cells assayed by flow cytometry and TCR sequencing.
A) Representative flow cytometry gating strategy for T cell subsets. From left to right: Forward vs. side scatter gate -> singlet gate -> live CD45 + gate -> CD3 vs. TCRγδ -> CD4 vs. CD8 (of CD3 + /TCRγδ- population) and Vδ1 vs. Vδ2 (of CD3 + / TCRγδ + population) to give CD4 and CD8 αβ T cells and Vδ1 and Vδ2 γδ T cells. B) Representative gating strategy for CD103 and CD45RA vs. CD27 for Vδ1 and Vδ2 γδ T cells, and CD4 and CD8 αβ T cells. C) Proportion of T cell subsets determined by flow cytometry versus proportion determined by TCRseq in NT tissues (n = 23 patients) and tumours (n = 22 patients). Two-tailed Spearman correlation. Significant p values shown. All datapoints represent independent patients. Source data
Extended Data Fig. 2
Extended Data Fig. 2. TCRδ is expressed in non-diseased lung tissues.
A) Expression of TRDC across non-diseased tissue types. B) Expression of TRDV1 across non-diseased tissue types. C) Expression of TRDV2 across non-diseased tissue types. Gene expression data and figures derived from the GTEx Project and Portal (see methods). Lung expression (red arrow) based on 578 donors. Boxplots represent median and interquartile range with outliers (above or below 1.5x IQR) displayed as points. Tissues ordered from highest to lowest median expression of each gene. Datapoints represent independent donors.
Extended Data Fig. 3
Extended Data Fig. 3. Lung TIL lineages by RNA sequencing.
A) Gating strategy for sorting CD4, CD8, Vδ1 and Vδ2 T cells and Tregs and NK cells (red/bold) for bulk cell-type RNA sequencing. B) PCA of top 500 variable genes coloured by cell type from tumours (n = 9, n = 9, n = 7, n = 5, n = 3 and n = 5 patients for CD4+, CD8+, NK, Treg, Vδ2 and Vδ1 cells respectively) and NT tissue (n = 8, n = 7, n = 8, n = 1, n = 2 and n = 2 patients for CD4+, CD8+, NK, Treg, Vδ2 and Vδ1 cells respectively). C) Expression of canonical lineage markers from sorted cell types. Lineage markers for each sorted cell type coloured in. Cells sorted from NT tissues denoted by crossed-circles (n = 8, n = 7, n = 8, n = 1, n = 2 and n = 2 patients for CD4+, CD8+, NK, Treg, Vδ2 and Vδ1 cells respectively) and cells sorted from lung tumours denoted by solid circles (n = 9, n = 9, n = 7, n = 5, n = 3 and n = 5 patients for CD4+, CD8+, NK, Treg, Vδ2 and Vδ1 cells respectively). All datapoints represent independent patients. Source data
Extended Data Fig. 4
Extended Data Fig. 4. Peripheral blood γδ T cell functional transcriptomes.
Expression of T cell master transcription factors and signature effector molecules of peripheral blood lymphocytes from the Blood Atlas project. Each column represents the denoted cell type from an individual donor. Colour scale denotes Z-score of Log2 (TPM + 1) of each gene. Source data
Extended Data Fig. 5
Extended Data Fig. 5. Effector function of in vitro stimulated TILs from NSCLCs.
Representative flow cytometry dot plots of intracellular cytokine staining for IFN-γ and IL-17A and cell surface staining for CD107A in Vδ1, CD8 and CD4 T cells after in vitro stimulation of bulk tumour infiltrating lymphocytes with PMA and ionomycin (P-I). Gates were set on paired unstimulated negative controls (-). Percentage positive of parent population shown.
Extended Data Fig. 6
Extended Data Fig. 6. Tumour Vδ1 T cells demonstrate no evidence of clonotypic responses.
A) Repertoire analysis by normalised Shannon entropy (S.E.) of Vδ1 T cells in NT tissue (Tis) and paired lung tumours (Tum) calculated on TCRδ CDR3 amino-acid sequences. Wilcoxon matched-pairs signed rank test. B) Repertoire analysis by D50 of Vδ1 T cells in NT tissue (Tis) and paired lung tumours (Tum) calculated on TCRδ CDR3 amino-acid sequences. Wilcoxon matched-pairs signed rank test. C) Relative expression (TPM) of functional TCRγ Vγ genes in sorted intra- tumoural Vδ1 T cells from 5 patients and Vδ2 from 3 patients. All datapoints represent independent patients. Source data
Extended Data Fig. 7
Extended Data Fig. 7. Tumour Vδ1 T cells possess a core TRM signature.
Expression of core TRM signature genes in Vδ1, CD8, and CD4 T cells sorted from tumours (n = 5, n = 9 and n = 9 patients respectively). Genes associated with tissue retention and homing and expected to be upregulated in TRM T cells highlighted in red. Genes associated with tissue egress and expected to be downregulated in TRM T cells highlighted in blue. Mean + /- S.D. plotted. Kruskal Wallis with post hoc Dunn’s test corrected for multiple testing. All datapoints represent independent patients. Source data
Extended Data Fig. 8
Extended Data Fig. 8. Prognostic value of Vδ1 T cells is largely independent of other prognostic clinicopathological features.
A) Absolute numbers of Vδ1 TEM cells in tumours plotted by TNM stage, histology and smoking status (never smoker, unfilled circle) as well as against age and primary size. Kruskal Wallis with post hoc Dunn’s test corrected for multiple testing (stage). Bar=median. Mann-Whitney test (histology and smoking status). Spearman correlation (primary size and age). B) Relapse free survival split on median absolute numbers of Vδ1 Trm cells in tumours. Gehan-Breslow- Wilcoxon test. C) Absolute numbers of Vδ1 TEM cells in NT tissues plotted by TNM stage, histology and smoking status (never smoker, unfilled circle) as well as against age and primary size. Bar=median. Kruskal Wallis with post hoc Dunn’s test corrected for multiple testing (stage). Mann-Whitney test (histology and smoking status). Spearman correlation (primary size and age). D) ΔVδ1 TEM cells (absolute Vd1 TEM cells in tumour - absolute Vd1 TEM cells in paired NT tissue) and ΔVδ1 TRM cells (absolute Vd1 TRM cells in tumour - absolute Vd1 TRM cells in paired NT plotted by outcome. Bar=median. Mann-Whitney test. N numbers and datapoints represent independent patients. Source data
Extended Data Fig. 9
Extended Data Fig. 9. Association of survival with signature T cell lineage genes in the INSPIRE Trial.
Overall survival of patients with advanced solid cancers (mixed histologies) treated with pembrolizumab in the INSPIRE trial. Survival split on median TRDC, TRDV2, CD4 and CD8B expression in primary tumour prior to pembrolizumab. Plotted in months after third cycle of pembrolizumab. Gehan-Breslow-Wilcoxon test. Significant p values shown. n.s. not significant. Source data

Comment in

  • γδ T cells share the spotlight in cancer.
    Conejo-Garcia JR, Innamarato P. Conejo-Garcia JR, et al. Nat Cancer. 2022 Jun;3(6):657-658. doi: 10.1038/s43018-022-00396-9. Nat Cancer. 2022. PMID: 35764741 No abstract available.

References

    1. Allen EMV, et al. Genomic correlates of response to CTLA-4 blockade in metastatic melanoma. Science. 2015;350:207–211. doi: 10.1126/science.aad0095. - DOI - PMC - PubMed
    1. Rizvi NA, et al. Mutational landscape determines sensitivity to PD-1 blockade in non-small cell lung cancer. Science. 2015;348:124–128. doi: 10.1126/science.aaa1348. - DOI - PMC - PubMed
    1. McGranahan N, et al. Clonal neoantigens elicit T cell immunoreactivity and sensitivity to immune checkpoint blockade. Science. 2016;351:1463–1469. doi: 10.1126/science.aaf1490. - DOI - PMC - PubMed
    1. Hellmann, M. D. et al. Nivolumab plus ipilimumab in lung cancer with a high tumor mutational burden. N. Engl. J. Med.10.1056/nejmoa1801946 (2018). - PMC - PubMed
    1. Tumeh PC, et al. PD-1 blockade induces responses by inhibiting adaptive immune resistance. Nature. 2014;515:568–571. doi: 10.1038/nature13954. - DOI - PMC - PubMed

Publication types

Substances