. 2022 Jun;24(6):954-967.
doi: 10.1038/s41556-022-00919-7. Epub 2022 May 30.

Cancer-cell-secreted extracellular vesicles suppress insulin secretion through miR-122 to impair systemic glucose homeostasis and contribute to tumour growth

Affiliations

Cancer-cell-secreted extracellular vesicles suppress insulin secretion through miR-122 to impair systemic glucose homeostasis and contribute to tumour growth

Minghui Cao et al. Nat Cell Biol. 2022 Jun.

Abstract

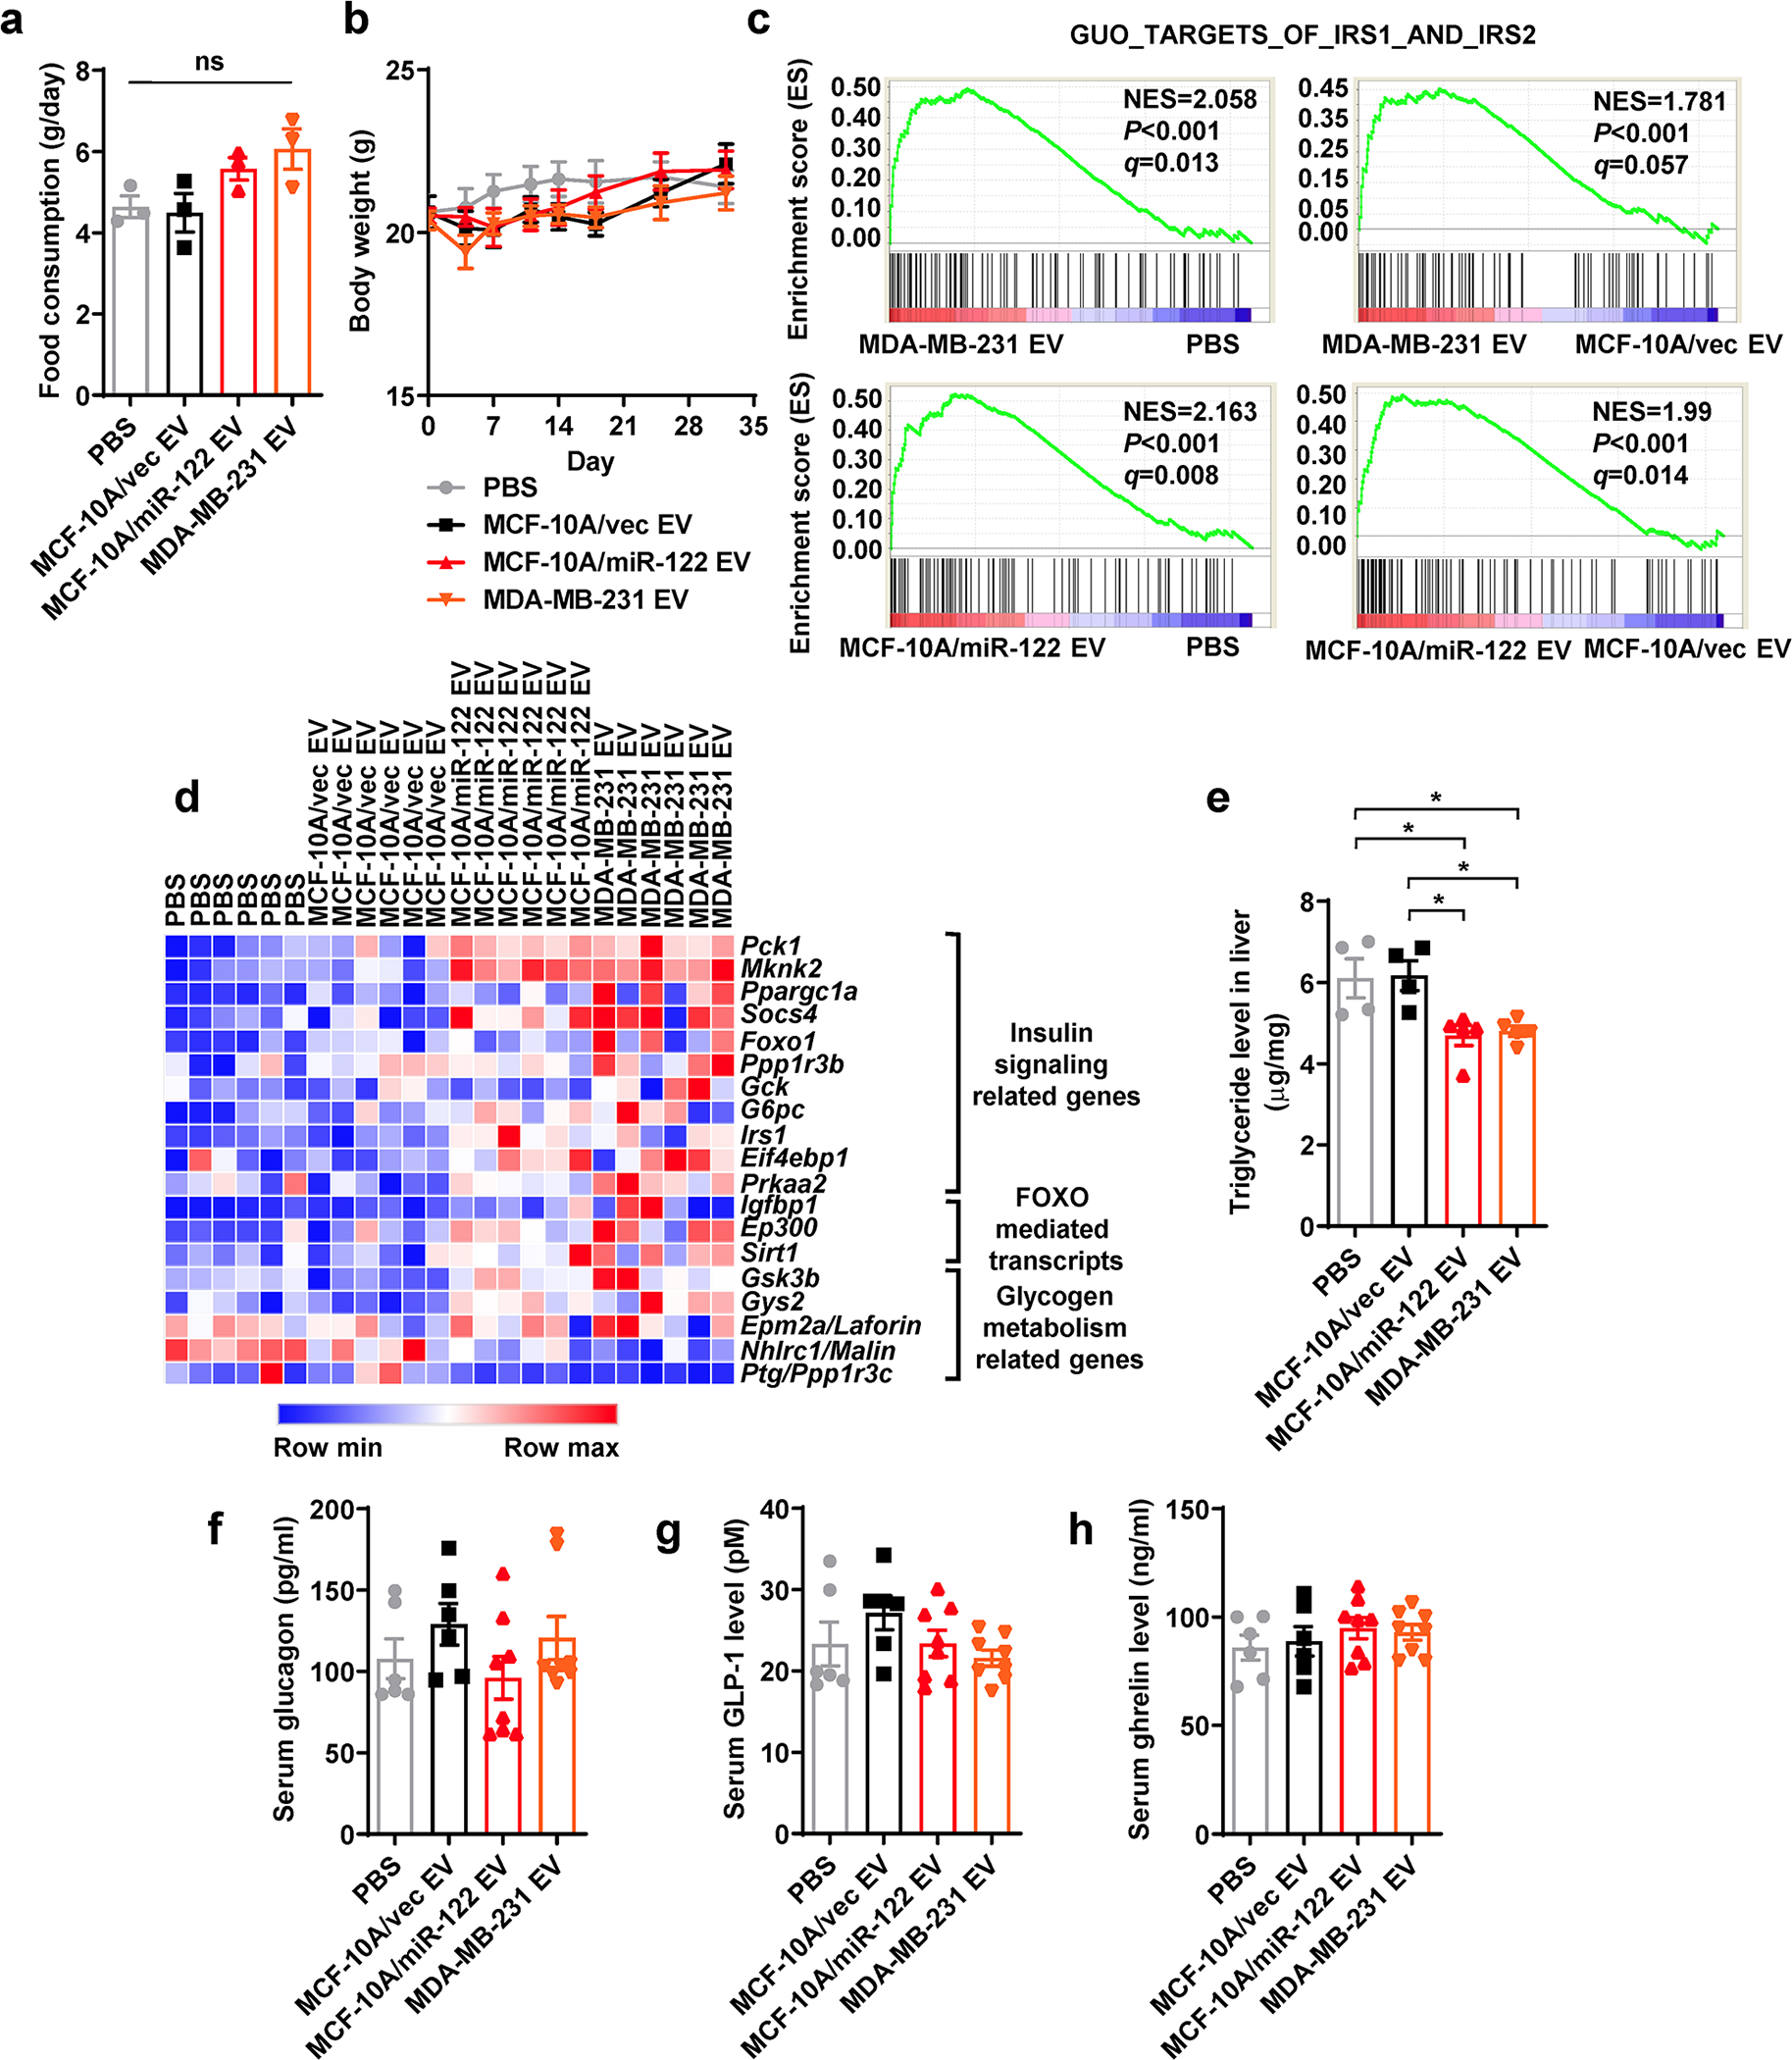
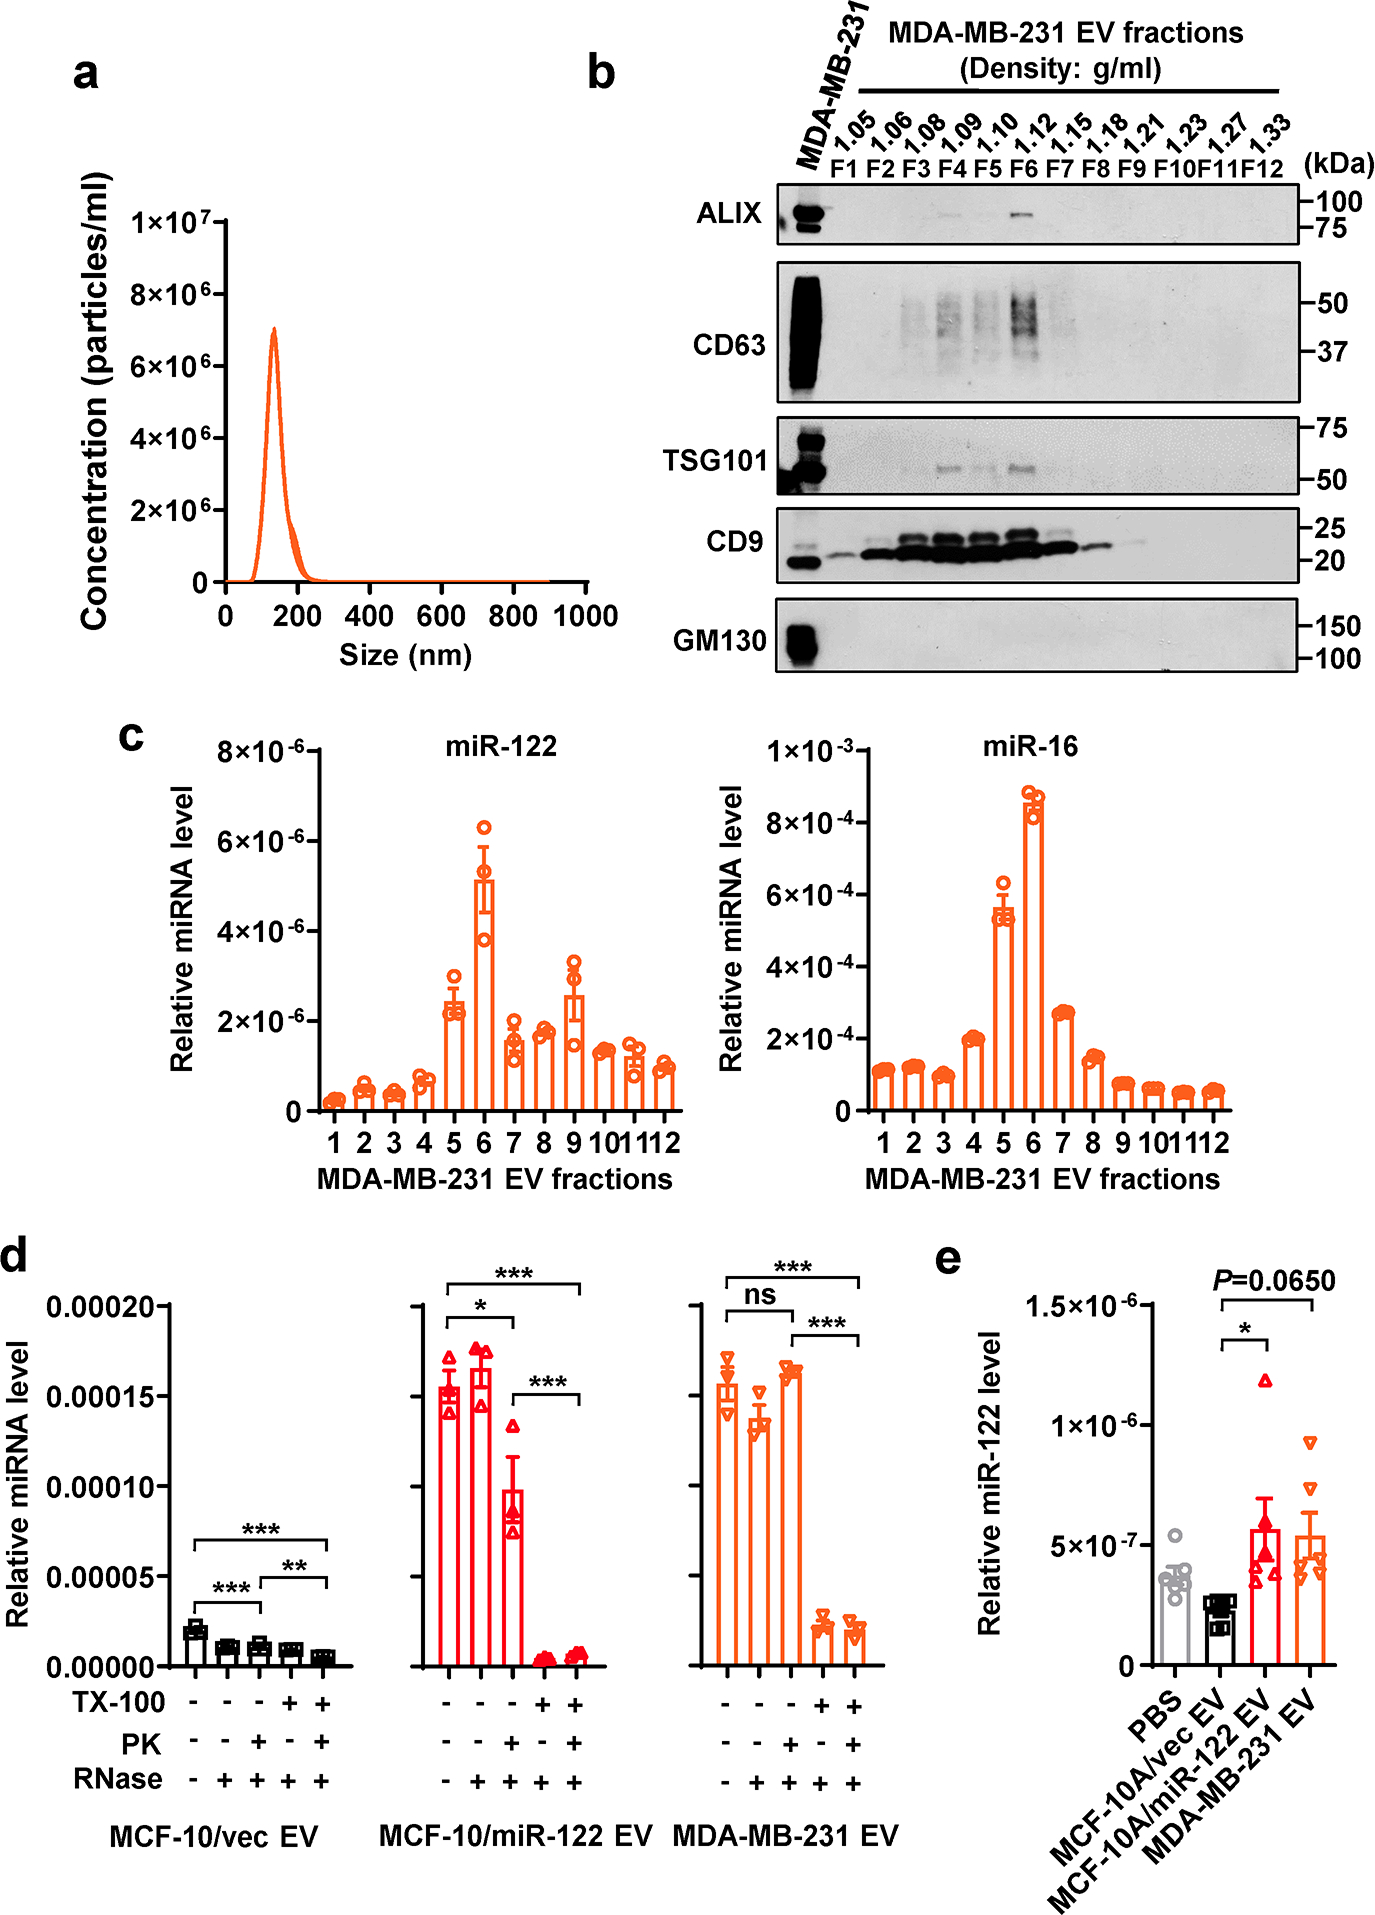
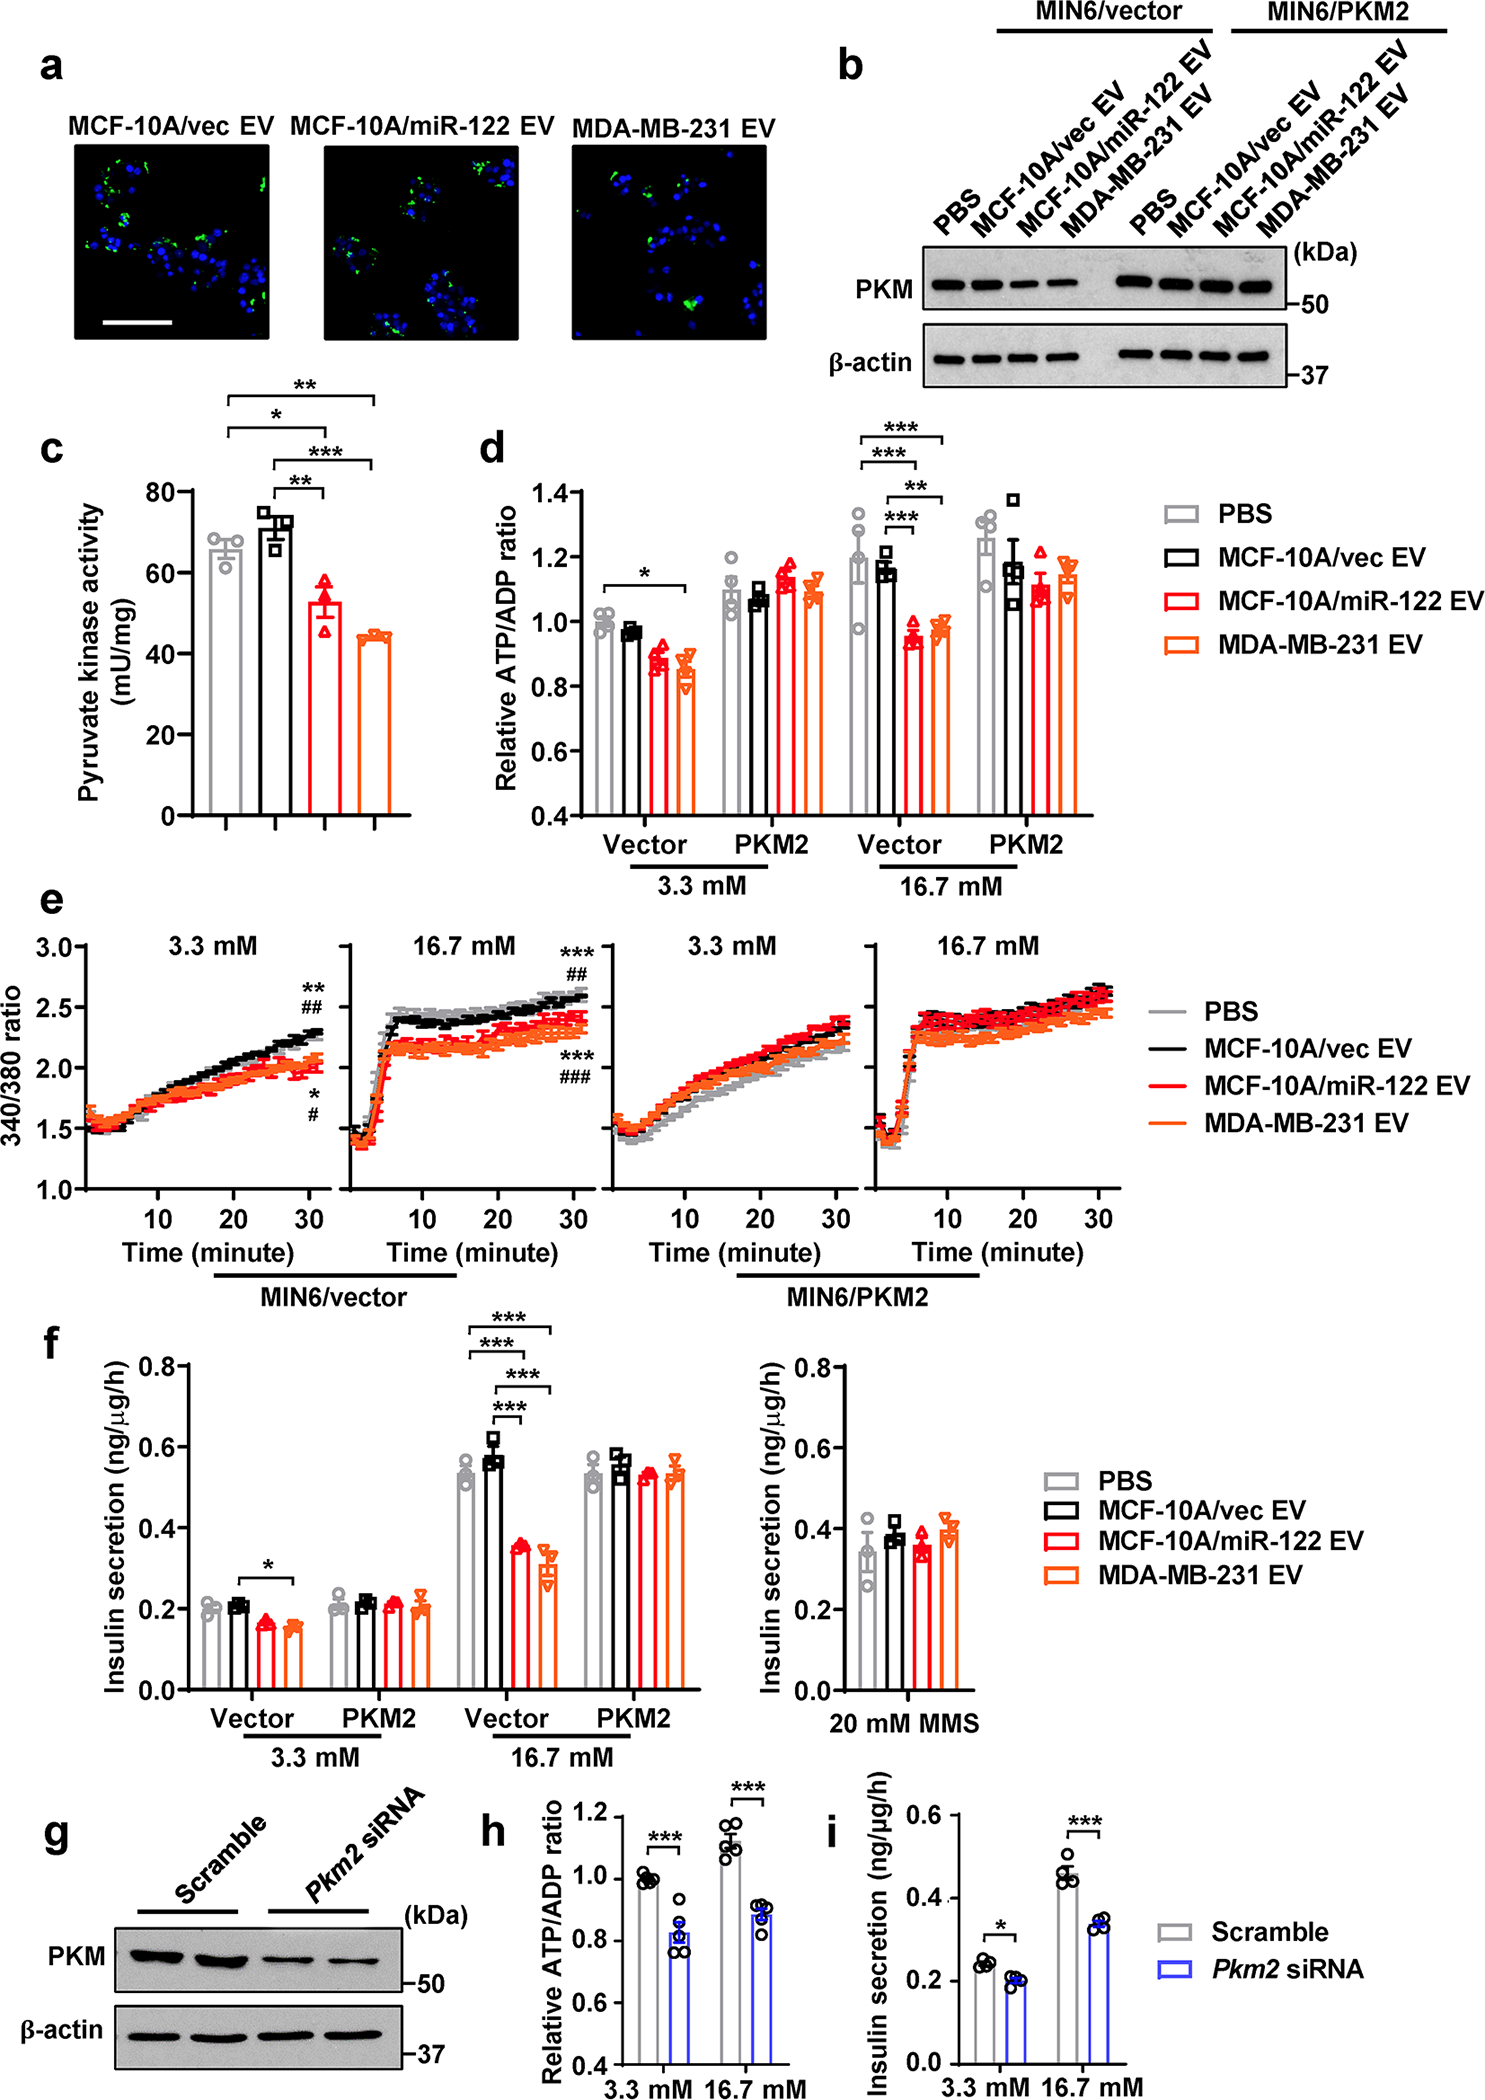
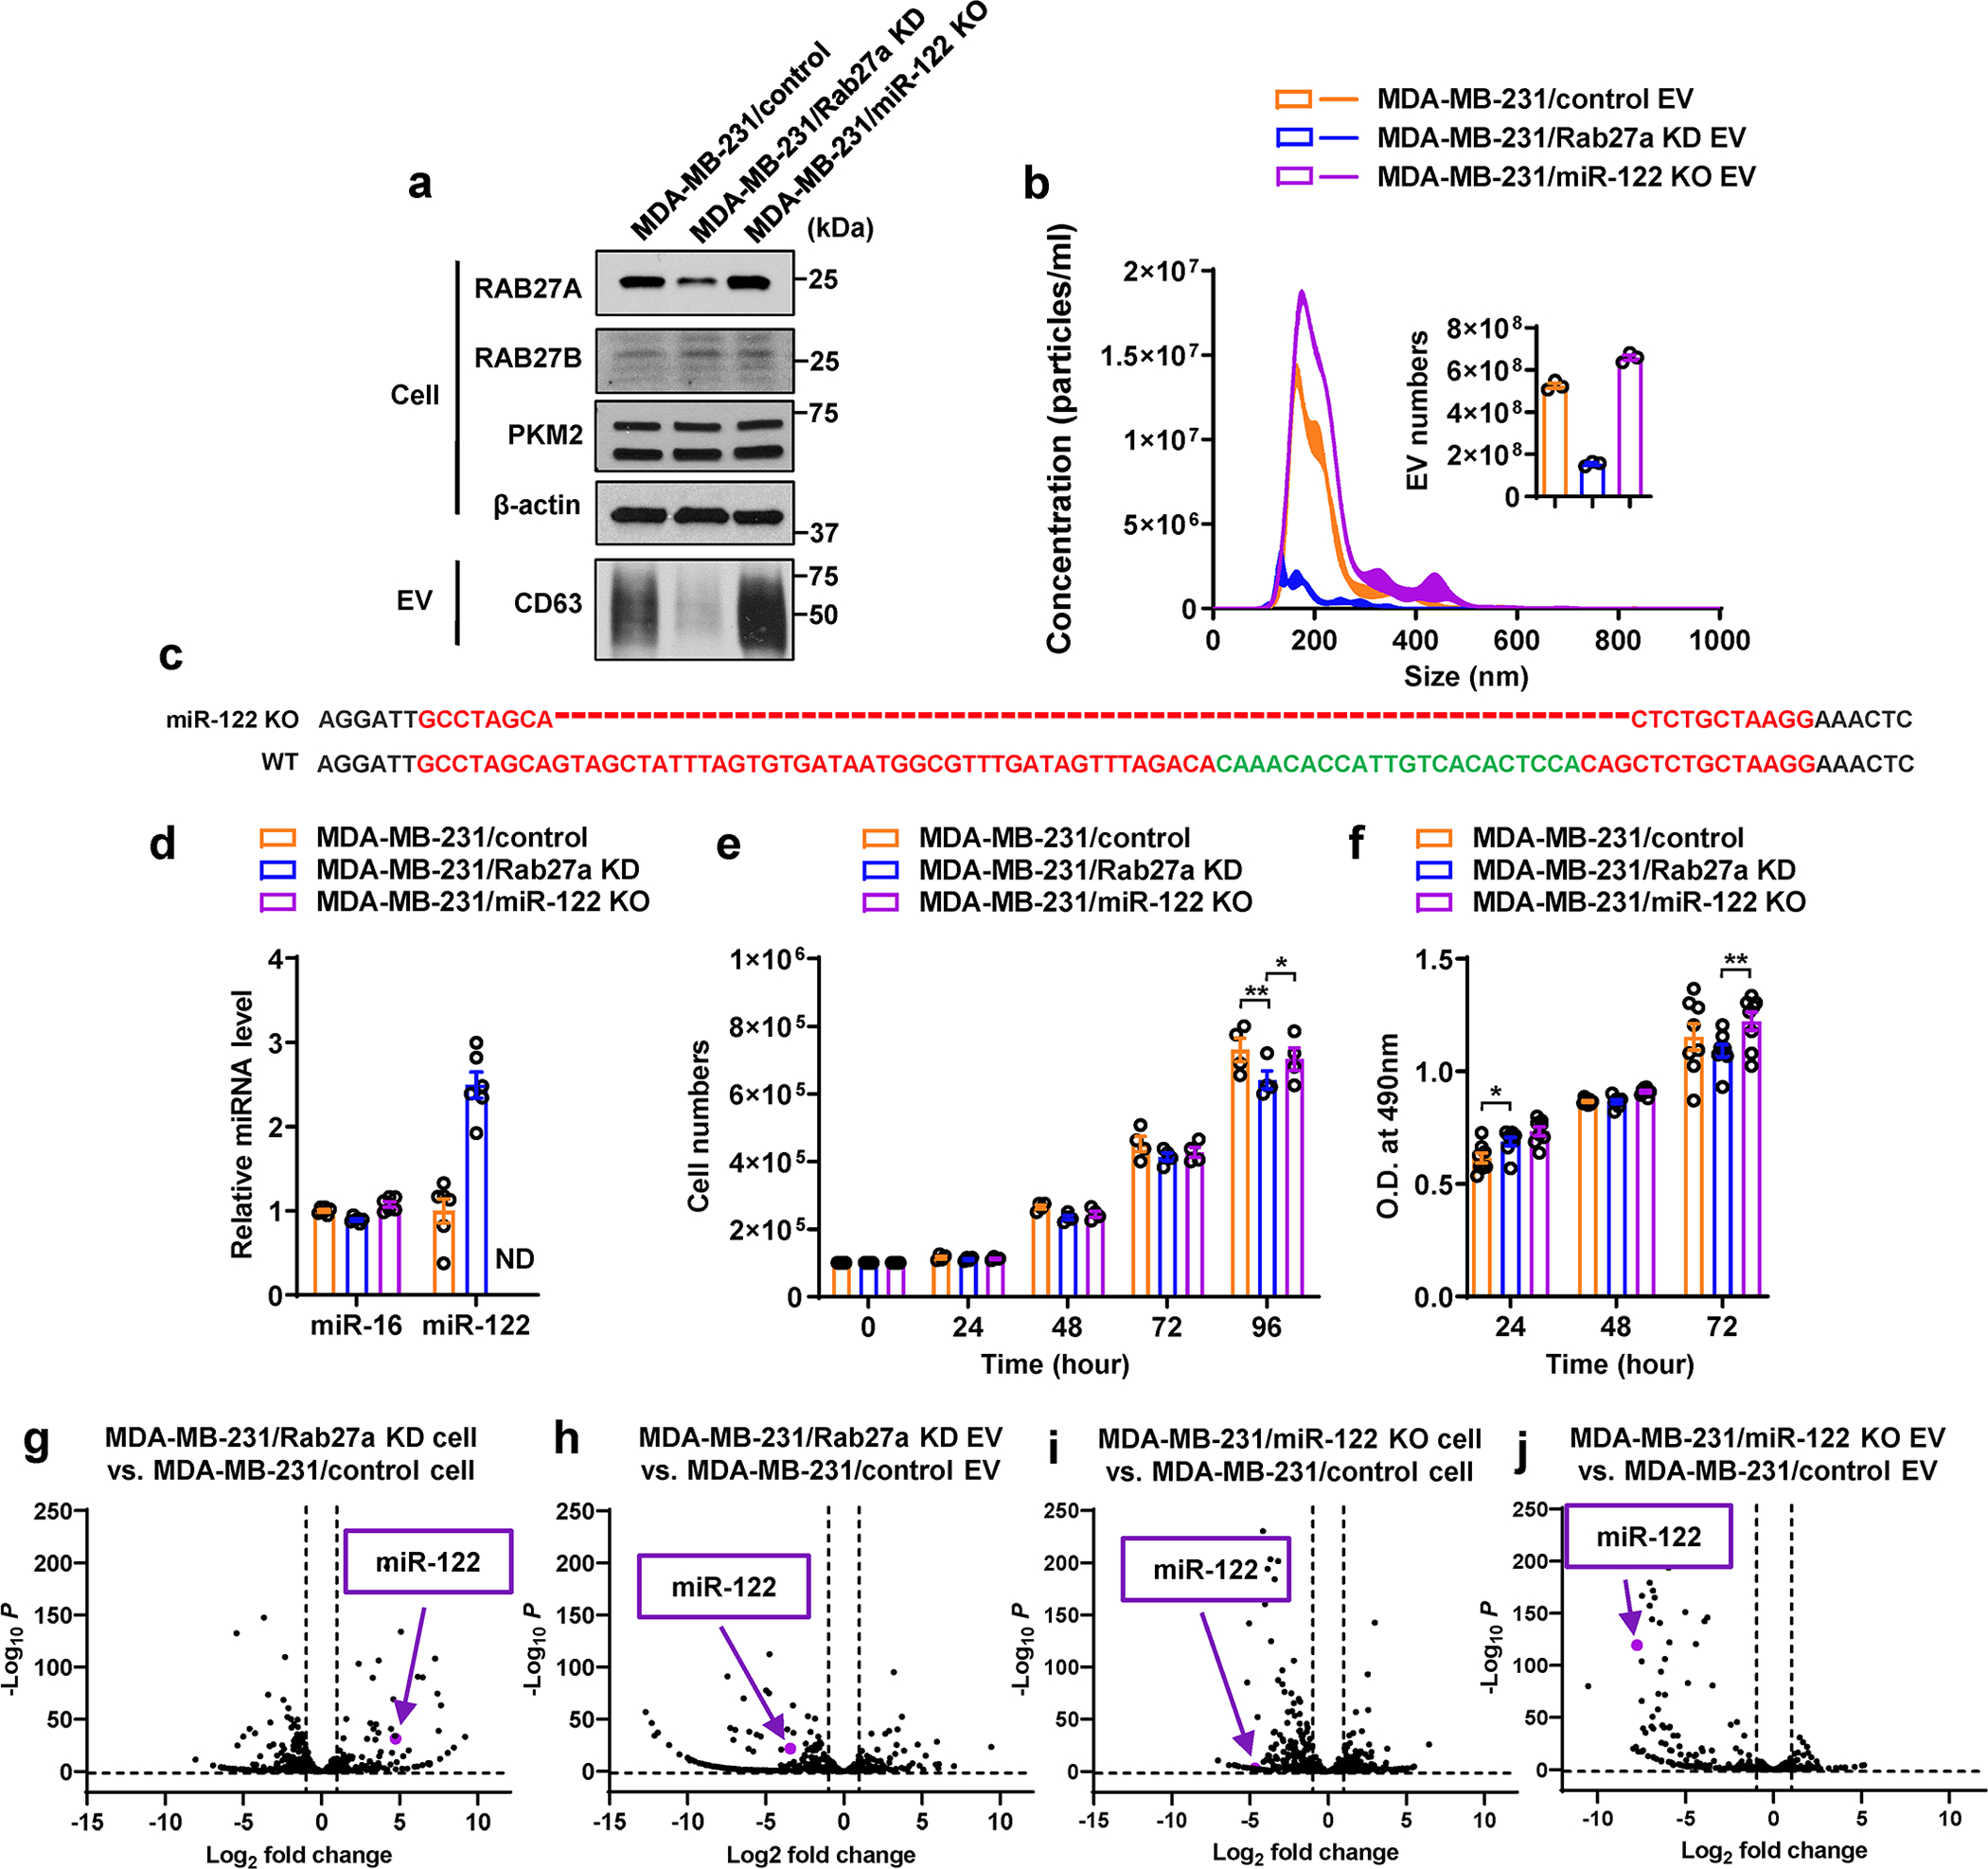
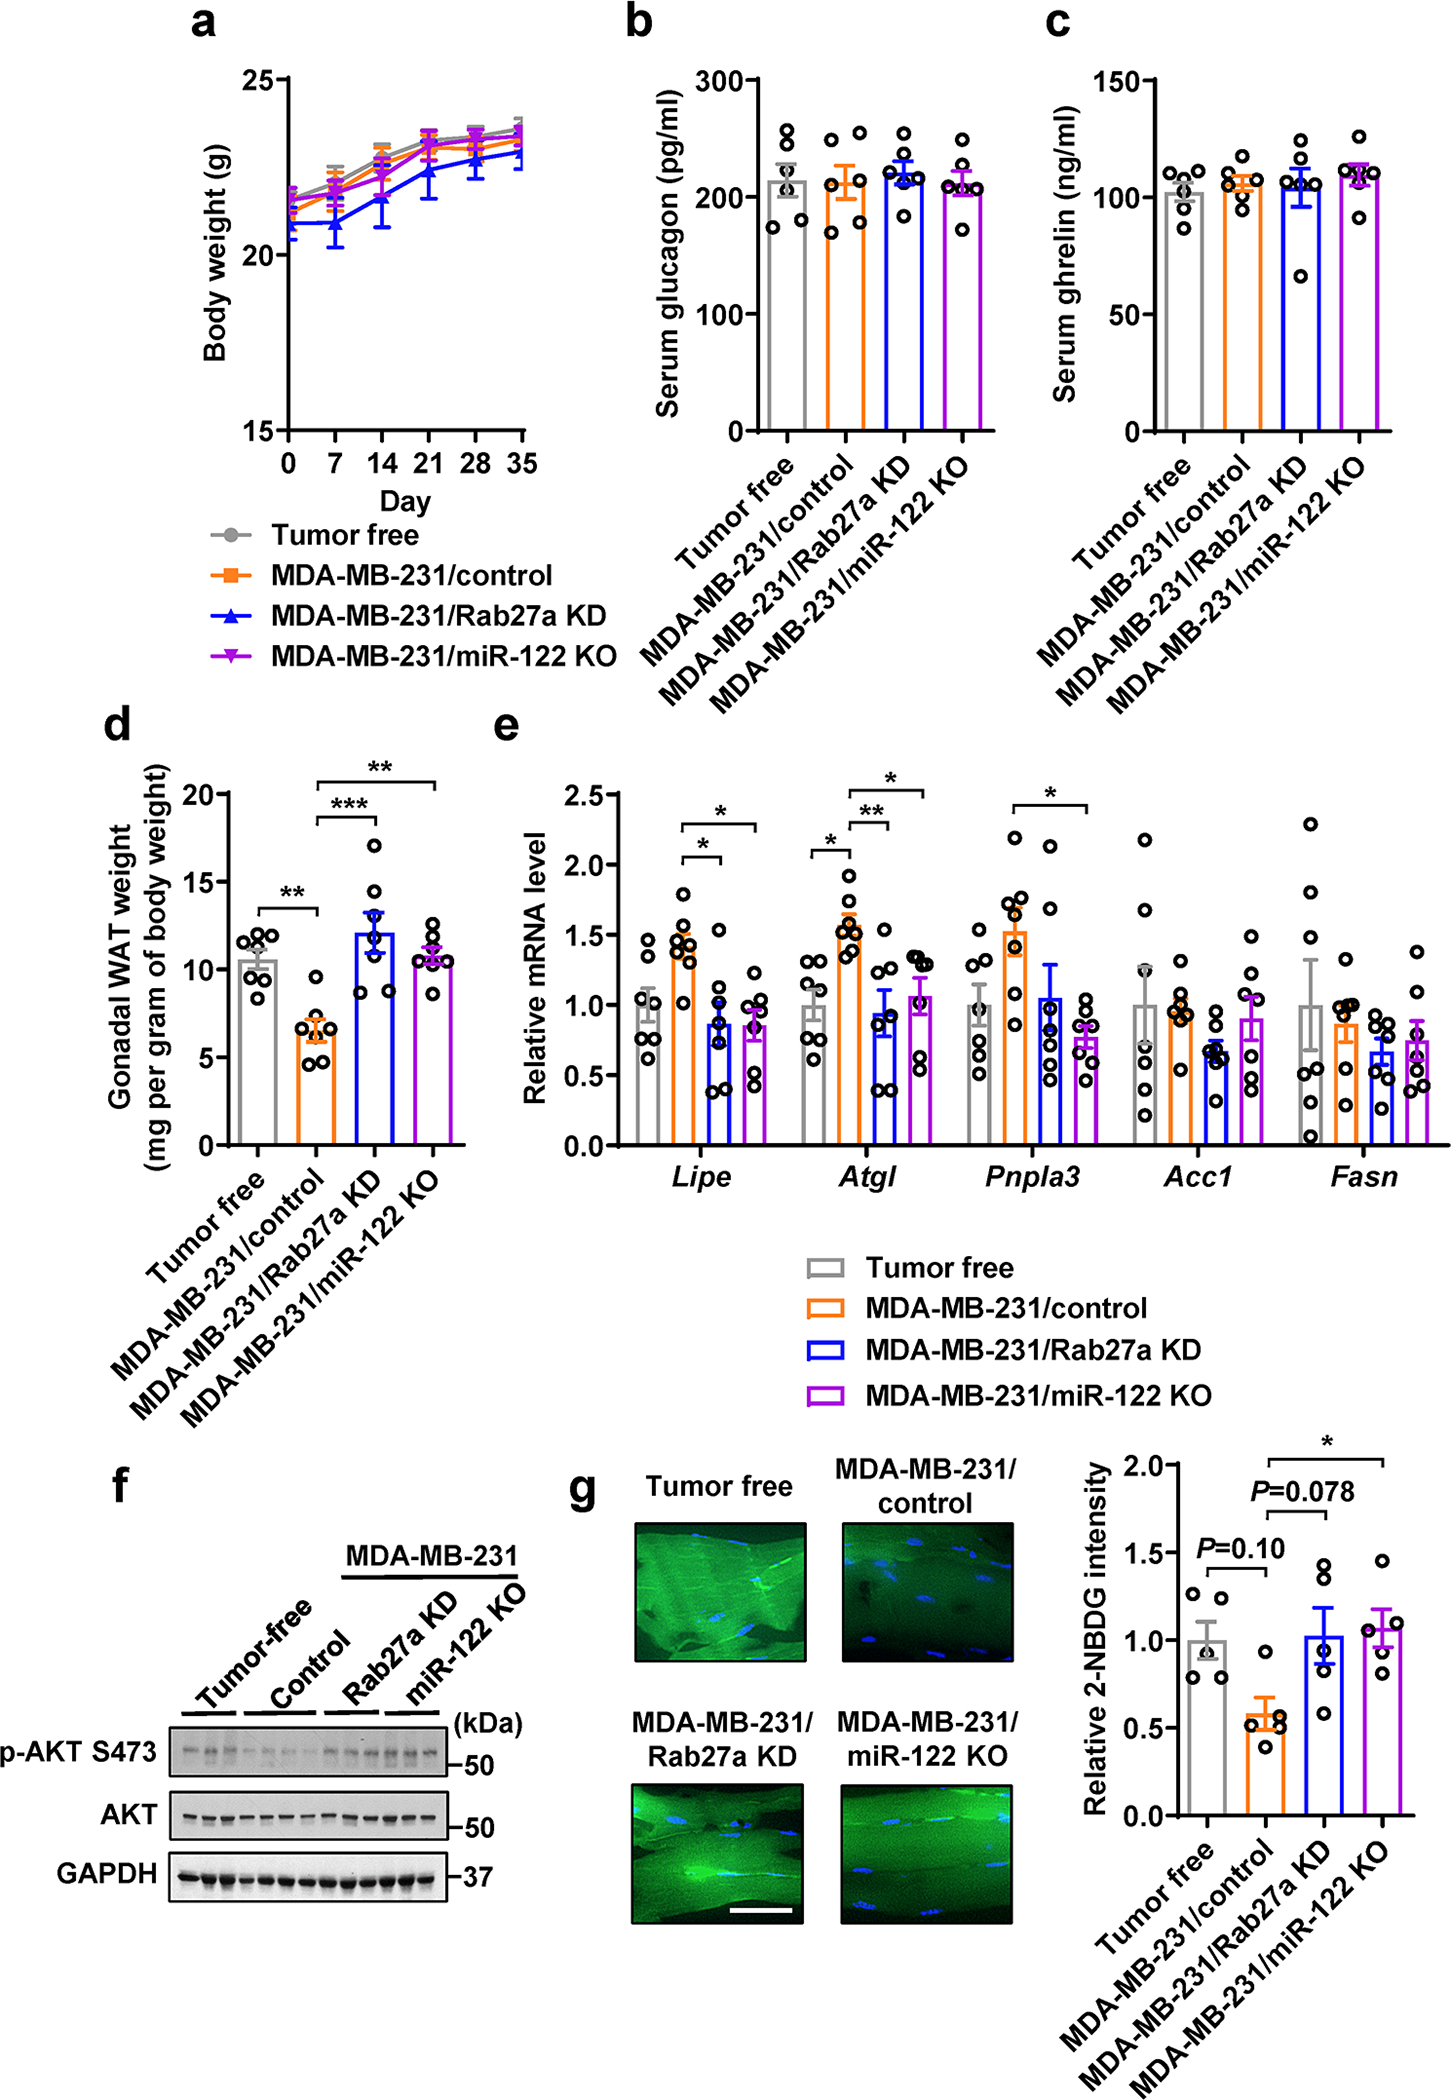
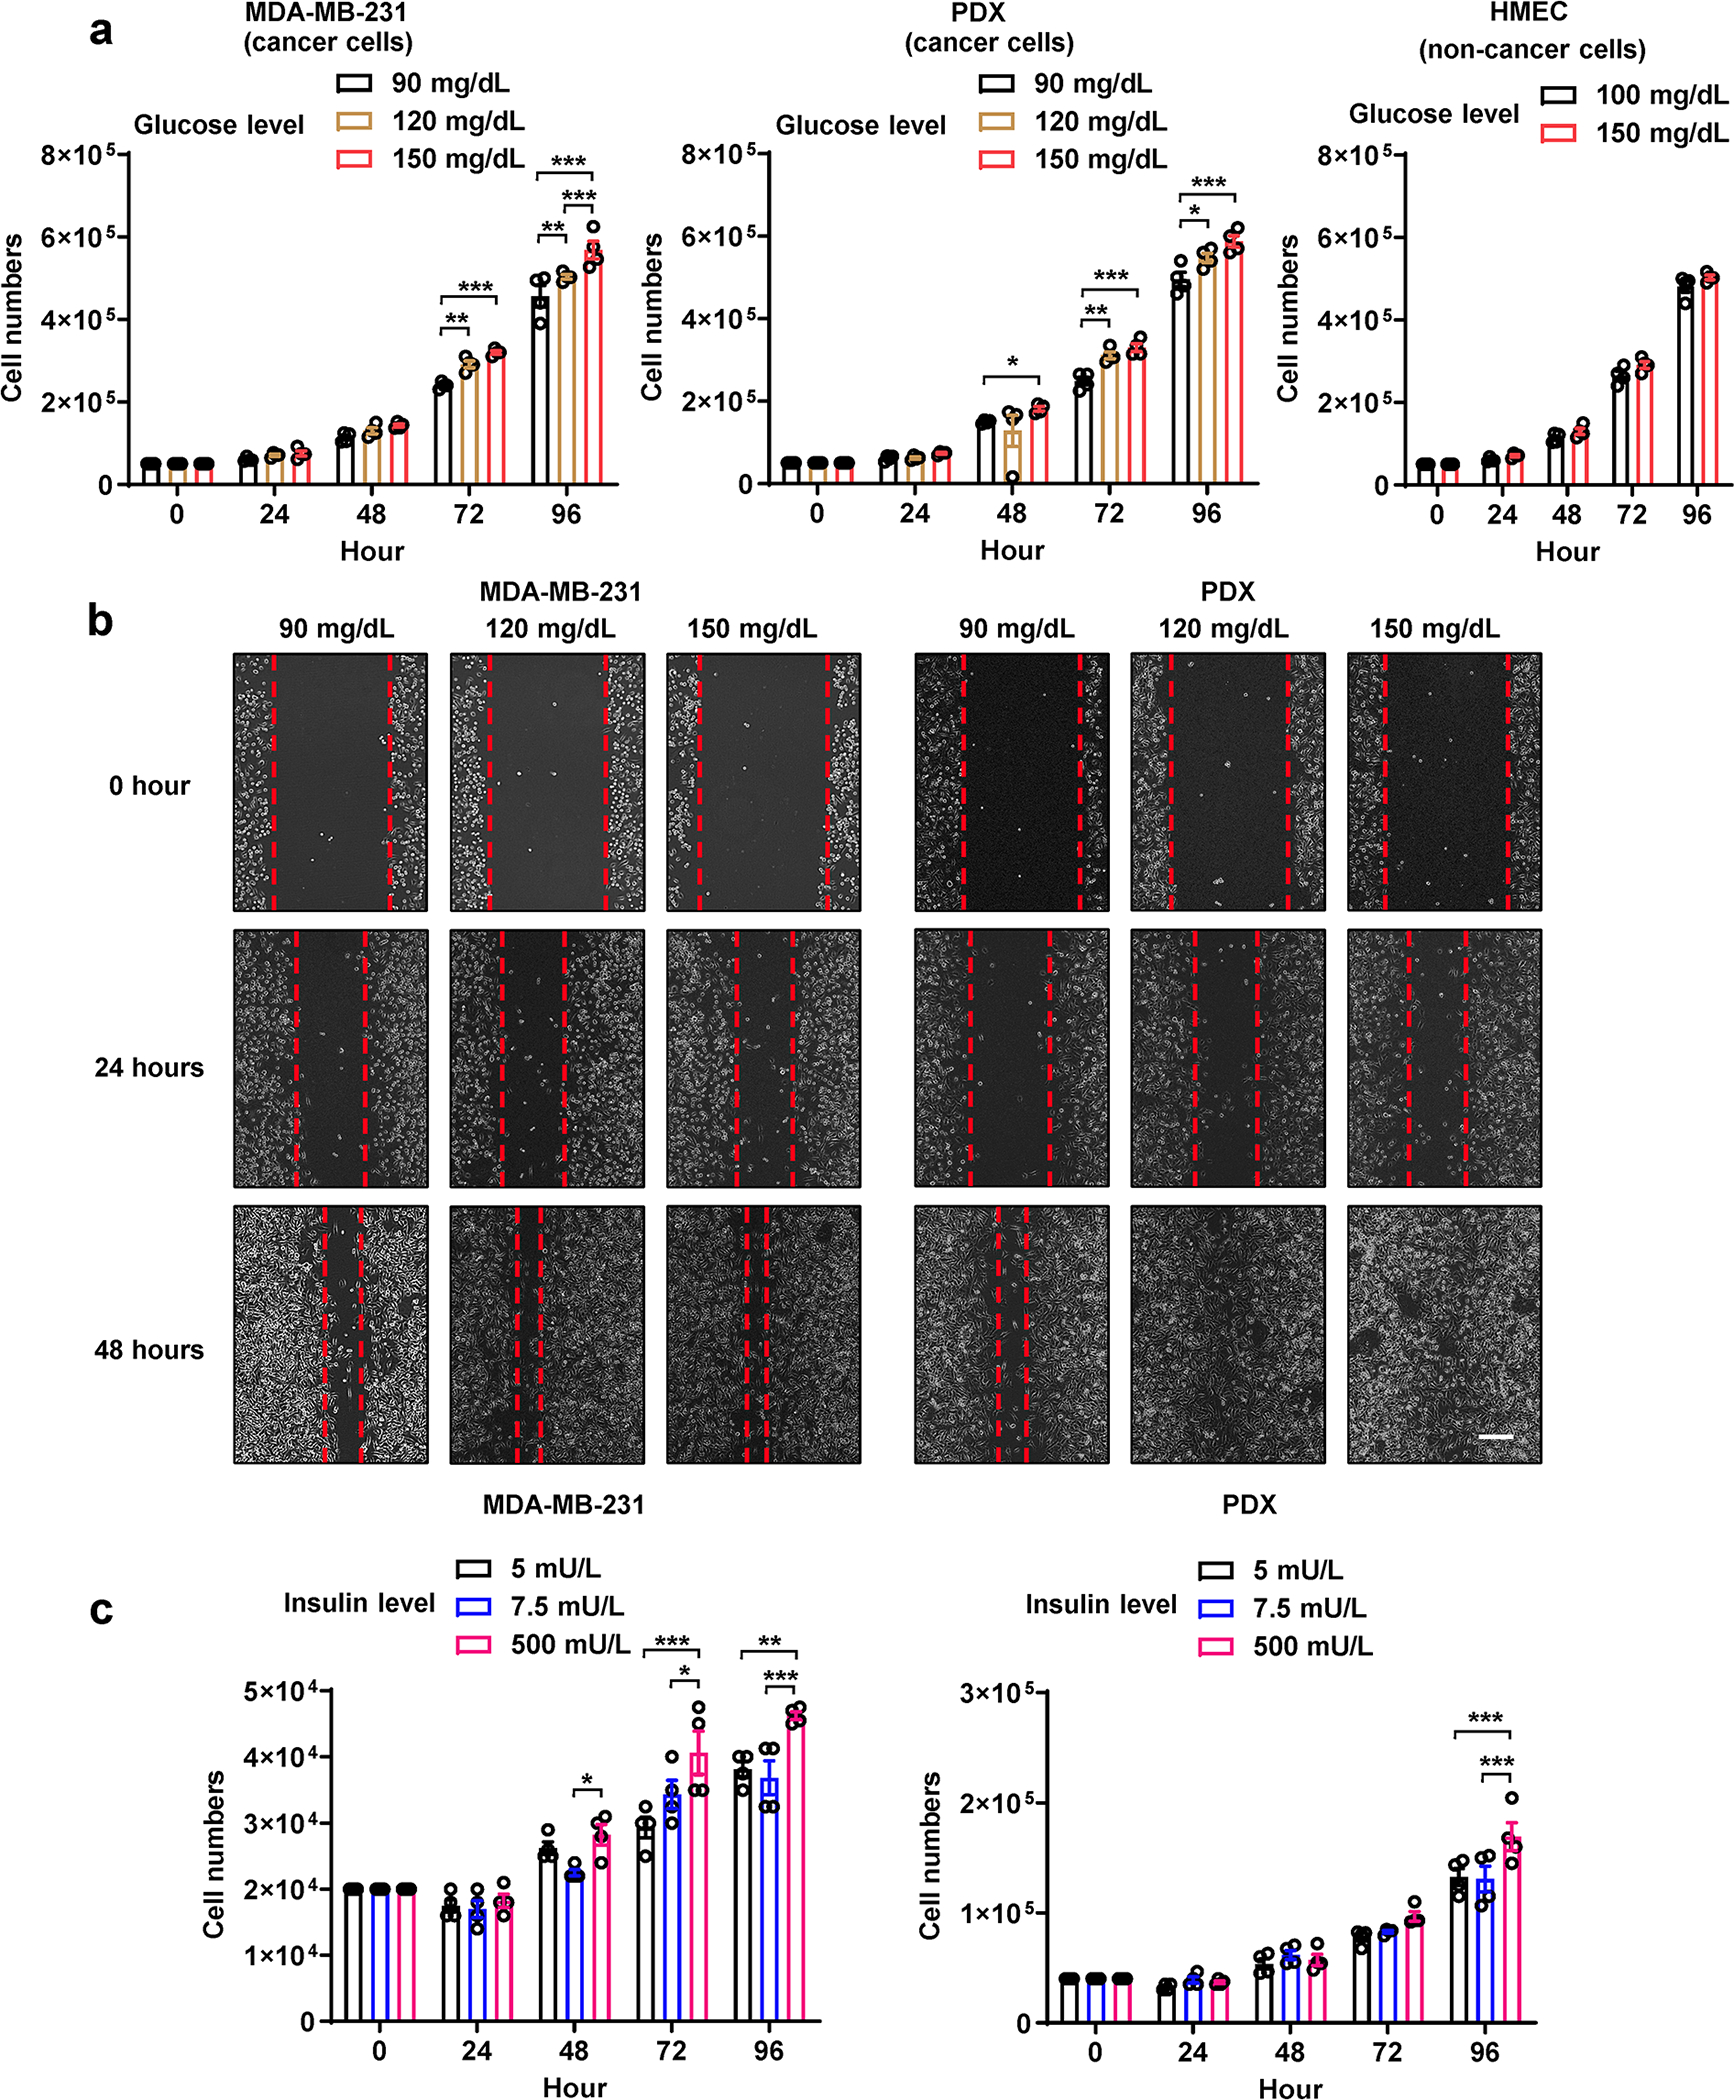
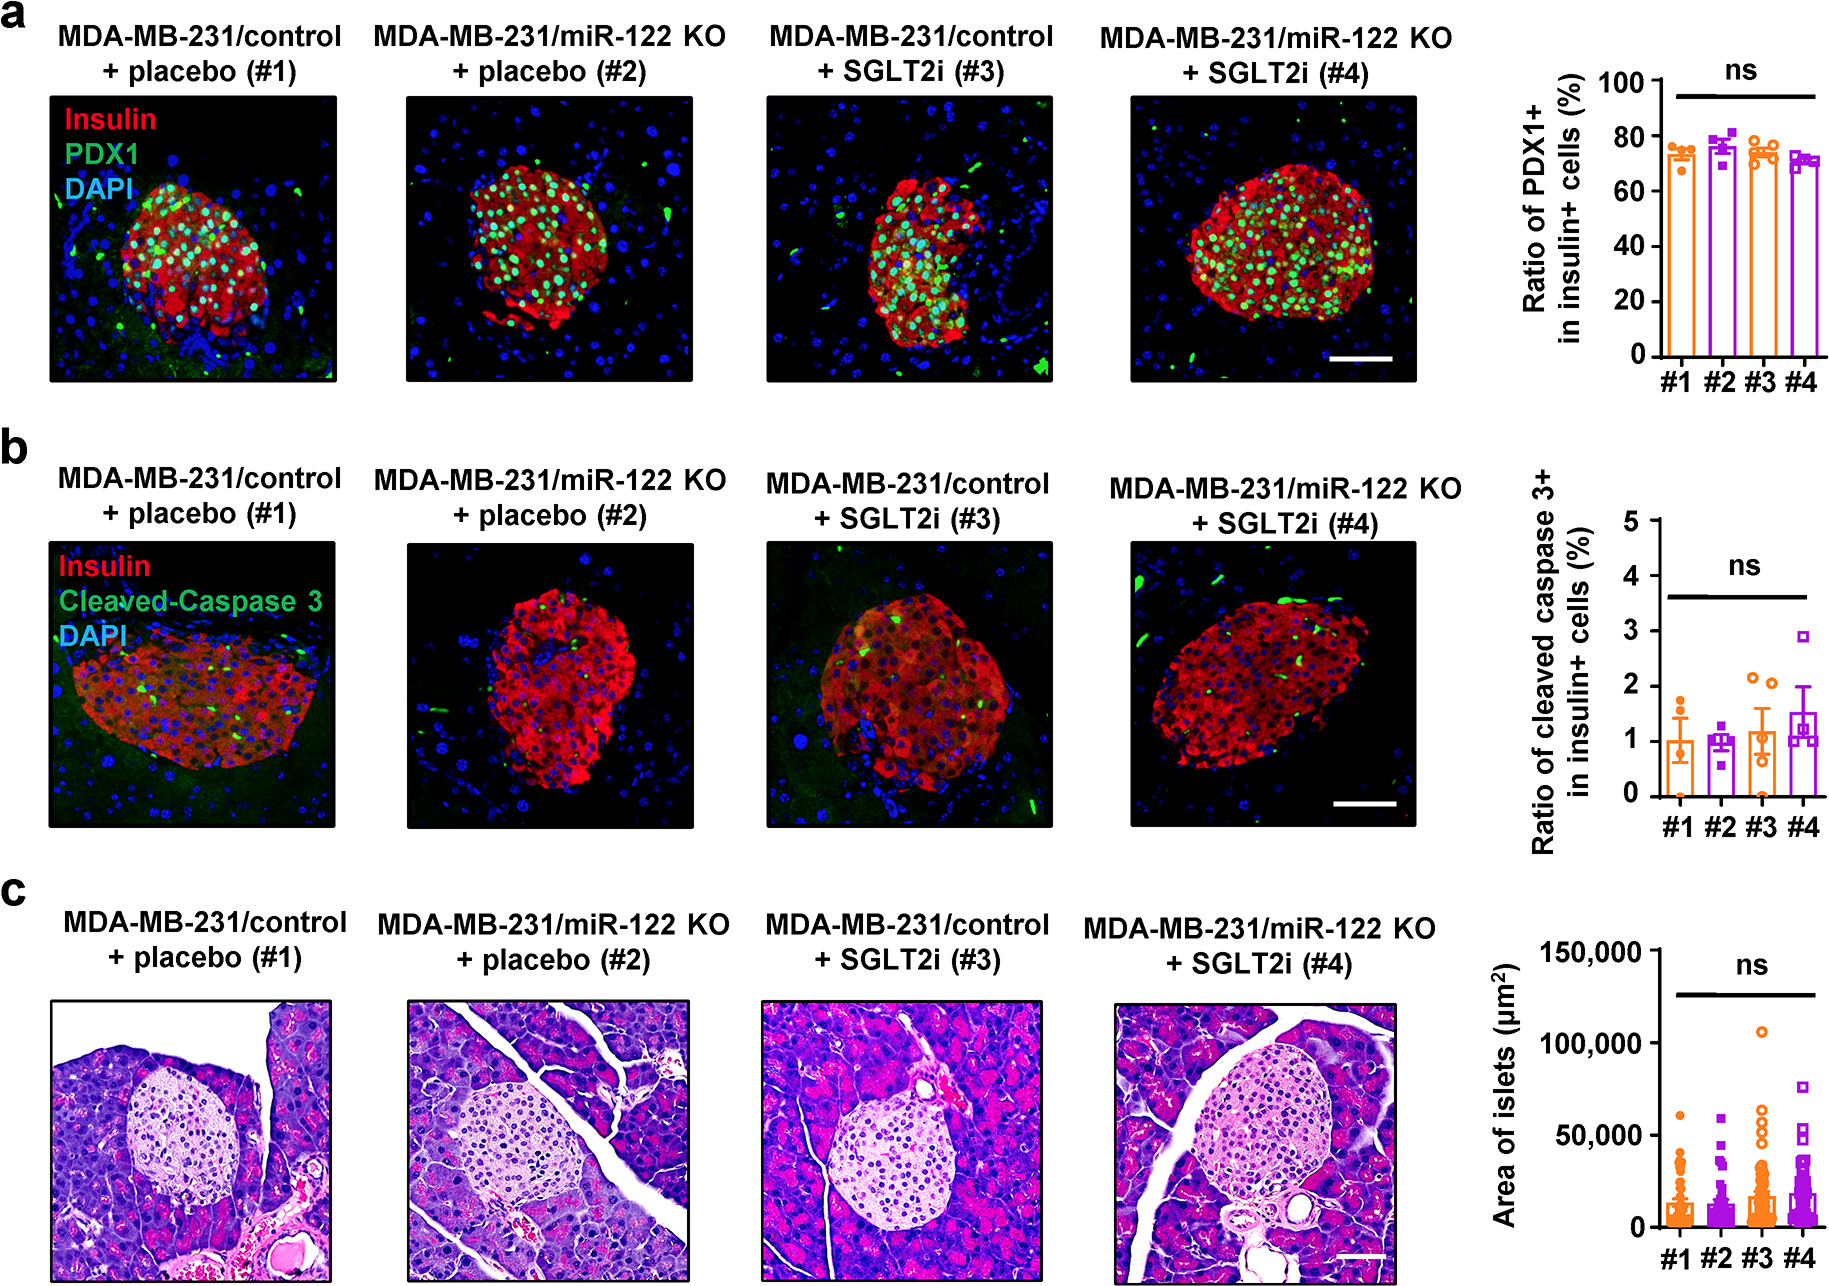
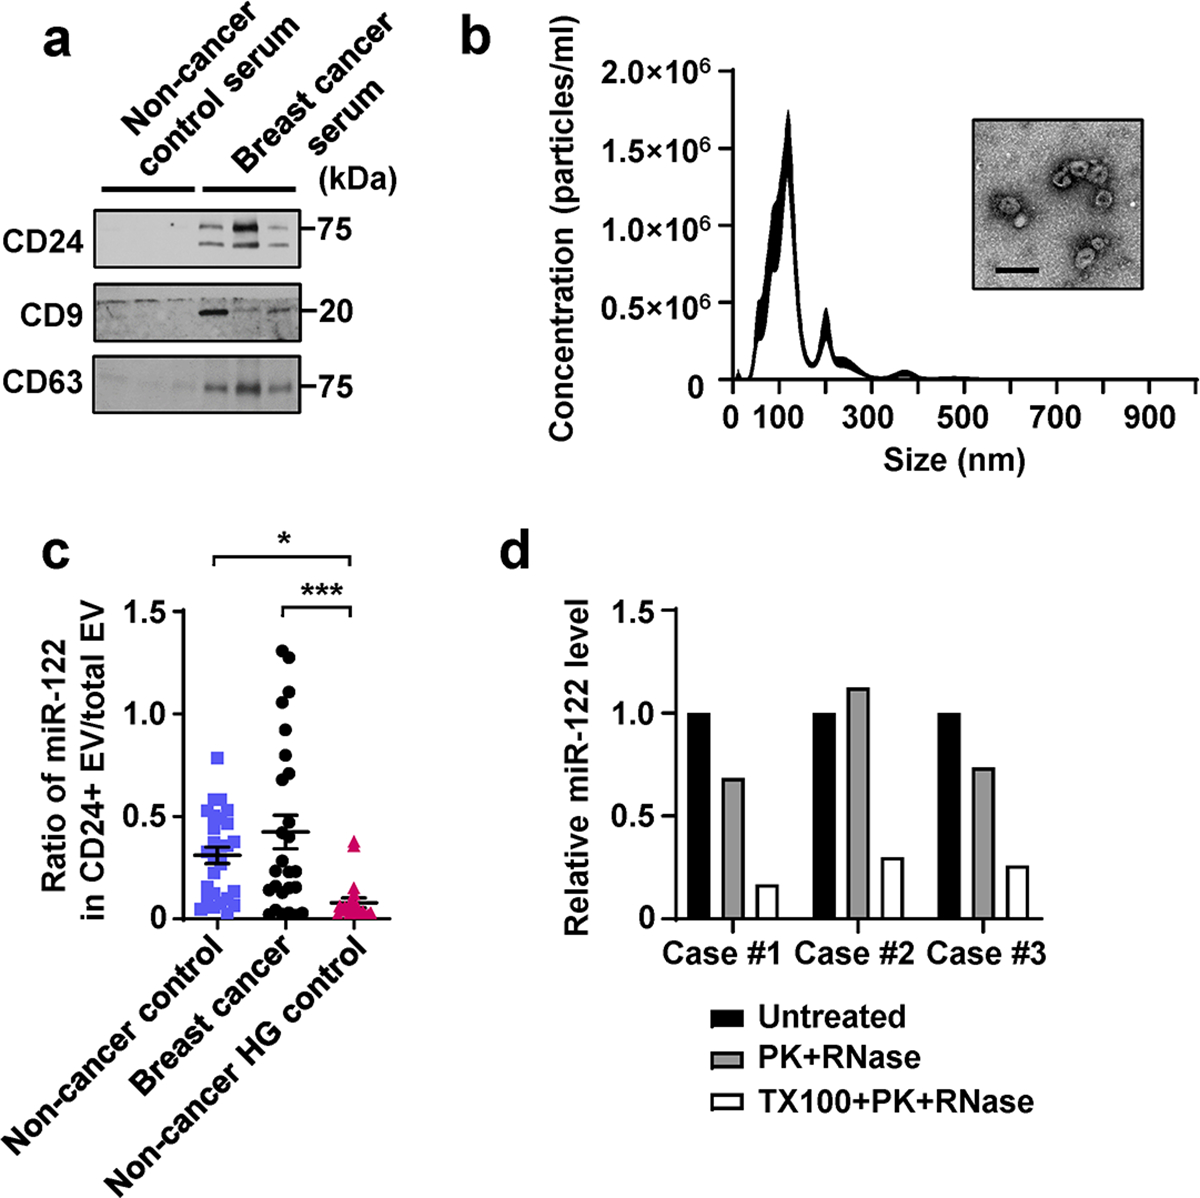
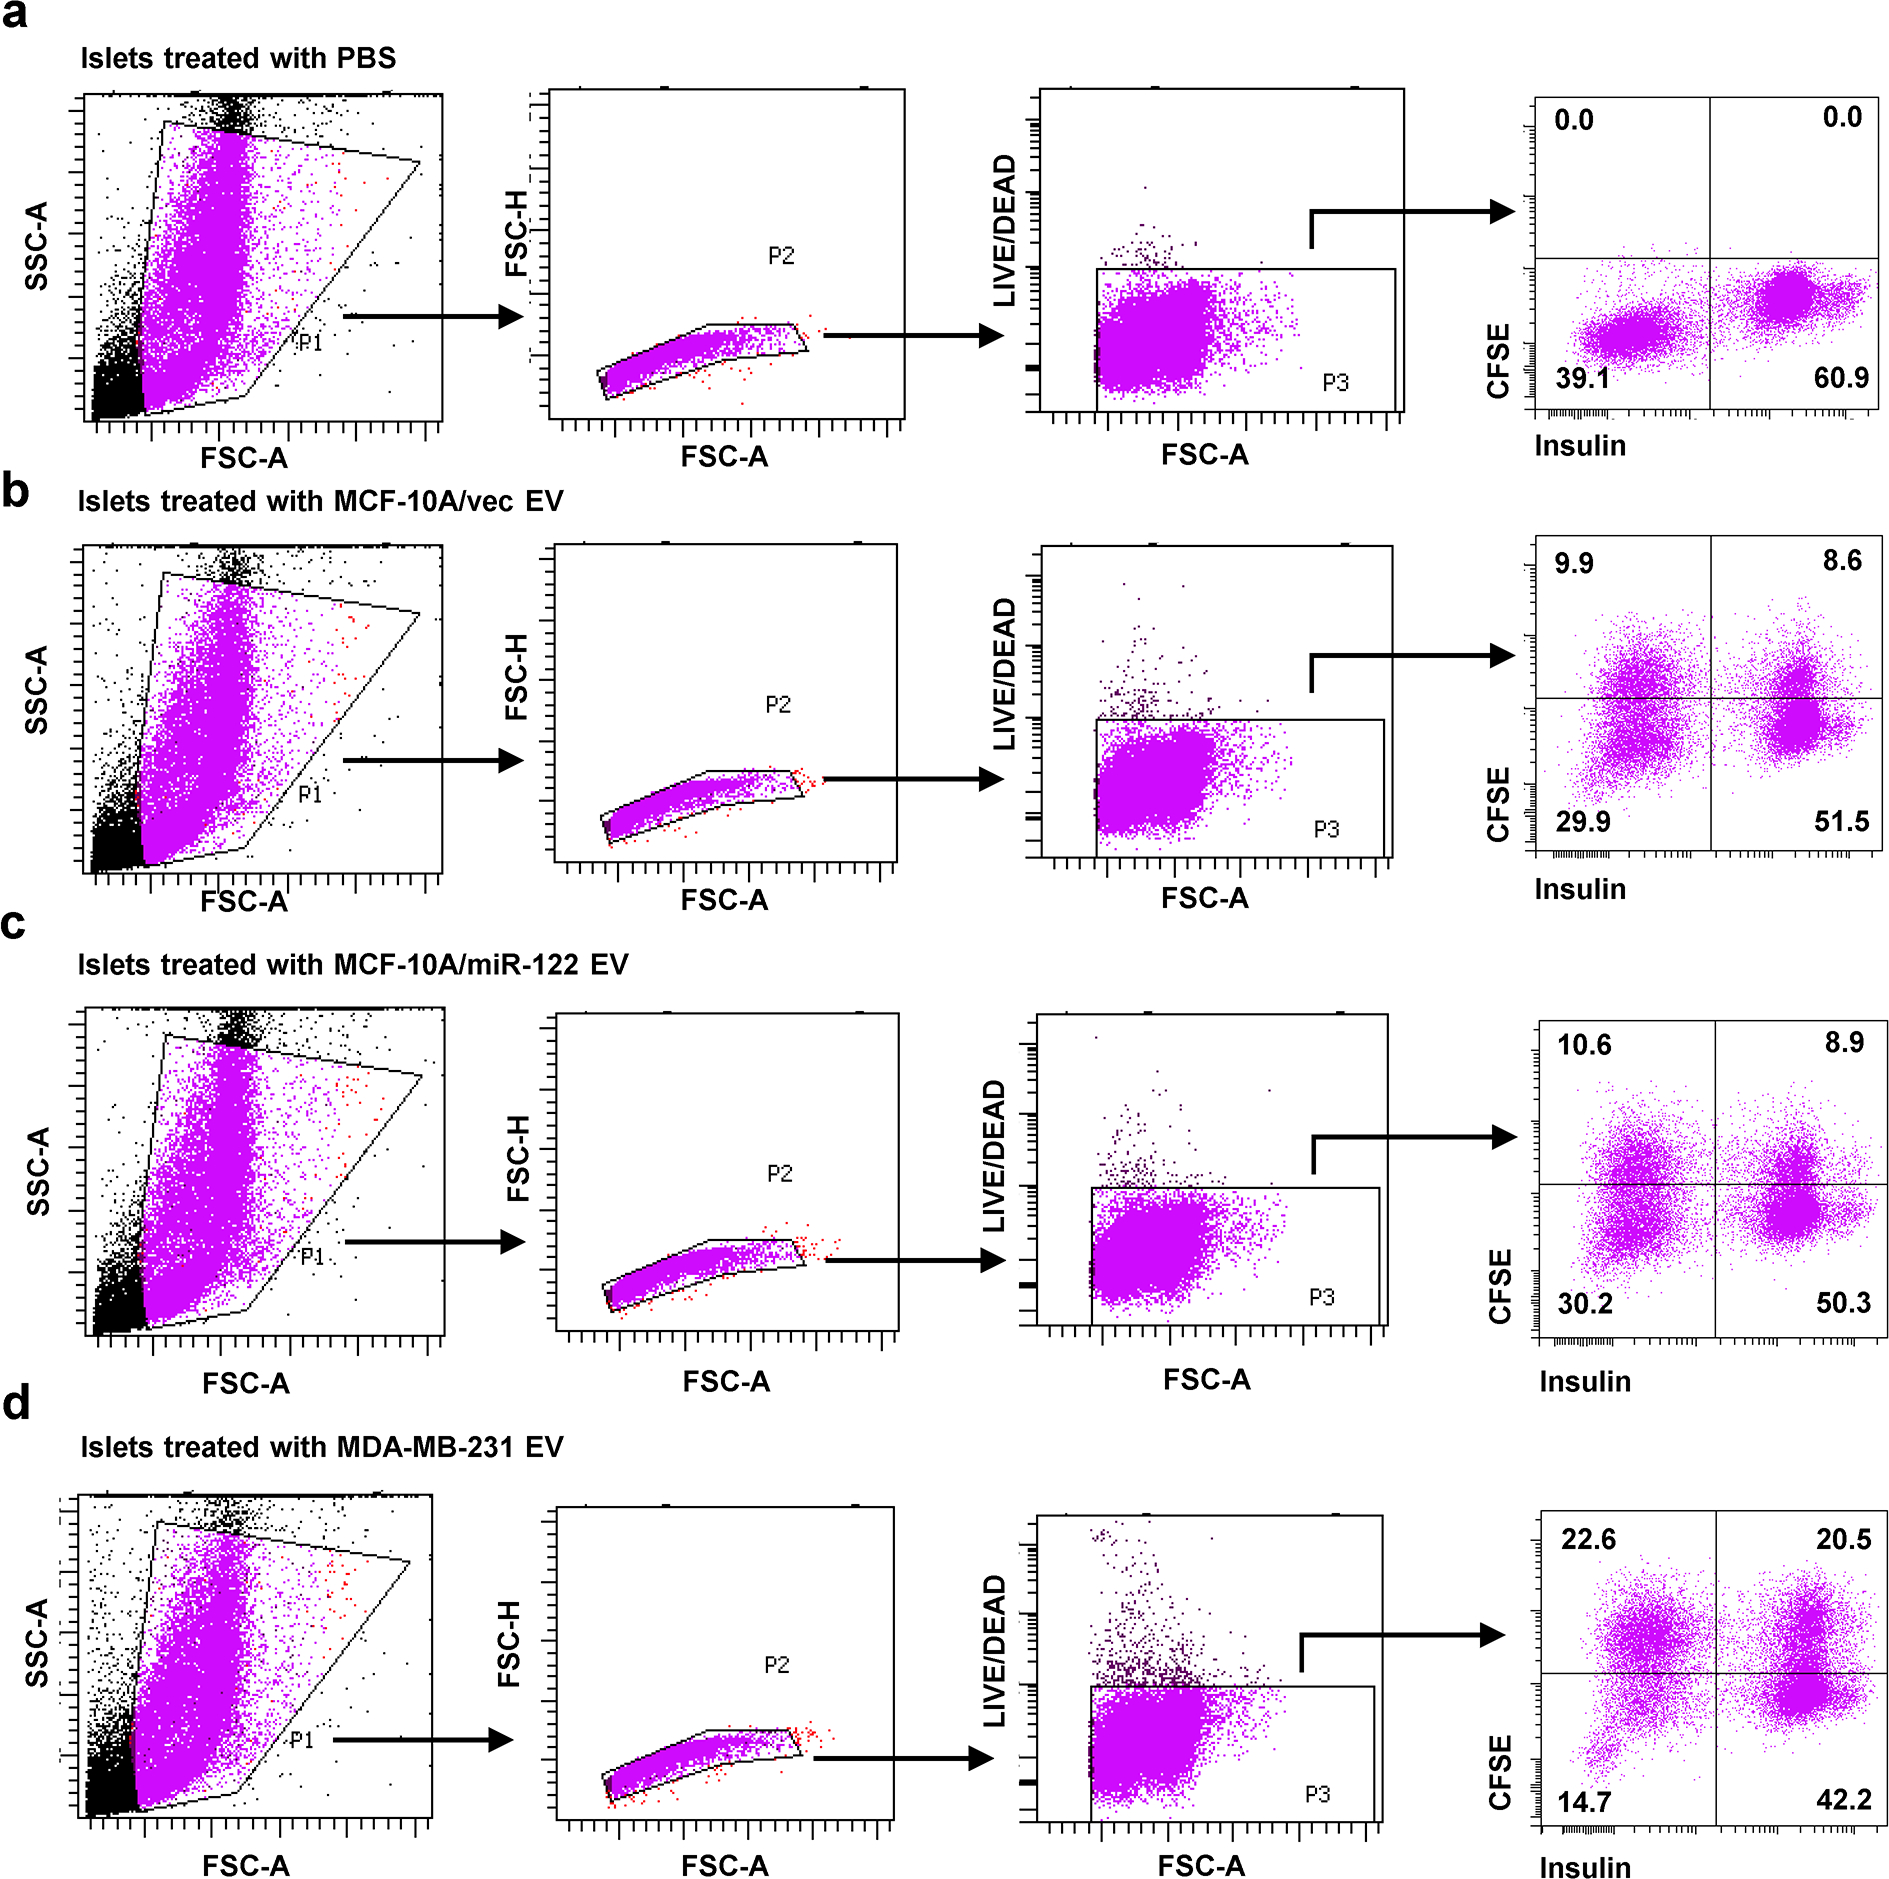
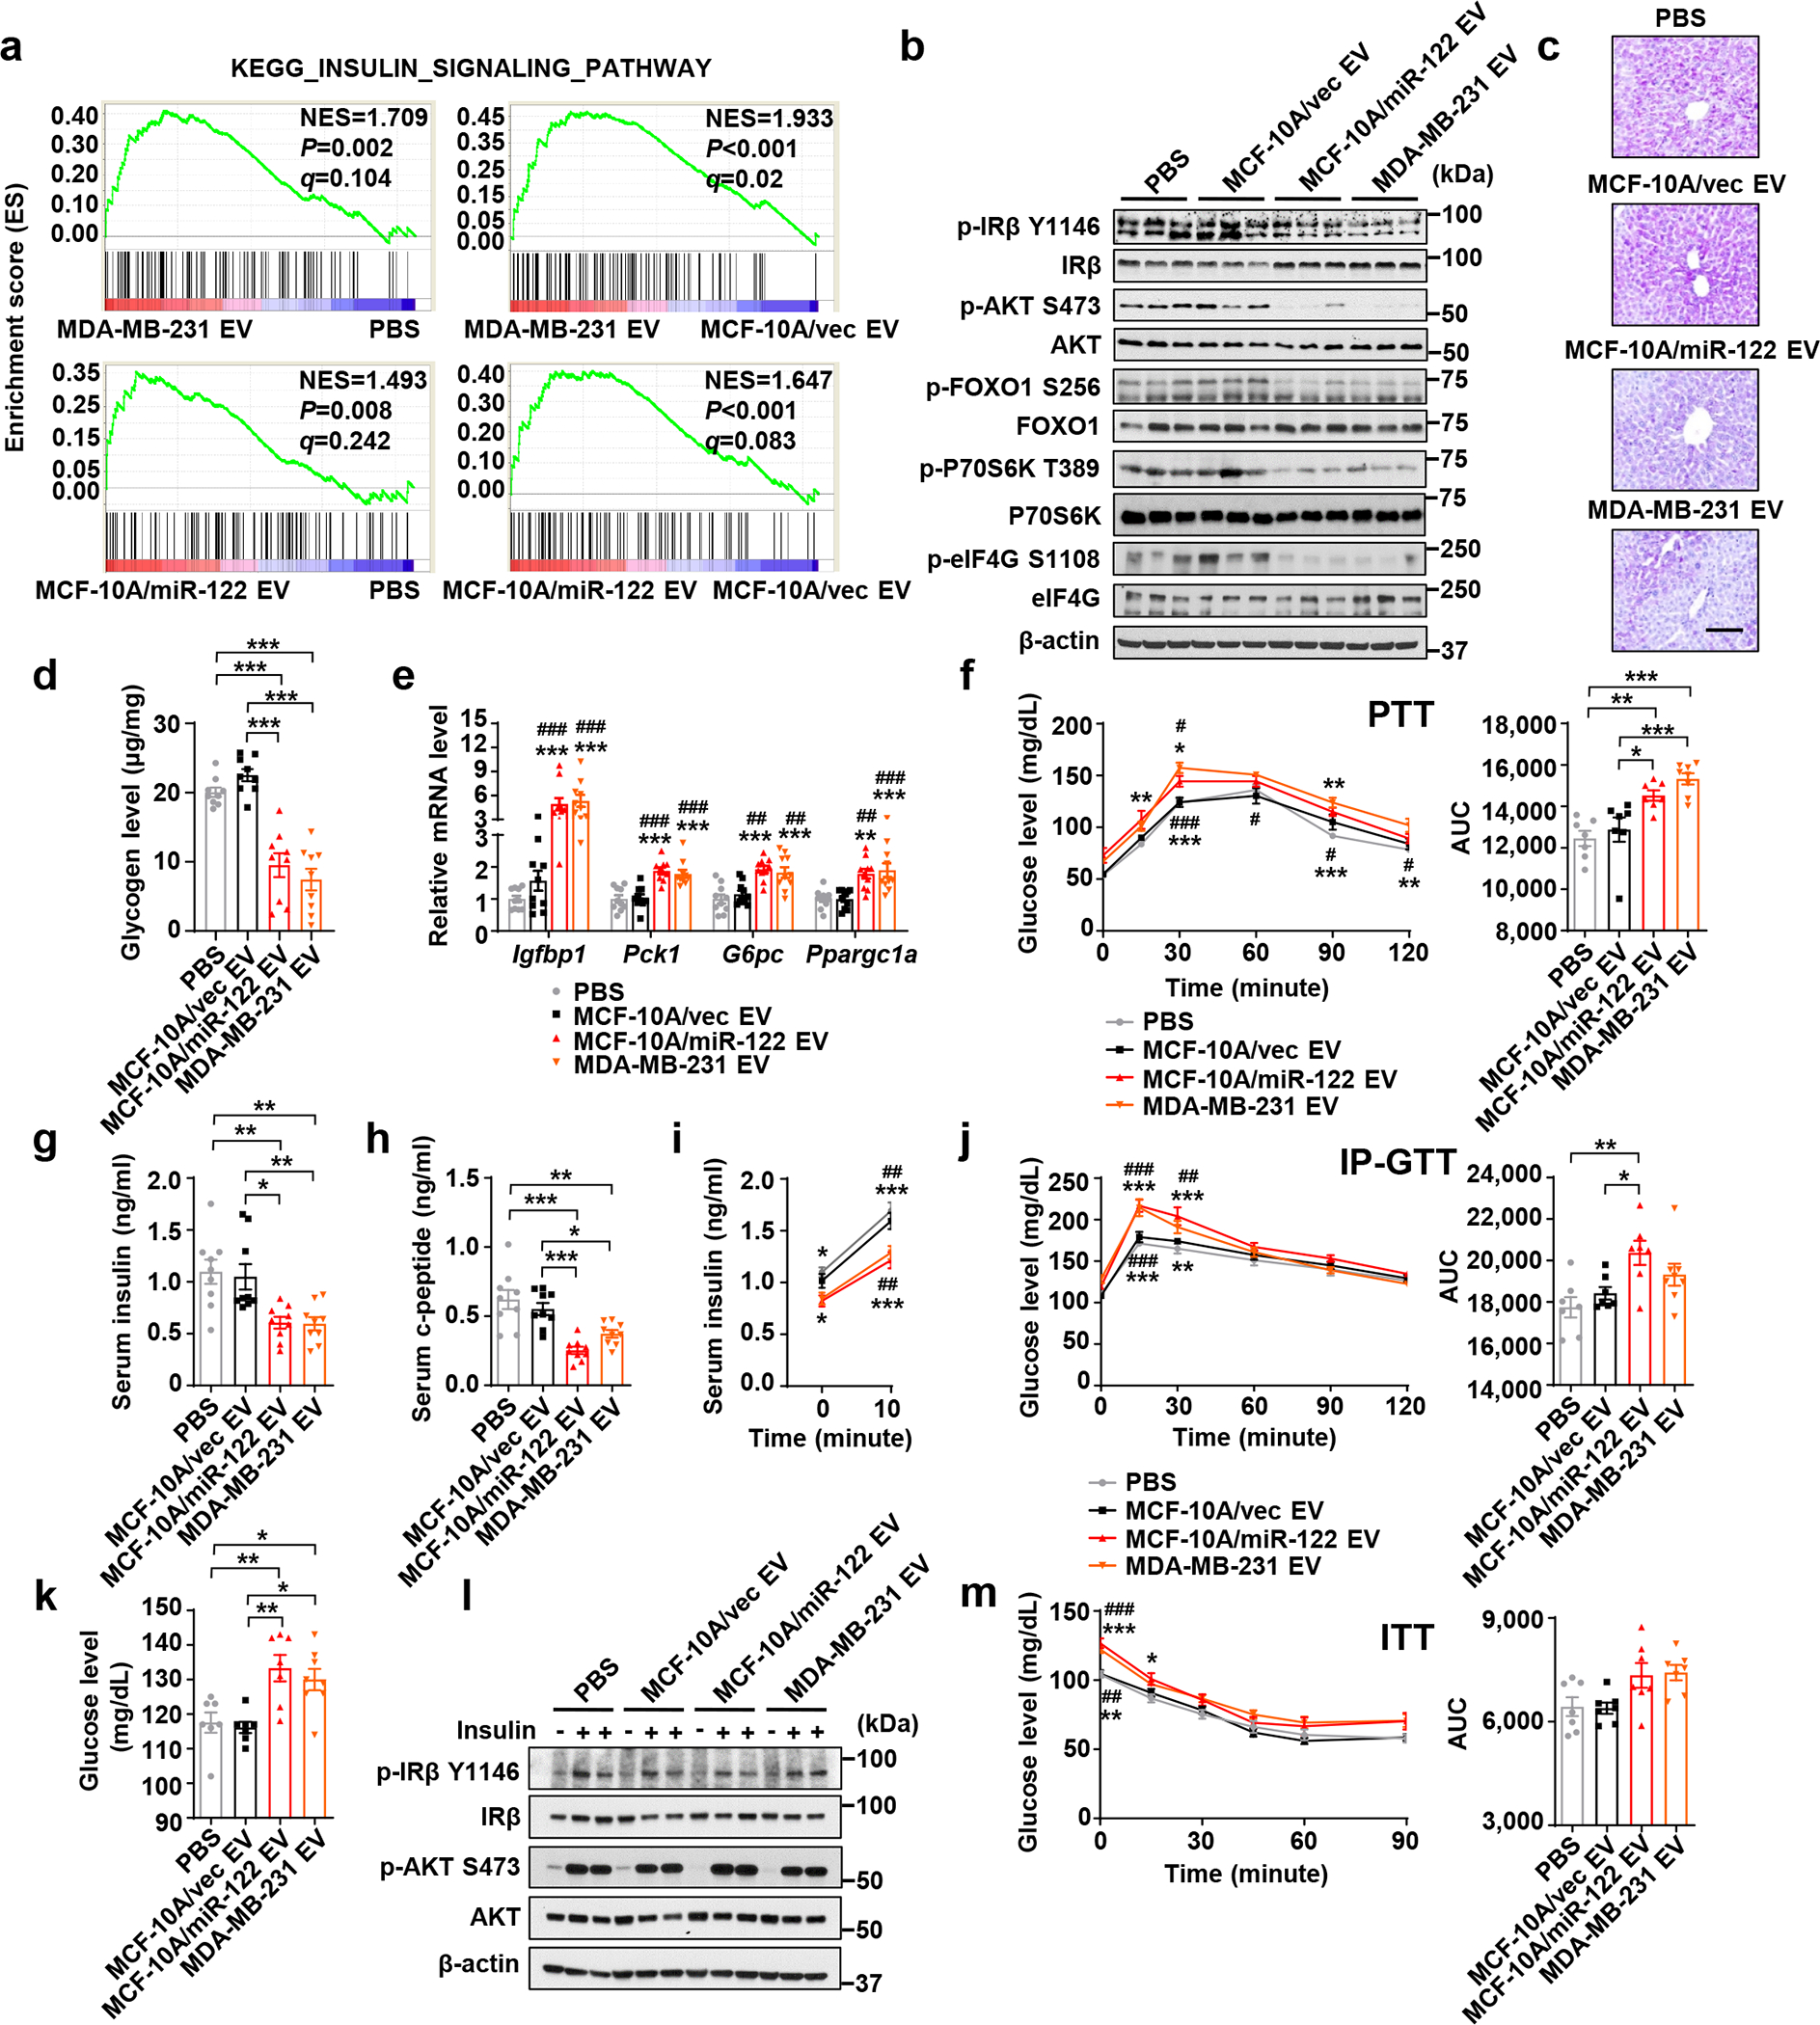
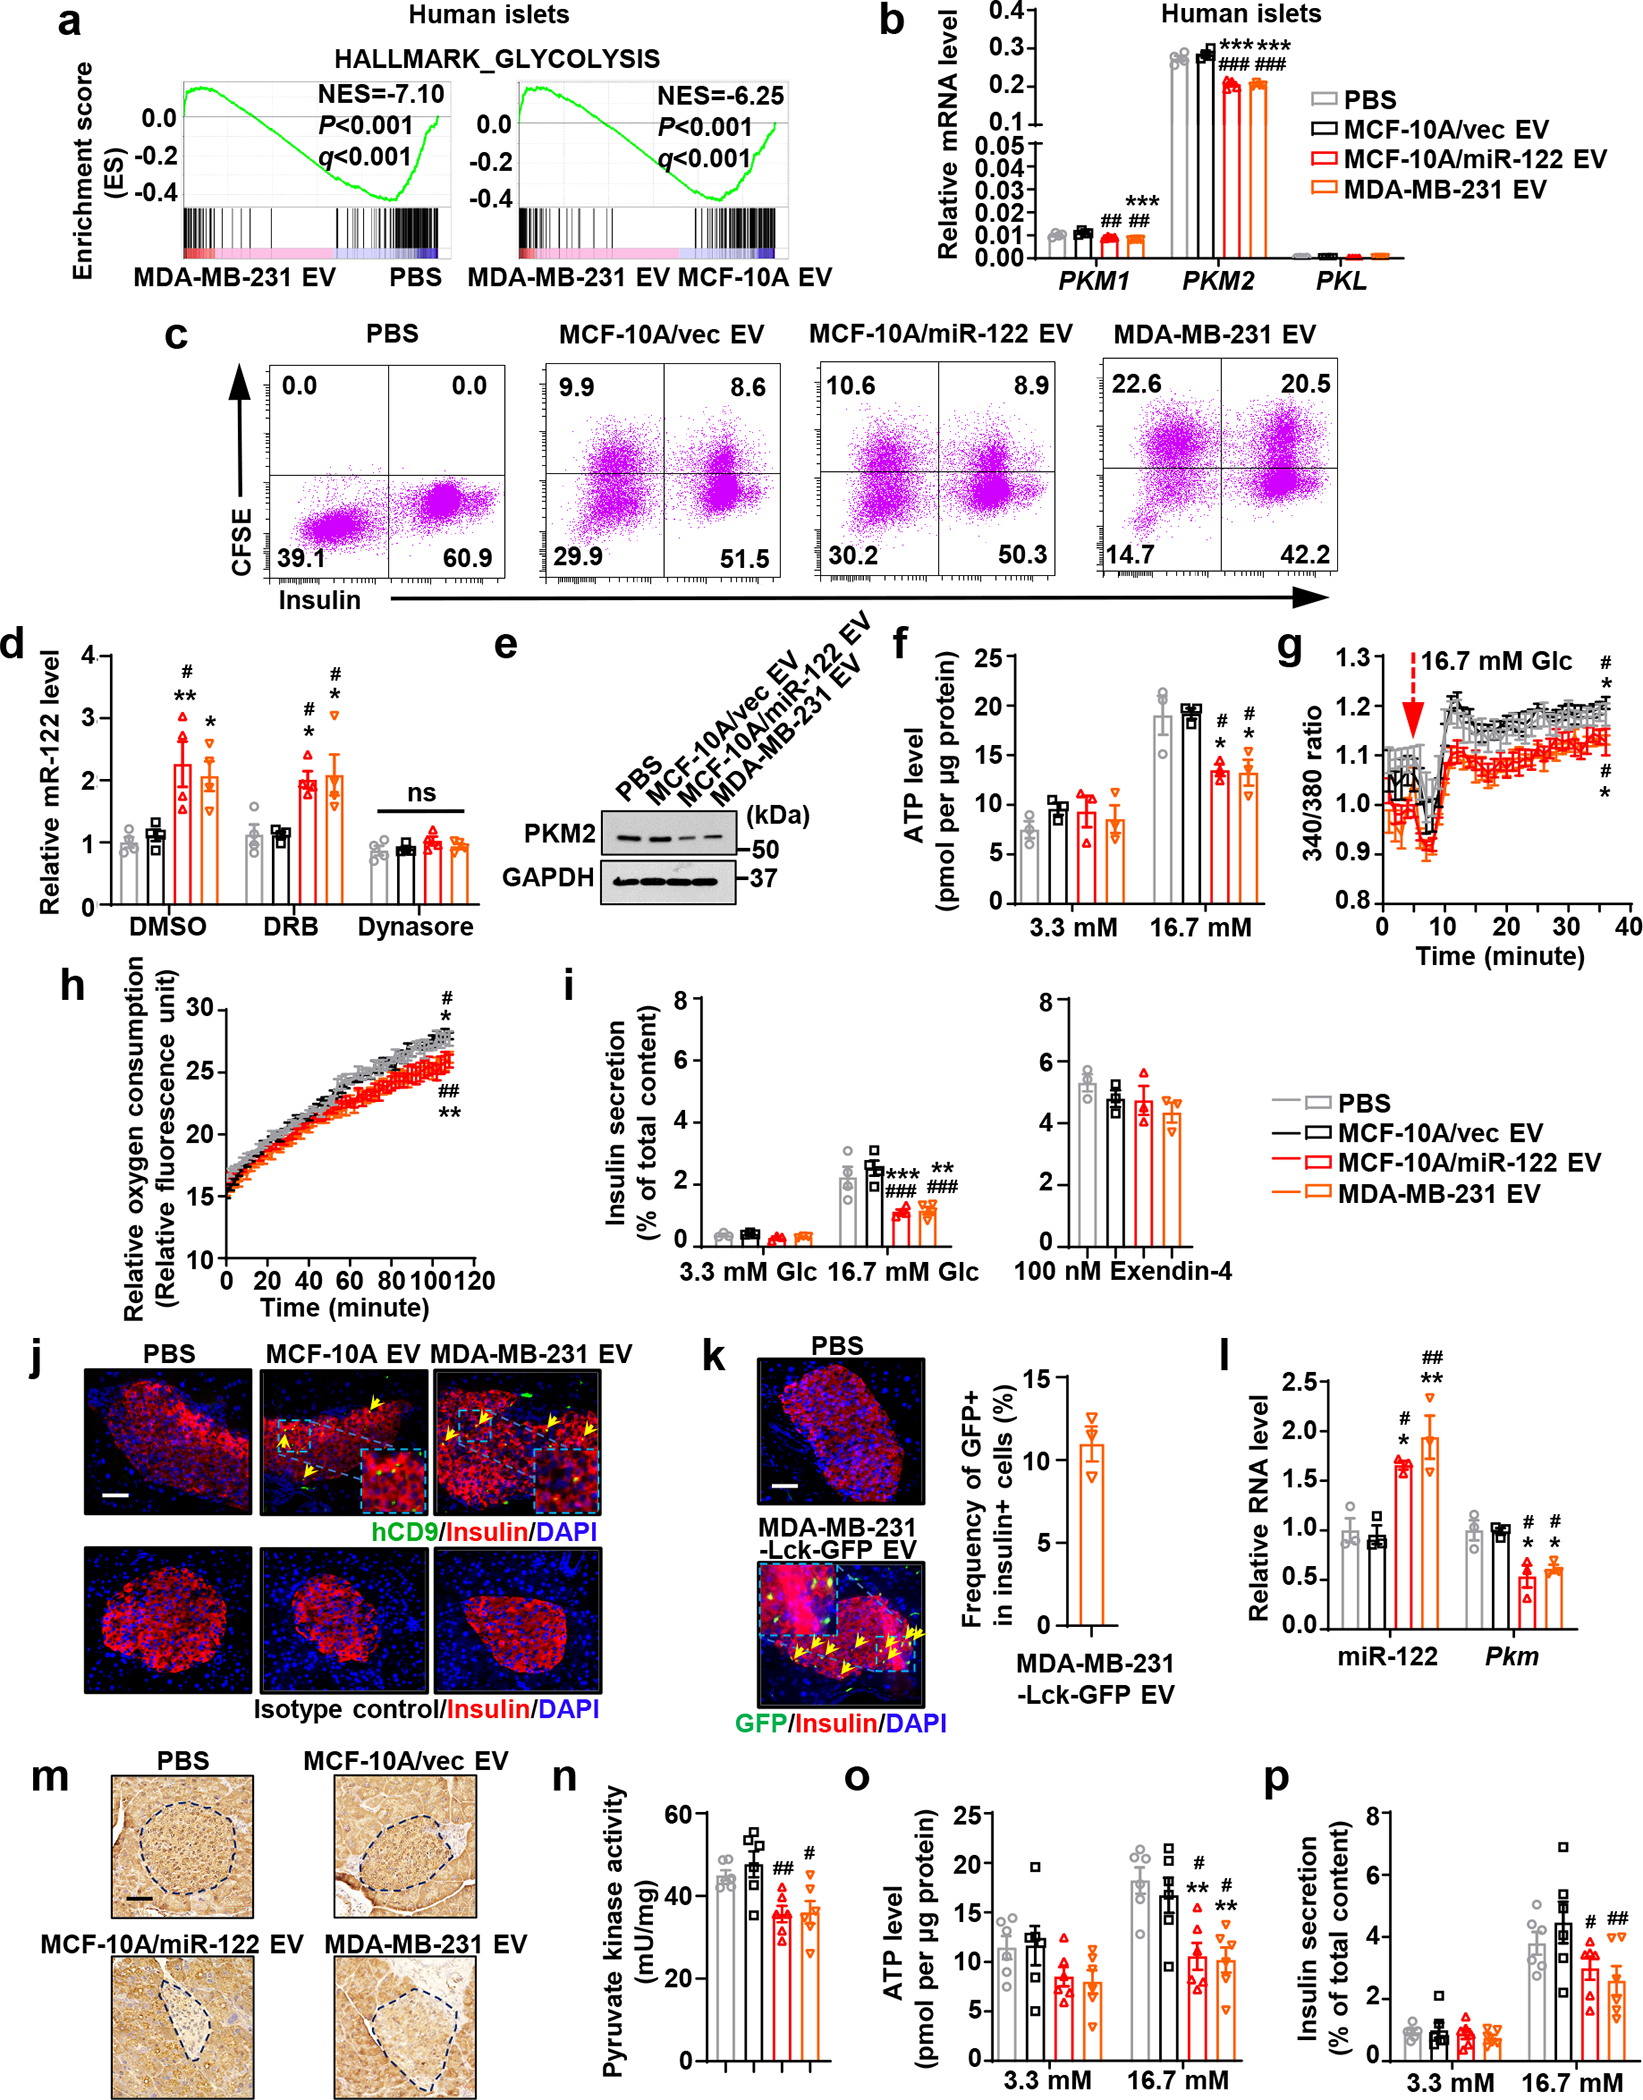
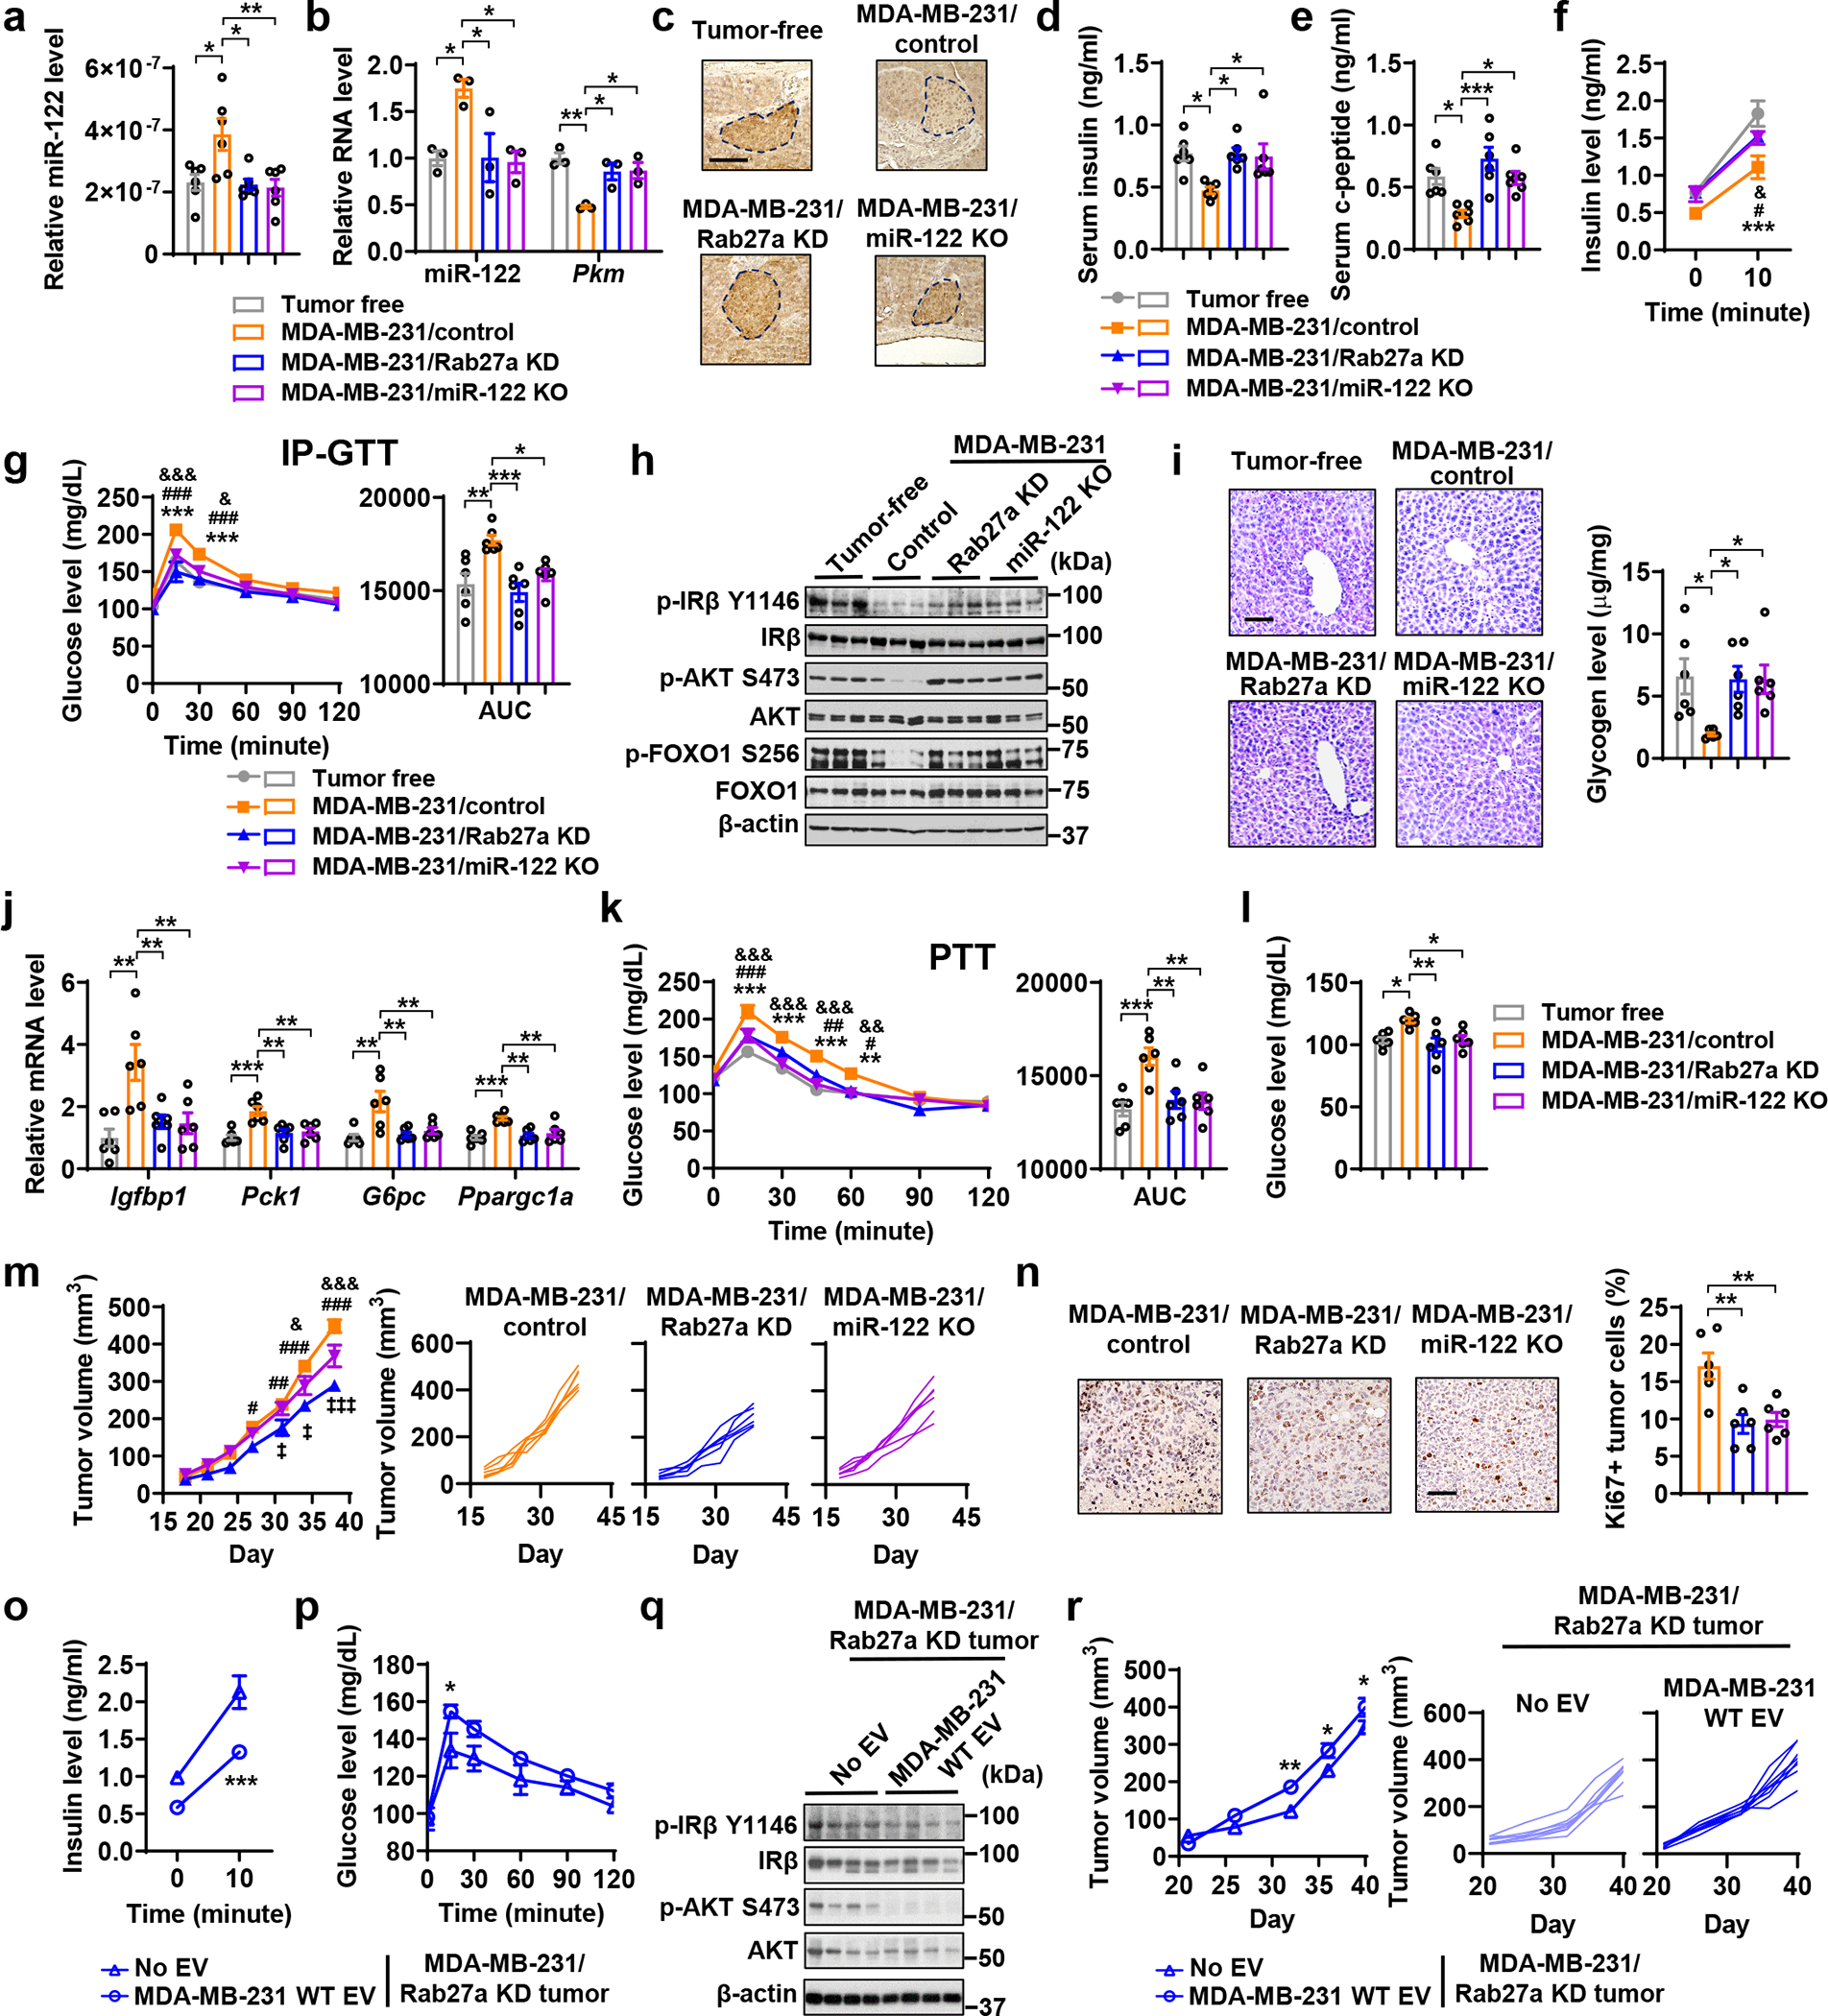
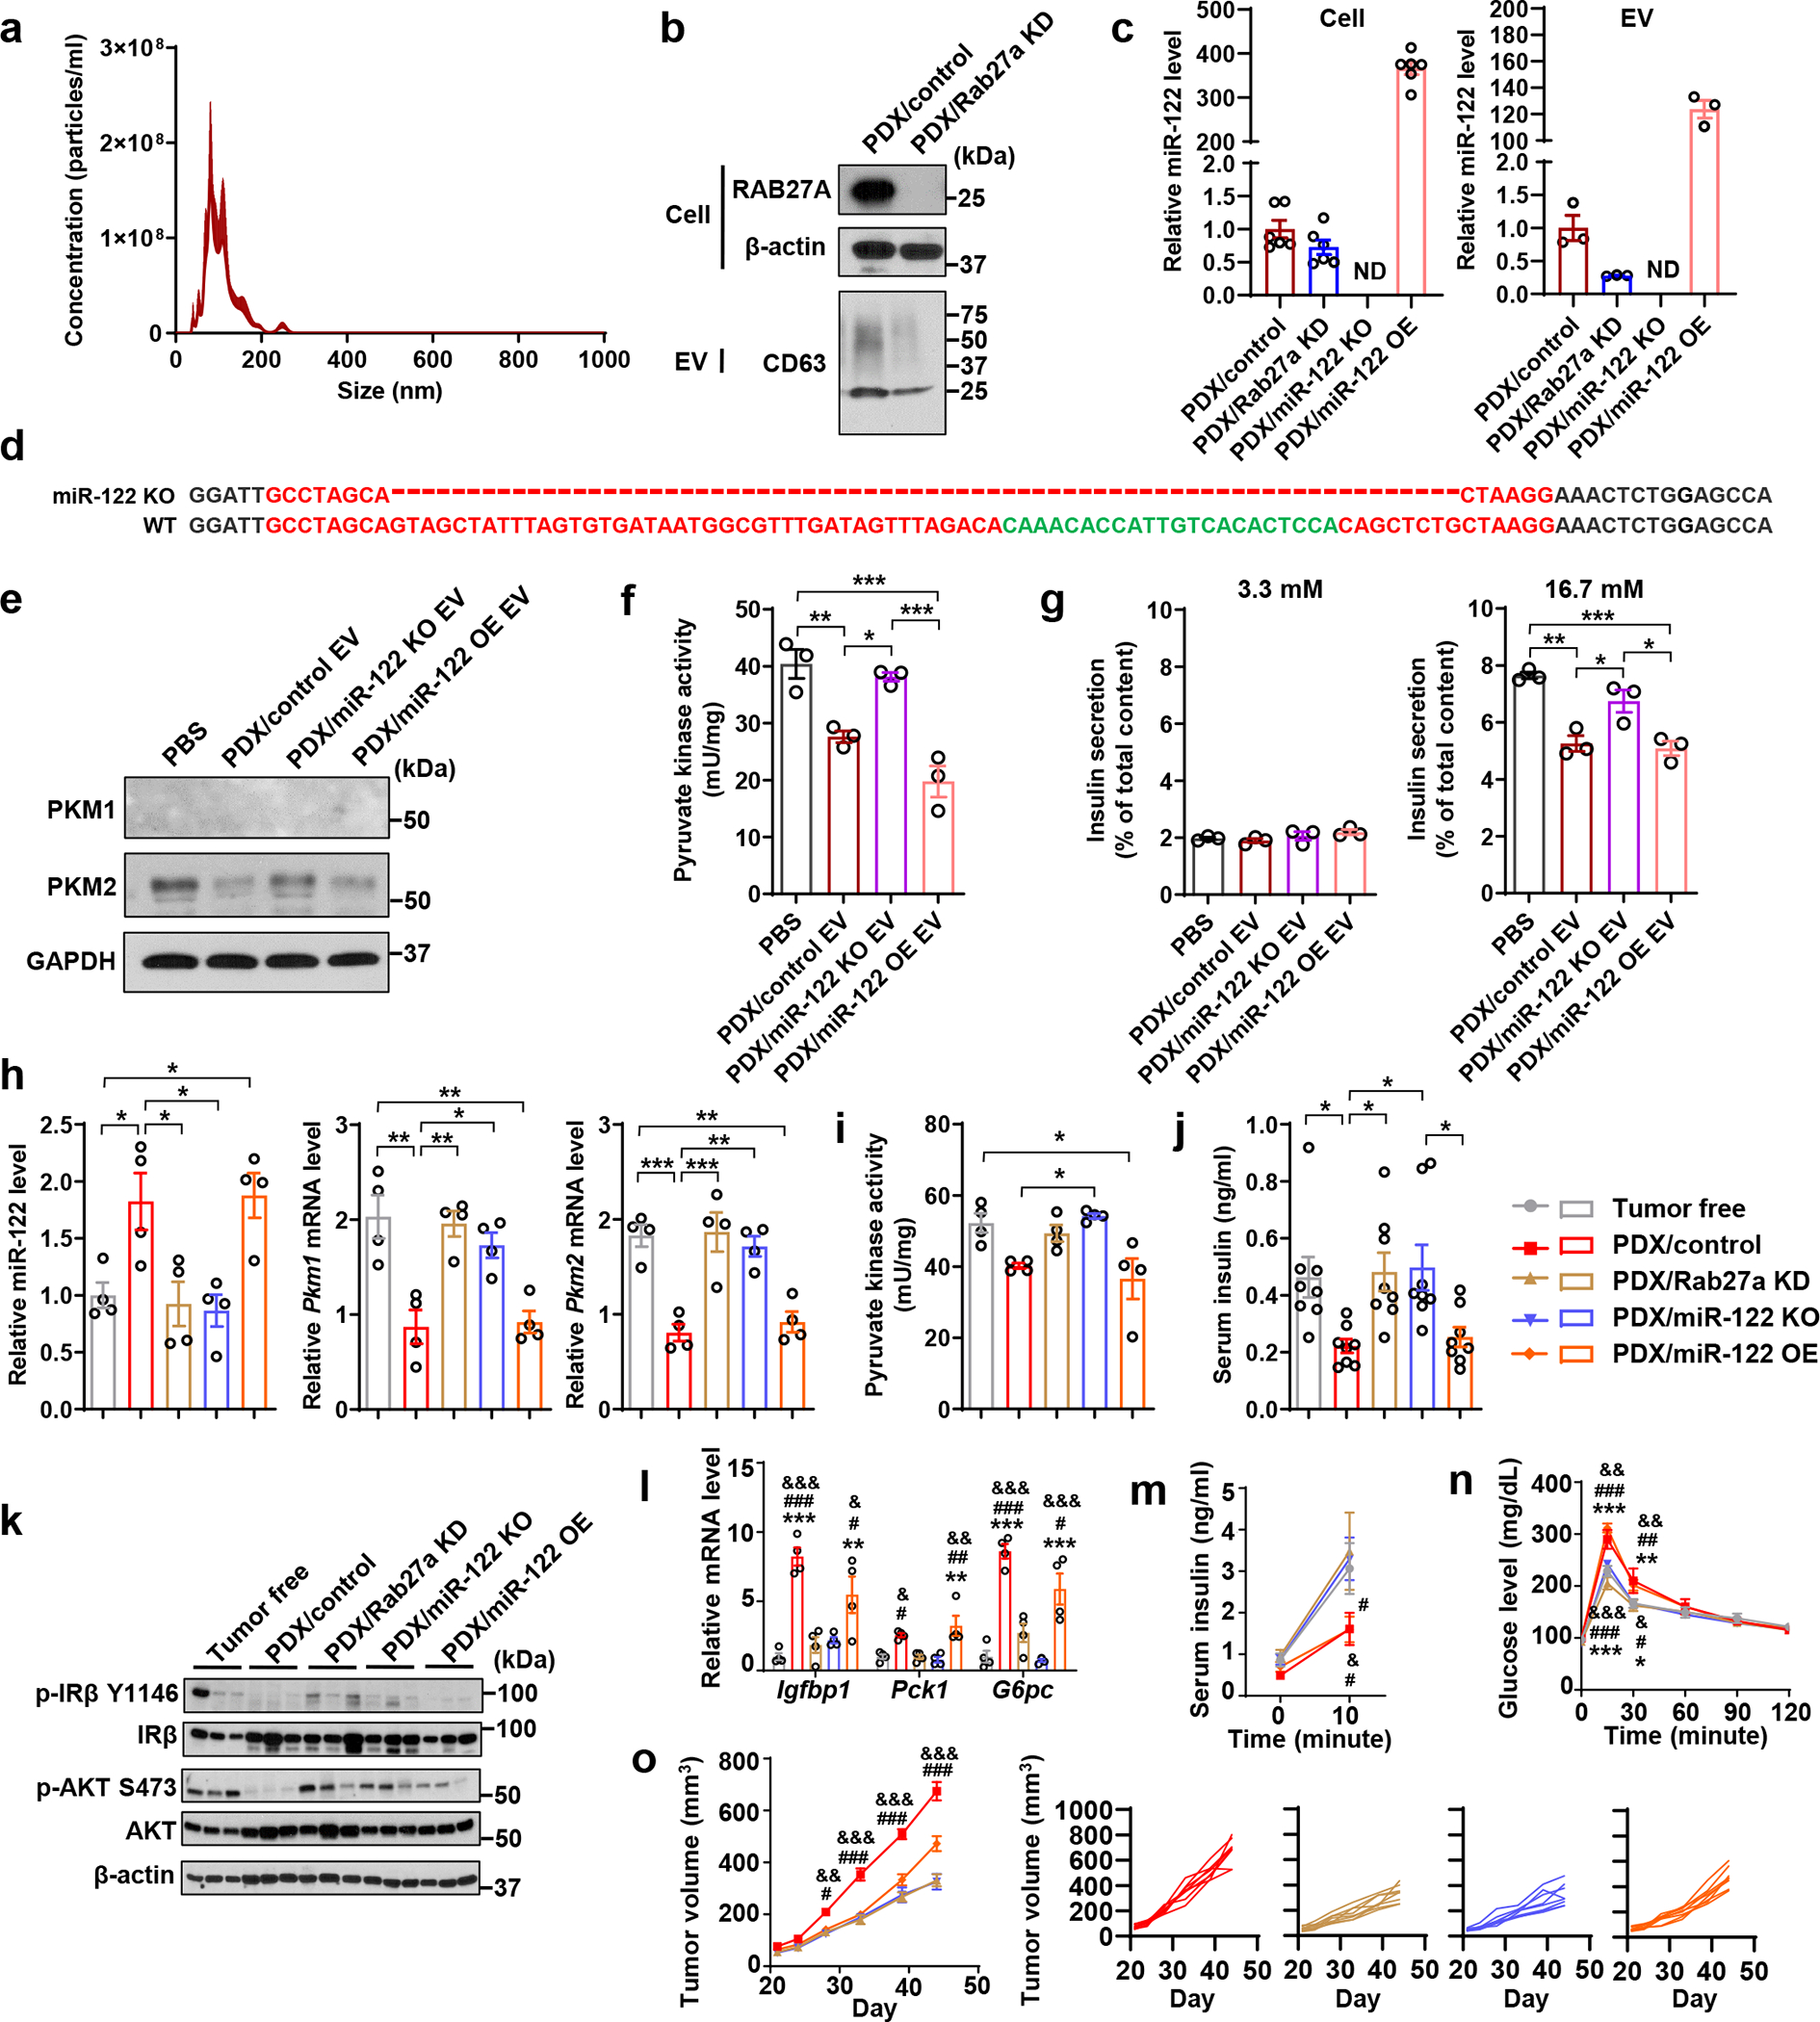
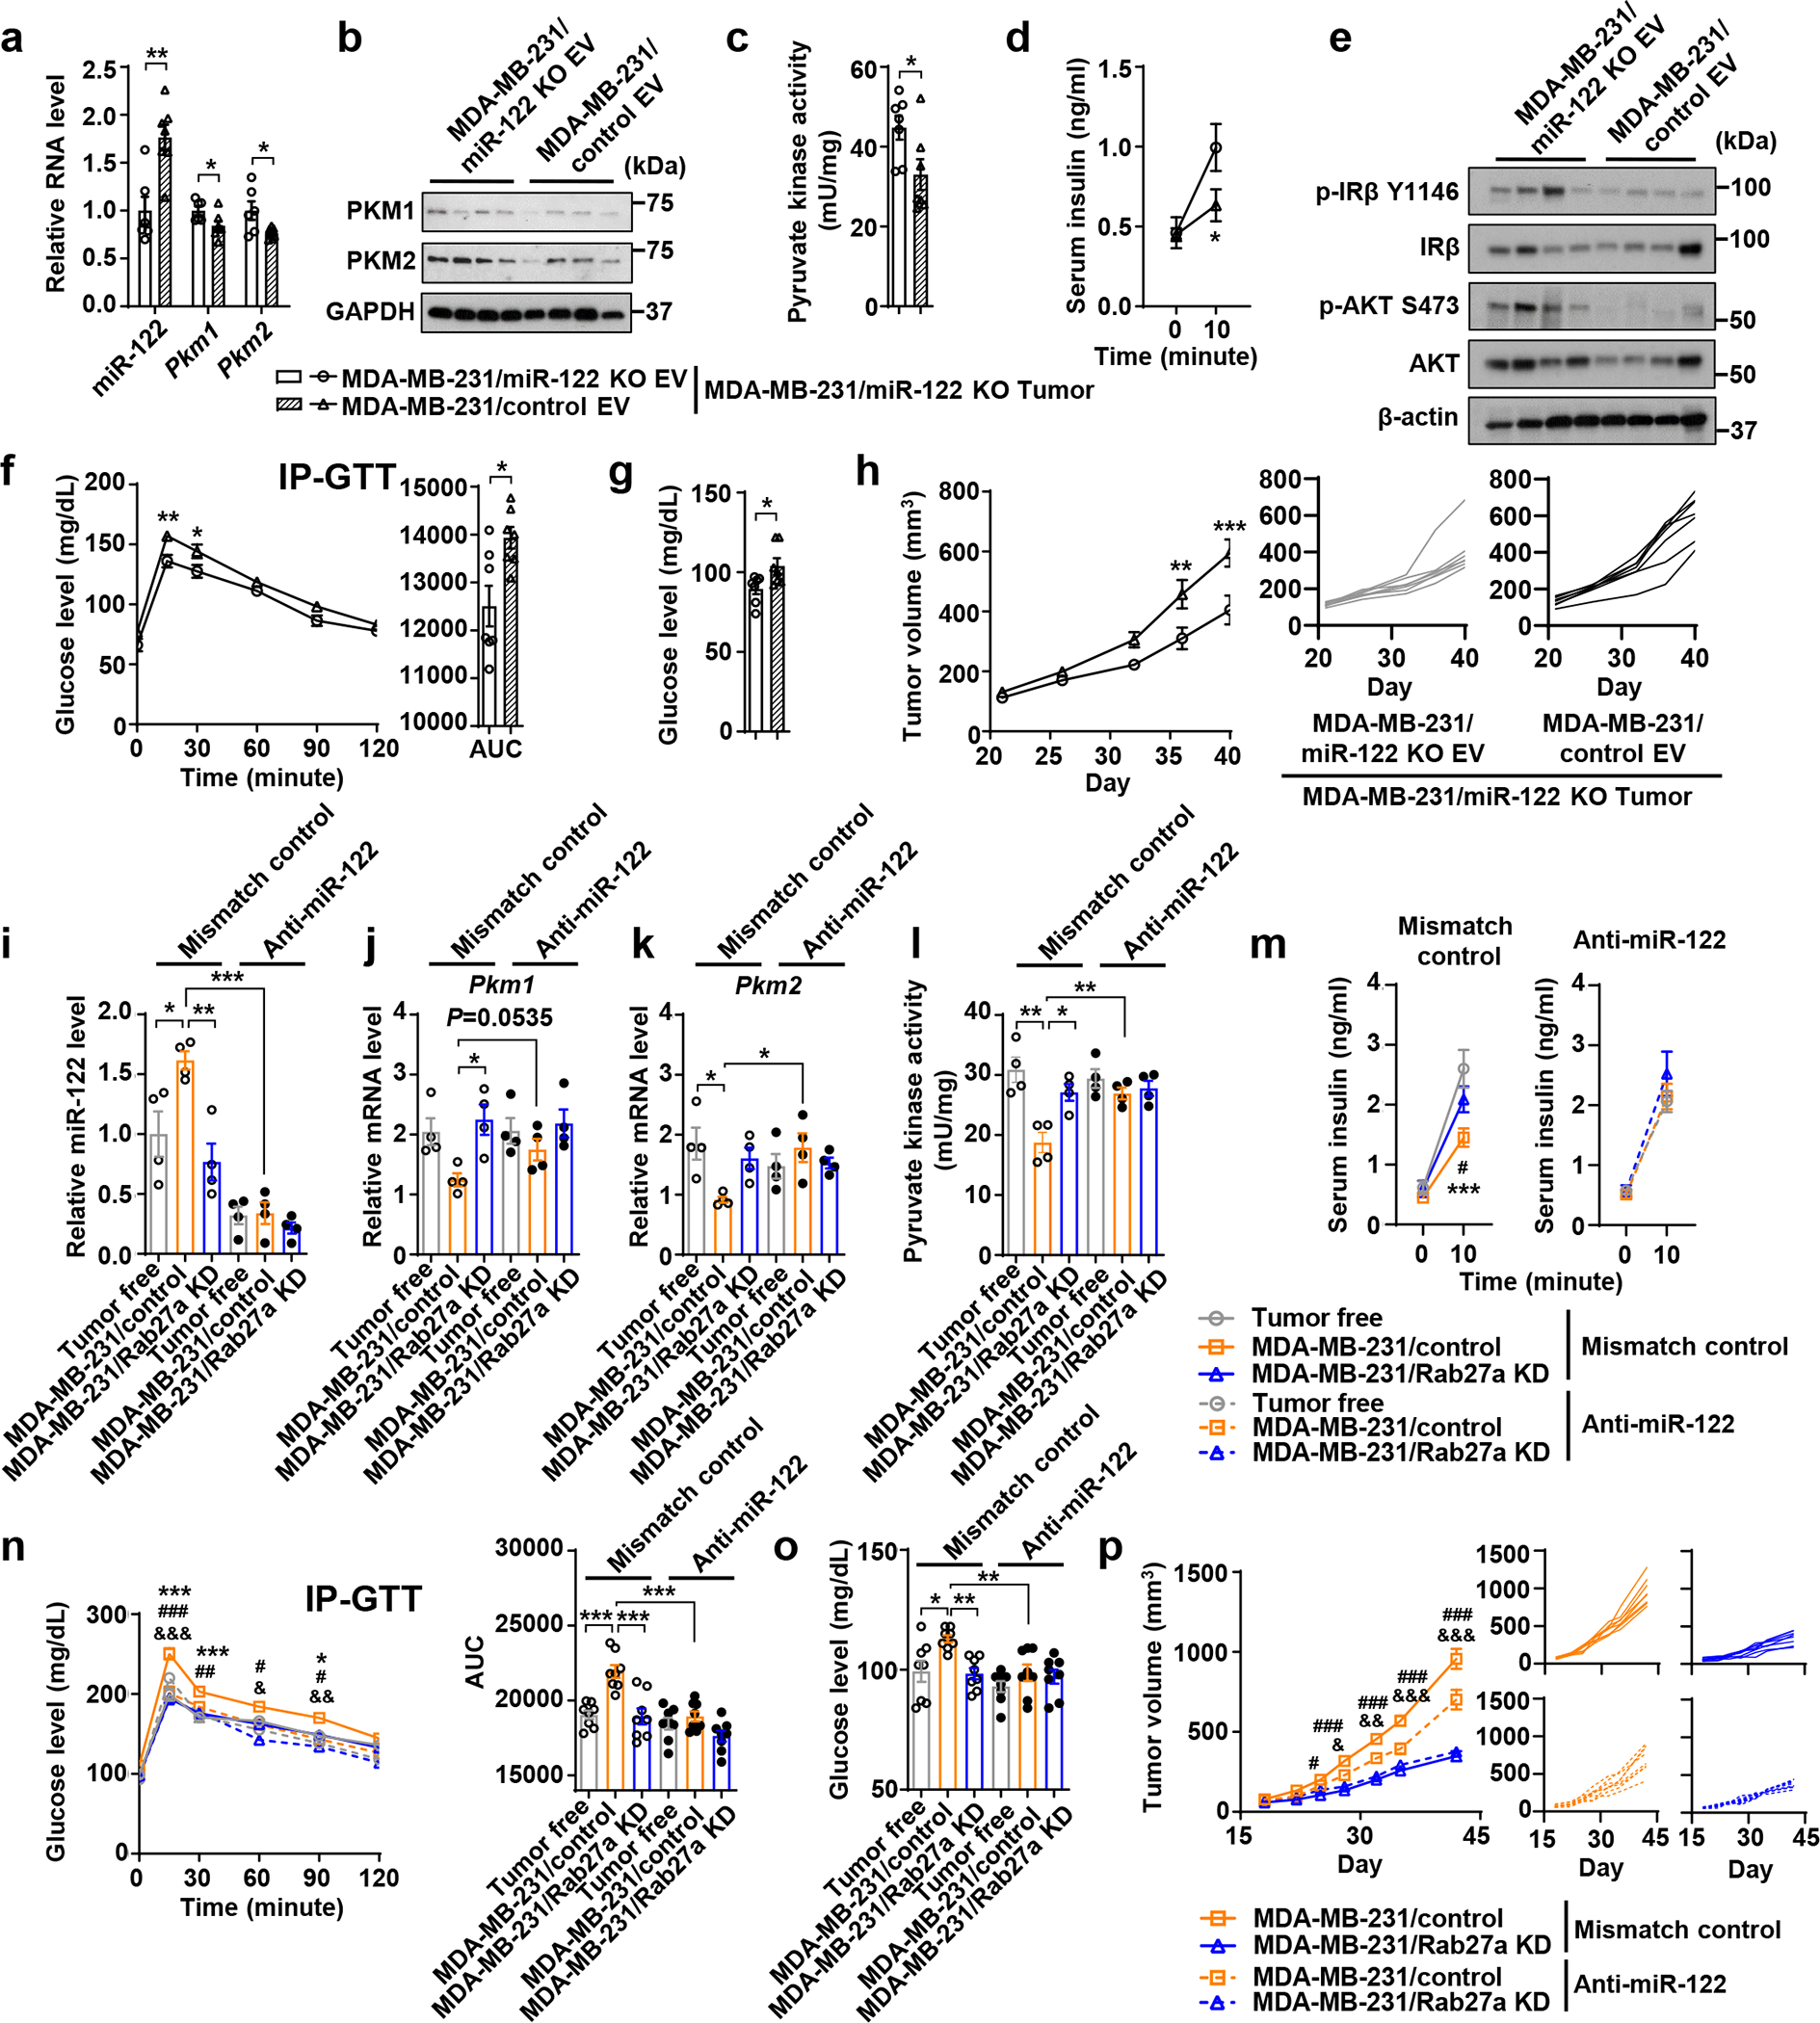
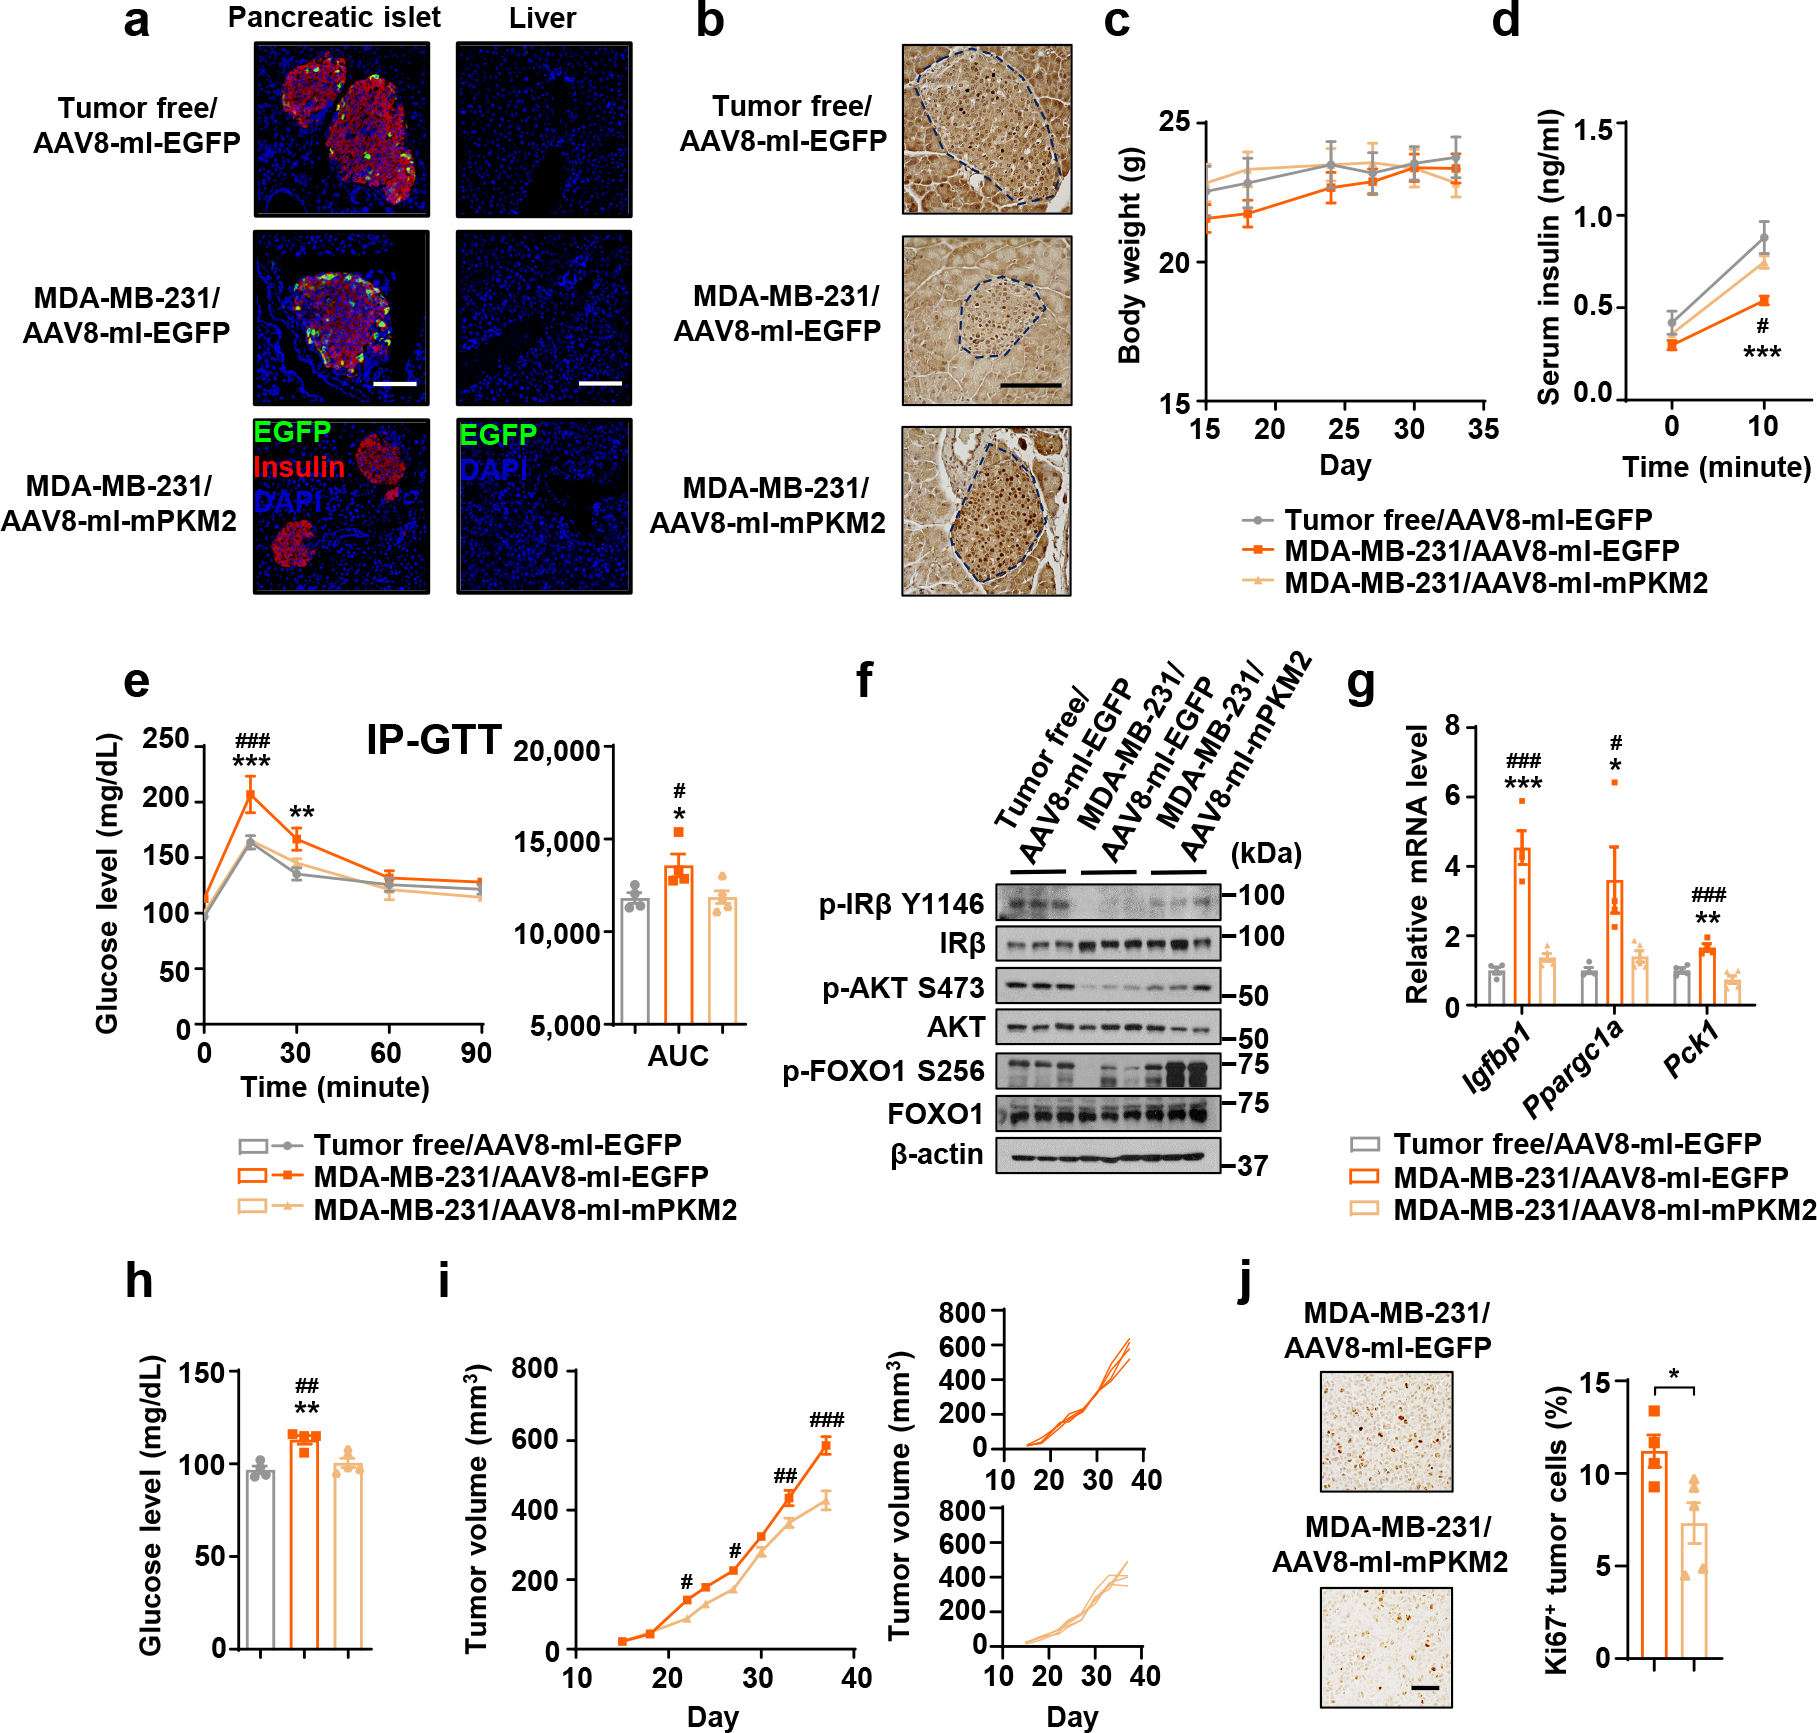
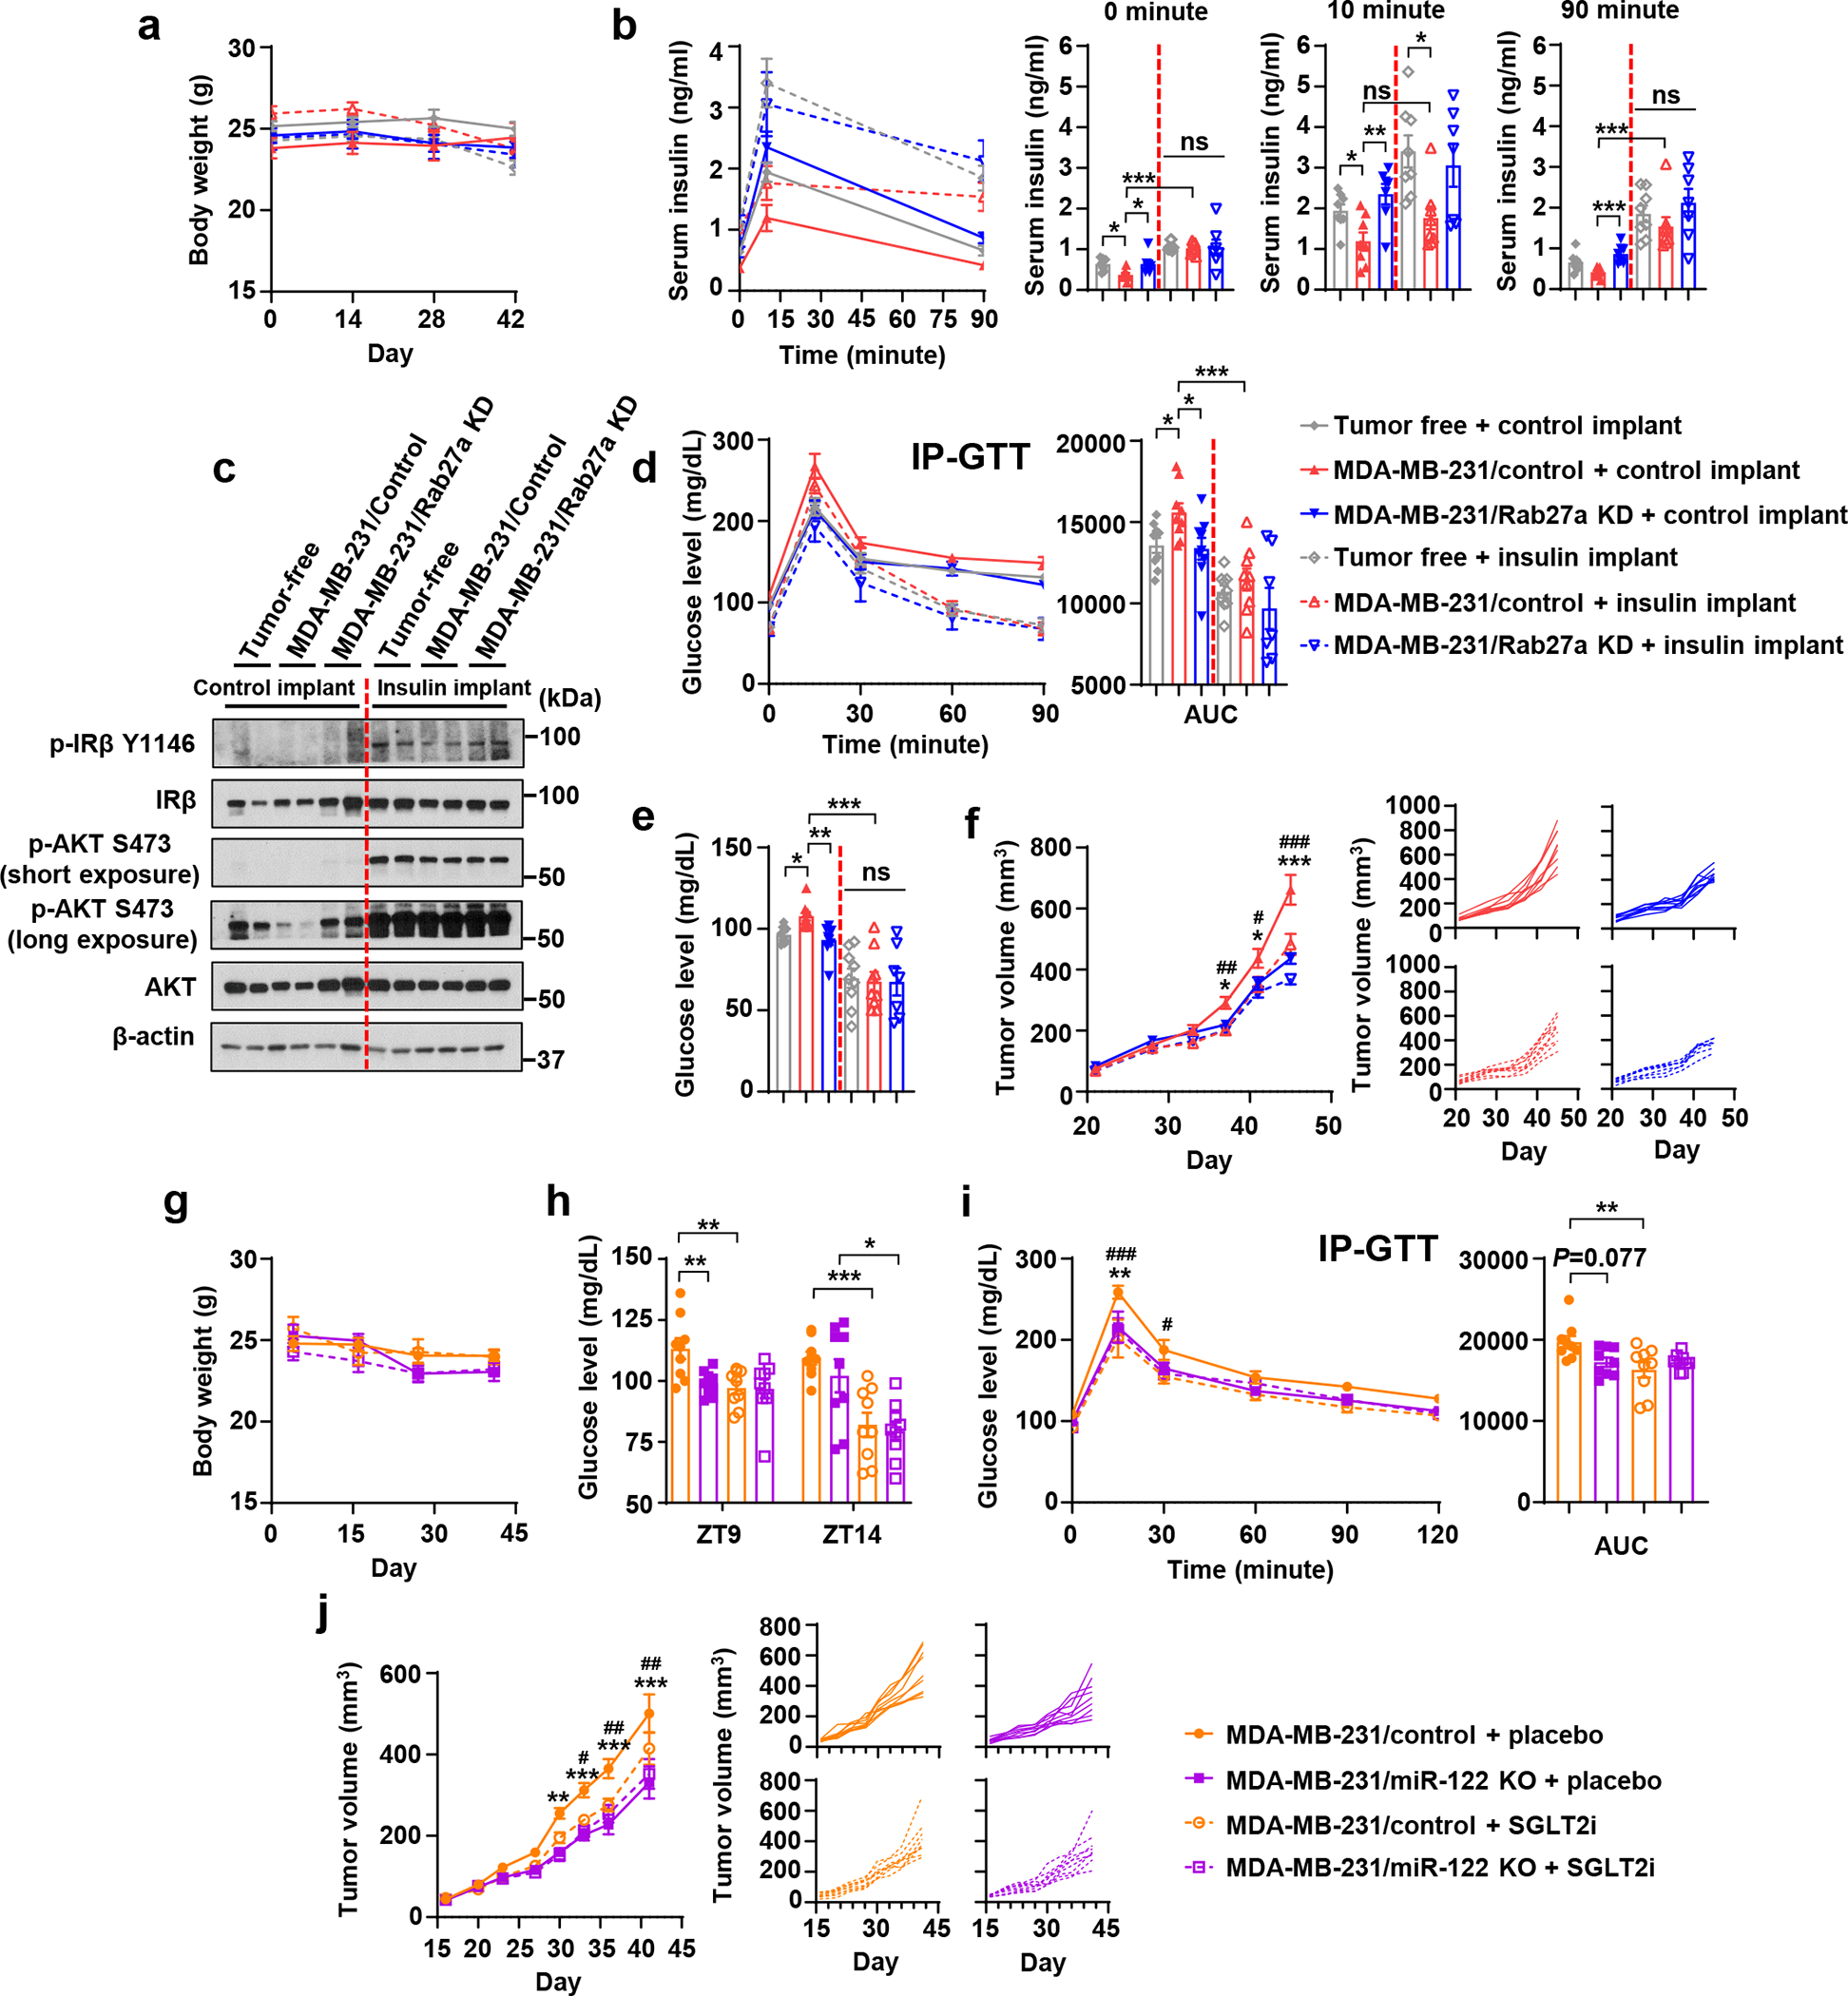
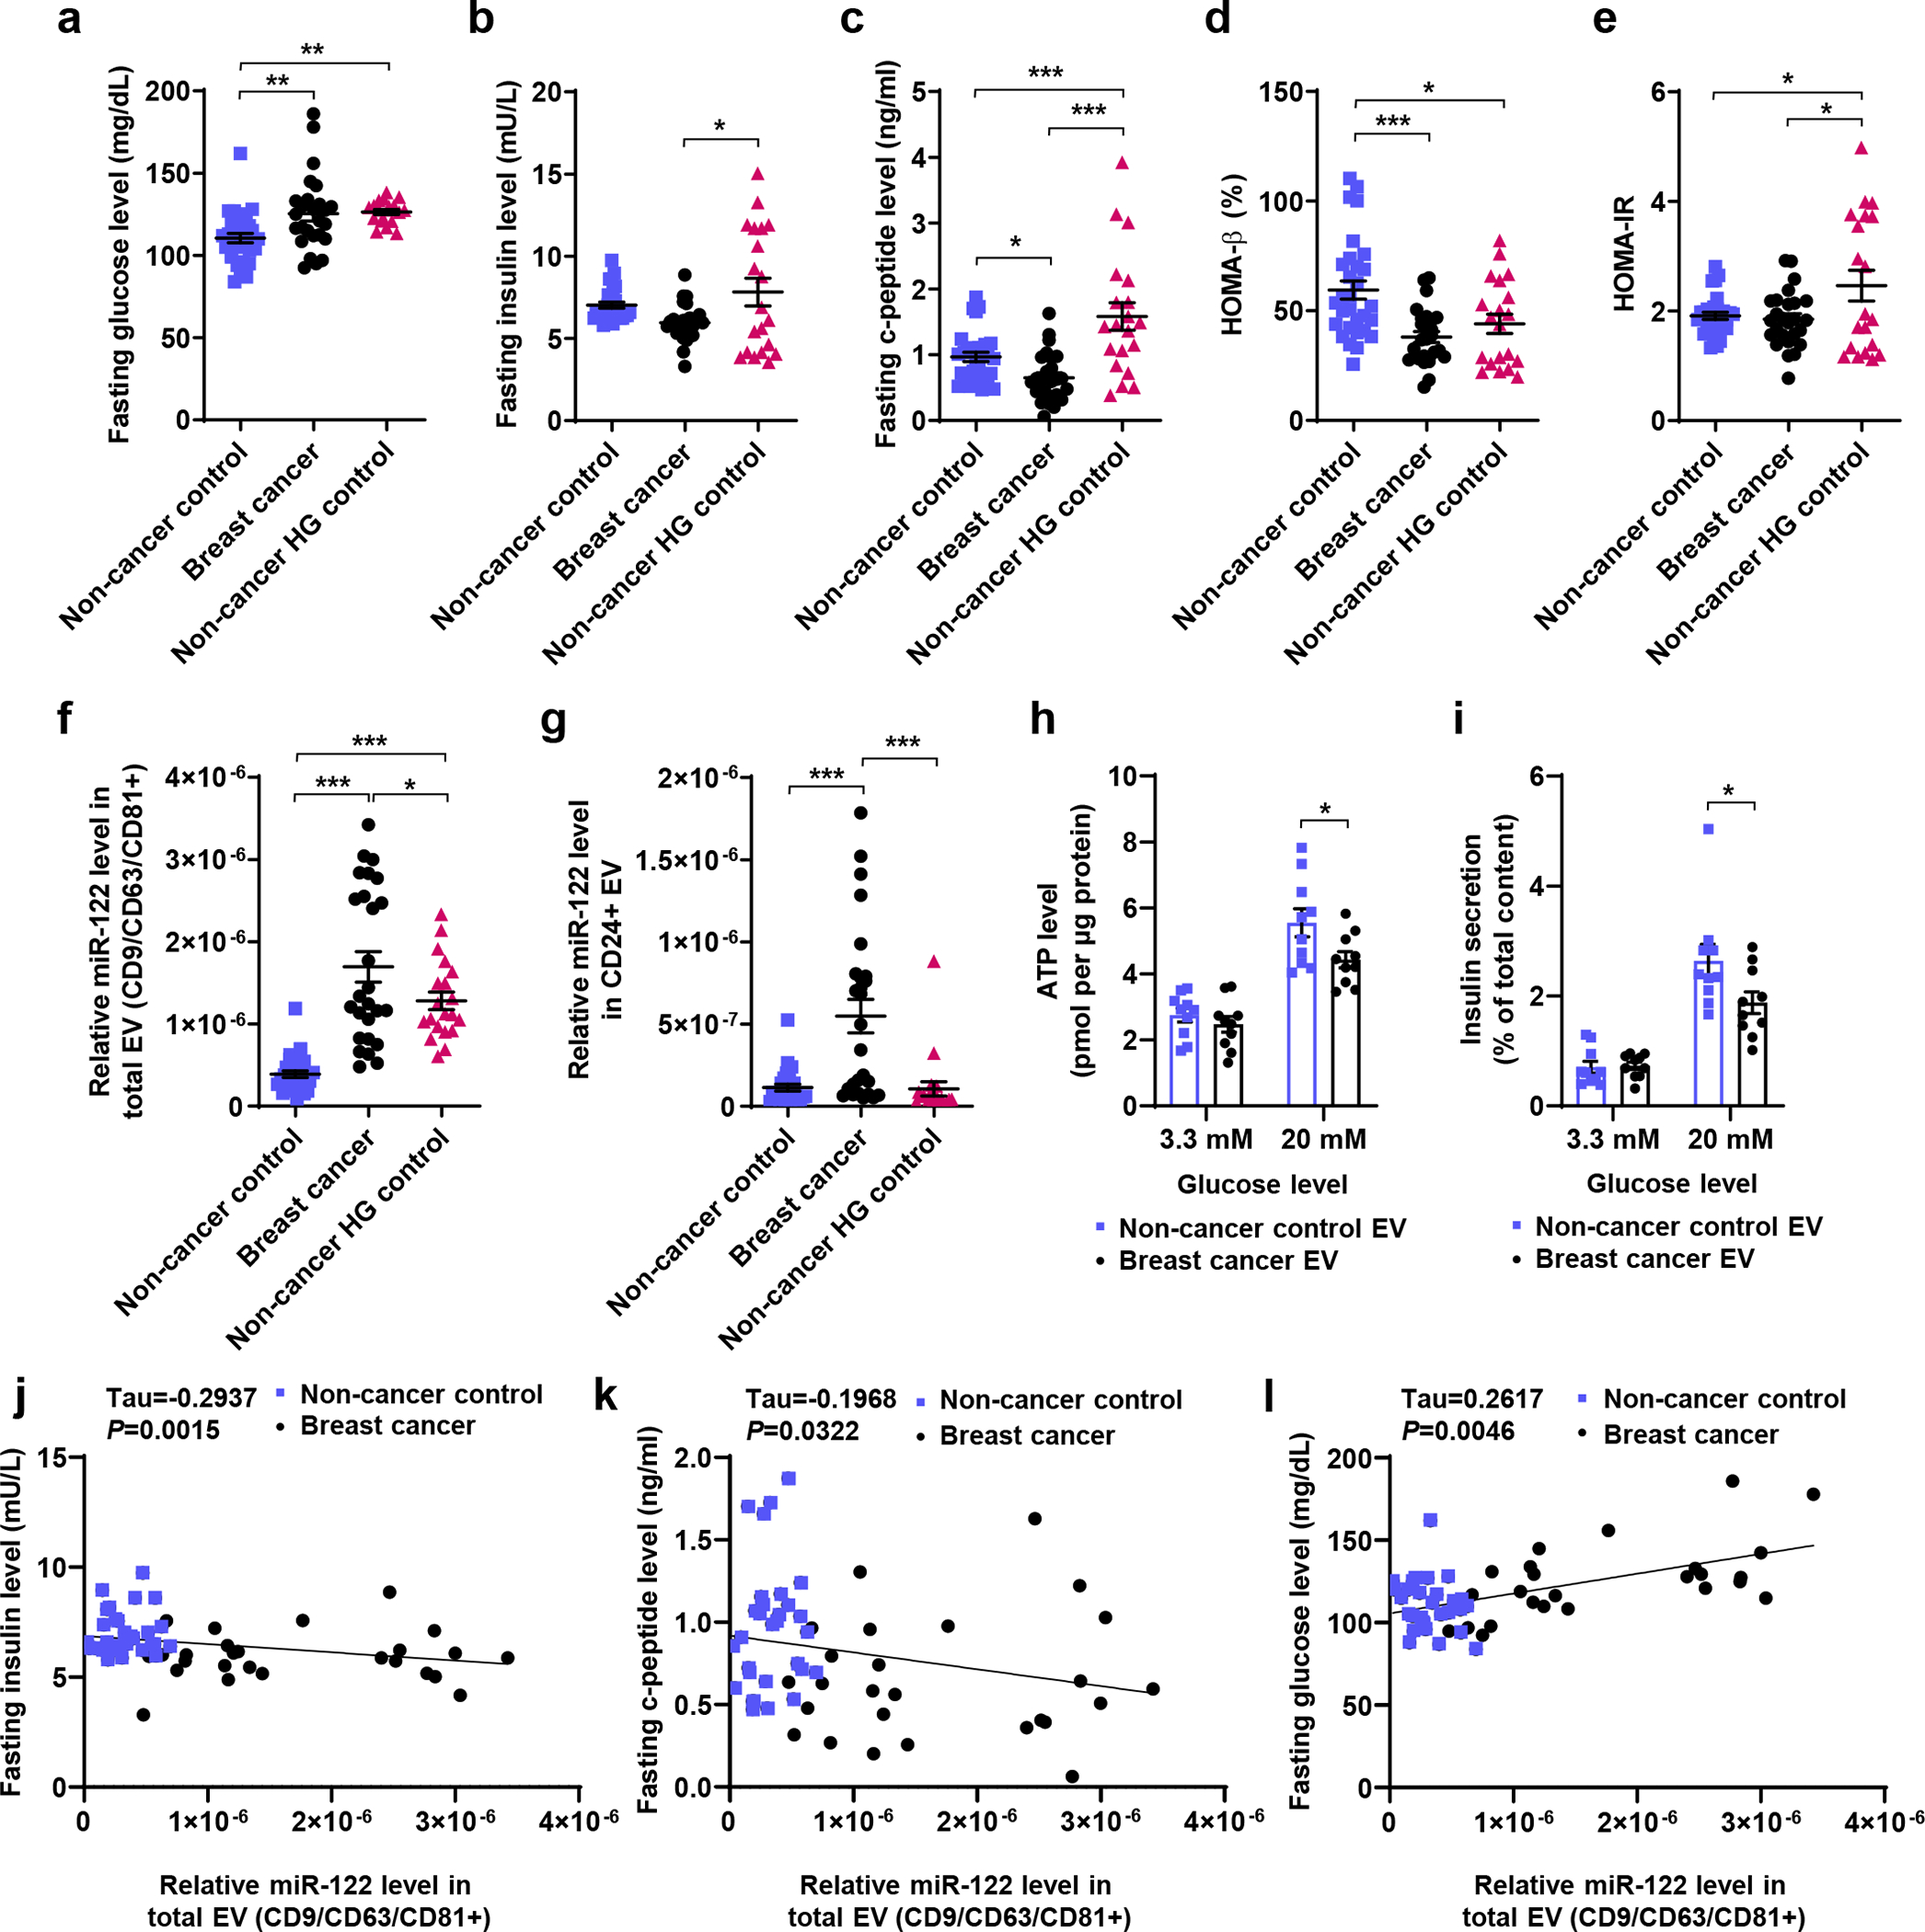
Epidemiological studies demonstrate an association between breast cancer (BC) and systemic dysregulation of glucose metabolism. However, how BC influences glucose homeostasis remains unknown. We show that BC-derived extracellular vesicles (EVs) suppress pancreatic insulin secretion to impair glucose homeostasis. EV-encapsulated miR-122 targets PKM in β-cells to suppress glycolysis and ATP-dependent insulin exocytosis. Mice receiving high-miR-122 EVs or bearing BC tumours exhibit suppressed insulin secretion, enhanced endogenous glucose production, impaired glucose tolerance and fasting hyperglycaemia. These effects contribute to tumour growth and are abolished by inhibiting EV secretion or miR-122, restoring PKM in β-cells or supplementing insulin. Compared with non-cancer controls, patients with BC have higher levels of circulating EV-encapsulated miR-122 and fasting glucose concentrations but lower fasting insulin; miR-122 levels are positively associated with glucose and negatively associated with insulin. Therefore, EV-mediated impairment of whole-body glycaemic control may contribute to tumour progression and incidence of type 2 diabetes in some patients with BC.


Conflict of interest statement

Competing Interests Statement

S.N. and D.D. are employees of Regulus Therapeutics, inc. The remaining authors declare no competing interests.

Figures

Extended Data Fig. 1
Extended Data Fig. 1. Additional assessments of the EV injection model in Figure 1.
a, Food consumption was calculated by total food consumed in 48 h after the 8th EV/PBS injection (n=3 mice per group). b, Body weight was monitored (n=8 mice for MDA-MB-231 EV and n=7 mice for other groups). c, Liver tissues collected at ZT10 from mice that had received 5 weeks of EV/PBS injections were subjected to RNA-seq and GSEA, showing enrichment of genes related to IRS1/2 signalling (n=6 mice per group). d, Heatmap showing the relative levels of selected genes based on the RNA-seq data. e, Triglyceride levels measured in the liver (n=4 mice for PBS and MCF-10A/vec EV group and n=5 for other groups). f-h, Mouse serum glucagon (f), GLP-1 (g), and ghrelin (h) levels were determined by ELISA kits (n=6 mice for PBS and MCF-10A/vec EV group and n=8 for other groups). Data are shown as mean ± SEM. One-way ANOVA followed by Tukey’s multiple comparison test was used for a, e-h. Two-way ANOVA followed by Tukey’s multiple comparison test was used for b. ns: not significant. *P<0.05. Numerical source data and statistics are available online.
Extended Data Fig. 2
Extended Data Fig. 2. Characterization of BC-cell-secreted EVs.
a, NTA of MDA-MB-231 EVs (n=3 replicates). b, Immunoblots of indicated proteins in MDA-MB-231 whole cell lysate and EV fractions from OptiPrep gradient ultracentrifugation showing EV markers and a Golgi marker (GM130, as a negative control for EV-specific proteins). c, RT-qPCR-determined miR-122 (left) and miR-16 (right) levels in OptiPrep gradient fractions of MDA-MB-231 EVs (n=3 replicates; normalized to an ath-miR159a spike-in control). d, miR-122 levels in EVs treated with Proteinase K (PK, 10 μg/mL) followed by RNase If (RNase, 40 U) or with PBS (as control) in the presence or absence of 1% Triton X-100 (TX-100) (n=3 replicates). RT-qPCR data were normalized to an ath-miR159a spike-in control added after all treatments. e, RT-qPCR showing relative miR-122 levels (normalized to spike-in control) in EVs isolated from the sera of mice in Figure 1 (n=6 mice per group). Data are shown as mean ± SEM. One-way ANOVA followed by Tukey’s multiple comparison test was used for d and e. ns: not significant. *P<0.05, **P<0.01, ***P<0.001. Numerical source data, statistics and unprocessed blots are available online.
Extended Data Fig. 3
Extended Data Fig. 3. Functional assessments of EVs and PKM2 in MIN6 β-cells.
a, Uptake of CFSE-labelled EVs by MIN6 cells (CFSE, green; DAPI, blue). Bar=50 μm. b, Immunoblots of MIN6 cells after EV/PBS treatment for 48 h. When indicated, MIN6 cells were pre-transfected with a PKM2 cDNA expression plasmid or empty vector. c, Pyruvate kinase activity in MIN6 cells (n=3 replicates). d, Relative ATP/ADP ratio in MIN6 cells (n=4 replicates) after low glucose (3.3 mM) or high glucose (16.7 mM) stimulation. Data were normalized to the first bar. e, Changes of the intracellular Ca2+ levels measured by Fura-2/AM in MIN6 cells after low or high glucose stimulation (n=6 replicates). f, Insulin secretion by EV/PBS-treated MIN6 cells (n=3 replicates) under 3.3 mM glucose, 16.7 mM glucose, or 20 mM monomethyl succinate (MMS). g, Immunoblots of MIN6 cells transfected with siRNA against Pkm2 (scrambled siRNA served as a negative control). h,i, Relative ATP/ADP ratio (h; n=6 replicates) and insulin secretion (i; n=4 replicates) in siRNA-transfected MIN6 cells after low glucose (3.3 mM) or high glucose (16.7 mM) stimulation. For all bar and line graphs, values are shown as mean ± SEM. One-way ANOVA followed by Tukey’s multiple comparison test was used for c and right panel of f. Two-way ANOVA with repeated measures followed by Tukey’s multiple comparison test was used for e. Two-way ANOVA followed by Tukey’s multiple comparison test was used for d and left panel of f, or by Bonferroni’s multiple comparison test used for h and i. *P<0.05, **P<0.01, ***P<0.001 compared to PBS or as indicated; #P<0.05, ##P<0.01, ###P<0.001 compared to MCF-10A/vec EV. In e, the upper set of signs indicate MCF-10A/miR-122 EV vs. PBS or MCF-10A/vec EV, and the lower set indicate MDA-MB-231 EV vs. PBS or MCF-10A/vec EV. Numerical source data, statistics and unprocessed blots are available online.
Extended Data Fig. 4
Extended Data Fig. 4. Characterization of MDA-MB-231-derived cells.
a, Immunoblots showing protein levels in indicated MDA-MB-231-derived cells and their EVs. EVs secreted from equal number of cells were loaded. b, NTA of EVs from indicated cells (n=3 replicates). The inserted graph shows the numbers of EVs secreted in 24 hours per 107 cells (n=3 replicates). c, Sanger sequencing showing genetic knockout of hsa-mir-122 gene in MDA-MB-231/miR-122 KO cells. Dashes indicate the region deleted by the CRISPR-Cas9 genome editing system. d, RT-qPCR-determined miR-122 and miR-16 levels (normalized to U6 snRNA) in indicated MDA-MB-231-derived cells (n=6 replicates). e, Cell proliferation indicated by cell numbers counted every 24 hours (n=4 replicates). f, Cell proliferation indicated by MTS assay. Optical density (O.D.) at 490 nm was shown (n=8 replicates). g-j, Volcano plots showing differentially expressed miRNAs in indicated cells and EVs based on small RNA-seq data (n=2 replicates). The position of miR-122 was noted in each plot. Data in bar and line graphs are shown as mean ± SEM. Two-way ANOVA followed by Tukey’s multiple comparison test was used for e and f. *P<0.05, **P<0.01. Numerical source data, statistics and unprocessed blots are available online.
Extended Data Fig. 5
Extended Data Fig. 5. Additional assessments of the MDA-MB-231-derived tumour model in Figure 3a–n.
a, Body weight over time (n=6 mice per group). b,c, Serum glucagon (b) and ghrelin (c) levels (n=6 mice per group). d, Weight of gonadal white adipose tissue (WAT) (n=7 mice per group). Values were normalized to whole body weight. e, RT-qPCR showing the relative mRNA levels (normalized to Gapdh mRNA) in gonadal WAT (n=7 mice per group). f, Immunoblots of indicated proteins in the gastrocnemius muscle tissues from indicated groups. g, Representative images showing 2-NBDG uptake in the gastrocnemius from indicated groups (left; Bar=50μm) and overall 2-NBDG signal intensity quantified by ImageJ (right; n=5 mice per group). Data in bar and line graphs are shown as mean ± SEM. Two-way ANOVA followed by Tukey’s multiple comparison post was used for a. One-way ANOVA followed by Tukey’s multiple comparison test was used for b-e and g. *P<0.05, **P<0.01, ***P<0.001. Numerical source data, statistics and unprocessed blots are available online.
Extended Data Fig. 6
Extended Data Fig. 6. Cell proliferation and migration under different culture conditions.
a, Cell number counting every 24 hours under different glucose concentrations (n=4 biologically independent plates of cells). Medium containing indicated glucose concentration was replenished every 24 hours. b, Wound closure migration assay under indicated glucose concentration. Bar=200μm. c, Cell number counting every 24 hours under different insulin concentrations (n=4 biologically independent plates of cells). Medium containing indicated insulin concentration was replenished every 24 hours. Data are shown as mean ± SEM. Two-way ANOVA followed by Tukey’s multiple comparison test was used for a-c. *P<0.05, **P<0.01, ***P<0.001. Numerical source data and statistics are available online.
Extended Data Fig. 7
Extended Data Fig. 7. Assessments of the pancreatic islets of mice in Figure 7g–j.
a, Immunofluorescence of pancreas sections (left) showing PDX1 expression (green) in β-cells (insulin+; red). Bar=50μm. The overall frequency of PDX1+ among insulin+ cells was calculated and plotted in the right panel (n=4 mice per group except n=5 mice for MDA-MB-231/control + SGLT2i group). b, Immunofluorescence of pancreas sections (left) showing apoptosis events (indicated by cleaved caspase-3 staining; green) in β-cells (insulin+; red). Bar=50μm. The overall frequency of cleaved caspase-3+ among insulin+ cells was calculated and plotted in the right panel (n=4 mice per group except n=5 mice for MDA-MB-231/control + SGLT2i group). c, Representative H&E staining of pancreas sections (left) showing the regular morphology of mouse islets. Bar=50μm. Area of at least 8 islets from each mouse was calculated and plotted in the right panel (n=4 mice per group except n=5 mice for MDA-MB-231/control + SGLT2i group). Data are shown as mean ± SEM. One-way ANOVA followed by Tukey’s multiple comparison test was used for a-c. ns: not significant. Numerical source data and statistics are available online.
Extended Data Fig. 8
Extended Data Fig. 8. Characterization of CD24+ EVs enriched from human serum samples.
a, Immunoblots of indicated proteins in CD24+ EVs enriched from equal volume of human serum samples, including 3 non-cancer controls and 3 cases of BC. b, NTA and a representative EM image of the CD24+ EVs enriched from the serum of a BC patient. Bar=200nm. c, Calculated ratio of miR-122 abundance in CD24+ vs. total (CD9/CD63/CD81+) circulating EVs. d, RT-qPCR showing relative miR-122 levels in CD24+ EVs (from 3 cases of BC patients) following indicated treatment. Data are shown as mean ± SEM. One-way ANOVA followed by Holm-Sidak’s multiple comparison test was used for c. *P<0.05 and ***P<0.001. Numerical source data, statistics and unprocessed blots are available online.
Extended Data Fig. 9
Extended Data Fig. 9. Gating strategies used for islet cell flow cytometry.
Gating strategies used to analyse uptake of CFSE-labelled EVs by insulin+ pancreatic islet β-cells presented in Figure 2c. a-d, Islets were treated with PBS or EVs as indicated.
Figure 1:
Figure 1:. BC-derived EVs suppress insulin signalling in liver and enhance hepatic glucose production.
a, Liver tissues were collected from mice after 5 weeks of EV/PBS treatment and analysed by RNA-seq and GSEA (n=6 mice per group). b, Immunoblots using the liver lysates from these mice. c,d, Liver glycogen levels determined by PAS staining (c; Bar=100 μm; representative images are shown) and phenol-sulfuric acid method (d; n=9 mice per group). e, RT-qPCR showing relative mRNA levels (normalized to Cyclophilin B mRNA) in the liver (n=10 mice per group). f, PTT showing hepatic gluconeogenesis (left) and the corresponding area under curve (AUC) analysis (right) (n=8 mice for MDA-MB-231 EV group and n=7 mice for other groups). g,h, Fasting insulin (g) and c-peptide (h) levels in the sera (n=9 mice per group). i, Basal (fasting) and glucose-stimulated insulin levels (n=8 mice for MDA-MB-231 EV group and n=7 mice for other groups). j, Intraperitoneal glucose tolerance test (IP-GTT) (left) with the AUC analysis (right) (n=8 mice for MDA-MB-231 EV group and n=7 mice for other groups). k, Fasting blood glucose levels (n=8 mice for MDA-MB-231 EV group and n=7 mice for other groups). l, Immunoblots of indicated proteins in liver tissues collected 15 min after i.p. injection of 2 U/kg insulin or saline (control). m, Insulin tolerance test (ITT) showing no significant differences in hepatic insulin responsiveness among different groups (n=7 mice per group). In bar and line graphs, values are shown as mean ± SEM. One-way ANOVA followed by Tukey’s multiple comparison test was used for d,e,g,h,k and for the AUC panels of f,j,m. Two-way ANOVA followed by Tukey’s multiple comparison test was used for f,i,j,m. *P<0.05, **P<0.01, ***P<0.001 compared to PBS or as indicated; #P<0.05, ##P<0.01, ###P<0.001 compared to MCF-10A/vec EV. In f,i,j,m, signs above curves indicate MCF-10A/miR-122 EV vs. PBS or MCF-10A/vec EV, and those underneath the curves indicate MDA-MB-231 EV vs. PBS or MCF-10A/vec EV. Numerical source data, statistics and unprocessed blots are available online.
Figure 2:
Figure 2:. miR-122 in BC-derived EVs suppresses insulin secretion.
a, RNA-seq and GSEA of human islets treated as indicated (n=2 per treatment). b, Relative mRNA levels in human islets (n=4 replicates). c, Uptake of CFSE-labelled EVs by primary mouse islets assessed by flow cytometry with intracellular insulin staining of islet cells. d-i, Primary mouse islets were treated with EV/PBS for 48 hours prior to the following experiments: (d) relative miR-122 levels with indicated inhibitor treatment (n=4 replicates); (e) immunoblots; (f) normalized ATP levels (n=3 replicates); (g) intracellular Ca2+ levels (islet cells maintained at 3.3 mM glucose were switched to 16.7 mM glucose at minute 5; n=4 replicates); (h) relative oxygen consumption rates (under 16.7 mM glucose added at minute 0; n=4 replicates); (i) insulin secretion under 3.3 mM (n=3 replicates) or 16.7 mM glucose (n=4 replicates) (left) or 16.7 mM glucose + 100 nM Exendin-4 (n=3 replicates; right). j, Immunofluorescence indicating EV uptake (human-specific CD9) by β-cells (insulin+) in islets from mice in Figure 1. Bar=50 μm. k, Immunofluorescence indicating uptake of MDA-MB-231-Lck-GFP EVs by β-cells (insulin+) in mice after 3 times of EV/PBS injections. Bar=50 μm. Plot (right) shows the frequency of GFP+ among insulin+ cells (n=3 mice). l-p, Ex vivo assessments of islets isolated from mice that had received 6 semi-weekly EV/PBS injections: (l) relative RNA levels (n=3 mice per group); (m) immunohistochemistry (IHC) of PKM in pancreas sections. Representative images are shown. Bar=50 μm; (n) pyruvate kinase activity; (o) ATP levels; and (p) insulin secretion (n=6 mice per group for n-p). In bar and line graphs, values are shown as mean ± SEM. One-way ANOVA followed by Tukey’s multiple comparison test was used for b,d,l,n and the middle and right panels of i. Two-way ANOVA followed by Tukey’s multiple comparison test was used for g and h (repeated measures), f,o,p, and left panel of i. *P<0.05, **P<0.01, ***P<0.001 compared to PBS; #P<0.05, ##P<0.01, ###P<0.001 compared to MCF-10A/vec EV. ns: not significant. In g,h, signs above or underneath the curves denote the same comparisons as in Figure 1f. Numerical source data, statistics and unprocessed blots are available online.
Figure 3:
Figure 3:. Tumours require EV secretion and miR-122 to alter insulin secretion and glucose homeostasis.
a-n, Indicated MDA-MB-231-derived cells were injected into mammary fat pad to form tumours. Tumour-bearing and age-matched tumour-free mice were sacrificed for tissues collection before tests of insulin and glucose metabolism performed on day 30–35. a, Relative miR-122 levels (normalized to spike-in control) in purified serum EVs. b, RNA levels of miR-122 and Pkm in islets isolated from indicated groups (n=3 mice per group). c, IHC of PKM in pancreas sections. Bar=100 μm. d,e, Fasting insulin and c-peptide levels. f, Basal (fasting) and glucose-stimulated insulin levels. g, IP-GTT with AUC analysis. h, Immunoblots showing protein levels in the liver. i, Liver glycogen levels determined by PAS staining (left) and phenol-sulfuric acid method (right). Bar=100 μm. j, Relative mRNA levels in the liver. k, PTT with AUC analysis. l, Fasting blood glucose levels. (n=6 mice per group for a,d-g,i-l). m, Tumour volume measurements (left; n=7 mice per group) and individual tumour growth (right). n, Representative IHC of Ki67 (left) and percentage of Ki67+ tumour cells (right; n=6 mice per group). Bar=100 μm. o-r, MDA-MB-231/Rab27a KD cells were injected to form mammary tumours. Starting from day 3, mice were semi-weekly injected with indicated EVs or PBS for 5 weeks. o, Basal and glucose-stimulated insulin levels (n=8 mice per group). p, IP-GTT (n=6 mice per group). q, Immunoblots showing indicated proteins in the liver. r, Tumour volume measurements (left; n=8 mice per group) and individual tumour growth (right). For bar and line graphs, values are shown as mean ± SEM. One-way ANOVA followed by Tukey’s multiple comparison test was used for a,b,d,e,i,j,l,n, and AUC in g and k. Two-way ANOVA was used for f,g,k,m with Tukey’s multiple comparison test, and for o,p,r with Bonferroni’s multiple comparison test. *P<0.05, **P<0.01, ***P<0.001 for MDA-MB-231/control vs. tumour-free or as indicated; #P<0.05, ##P<0.01, ###P<0.001 for MDA-MB-231/control vs. MDA-MB-231/Rab27a KD; &P<0.05, &&P<0.01, &&&P<0.001 for MDA-MB-231/control vs. MDA-MB-231/miR-122 KO. ‡P<0.05, ‡‡‡P<0.001 for MDA-MB-231/Rab27a KD vs. MDA-MB-231/miR-122 KO. Numerical source data, statistics and unprocessed blots are available online.
Figure 4:
Figure 4:. A patient-derived xenograft model also exhibits impairments of insulin secretion and glucose homeostasis.
a, NTA of PDX-derived EVs (n=3 replicates). b, Immunoblots showing protein levels in indicated PDX-derived cells and EVs. EVs secreted from equal number of cells were loaded. c, Relative miR-122 levels in indicated cells and EVs (n=6 replicates for cells; n=3 replicates for EVs). d, Sanger sequencing showing genetic knockout of hsa-mir-122 gene in PDX/miR-122 KO cells. Dashes indicate the deleted region. e, Immunoblots showing protein levels in human islets treated with PBS or PDX-derived EVs for 48 hours. f, Pyruvate kinase activity in EV/PBS-treated human islets (n=3 replicates). g, Insulin secretion by human islets (n=3 replicates) under low (left) or high glucose (right). h, Relative miR-122 (left) and Pkm1/2 mRNA levels (right) in mouse islets isolated from indicated groups (n=4 mice per group). i, Pyruvate kinase activity in mouse islets isolated from indicated groups (n=4 mice per group). j, Fasting insulin levels (n=8 mice per group). k, Immunoblots showing protein levels in the liver from indicated groups. l, mRNA levels in the liver (n=4 mice per group). m, Basal and glucose-stimulated insulin levels (n=8 mice per group). n, IP-GTT with AUC analysis (n=8 mice per group). o, Tumour volume measurements (left; n=8 mice per group) and individual tumour growth curve (right). For bar and line graphs, values are shown as mean ± SEM. One-way ANOVA followed by Tukey’s multiple comparison test was used for f-l. Two-way ANOVA followed by Tukey’s multiple comparison test was used for m-o. *P<0.05, **P<0.01, ***P<0.001 for indicated group vs. tumour-free, or as indicated; #P<0.05, ##P<0.01, ###P<0.001 for indicated group vs. PDX/Rab27a KD; &P<0.05, &&P<0.01, &&&P<0.001 for indicated group vs. PDX/miR-122 KO. In m-o, signs above the curves indicate PDX/control group vs. indicated groups and signs underneath the curves indicate PDX/miR-122 OE group vs. indicated groups. Numerical source data, statistics and unprocessed blots are available online.
Figure 5:
Figure 5:. miR-122 acts as a main effector in BC-associated dysregulation of insulin and glucose homeostasis.
a-h, Mice were grafted with MDA-MB-231/miR-122 KO tumours followed by 10 semi-weekly EV injections prior to the following experiments. a, Relative RNA levels in islets (n=7 mice for MDA-MB-231/control EV group and n=6 for MDA-MB-231/miR-122 KO EV group). b, Immunoblots showing protein levels in islets. c, Pyruvate kinase activity in islets (n=7 mice per group). d, Basal and glucose-stimulated insulin levels (n=7 mice for MDA-MB-231/control EV group and n=6 for MDA-MB-231/miR-122 KO EV group). e, Immunoblots showing protein levels in liver. f, IP-GTT with AUC analysis (n=8 mice per group). g, Fasting blood glucose levels (n=7 mice per group). h, Tumour volumes (left; n=8 mice per group) and individual tumour growth curve (right). i-p, miR-122 ONI (anti-miR-122) or mismatch control were injected into tumour-free or tumour-bearing mice after tumour cell injection, for a total of ~6 weeks. i-k (n=4 mice per group): RNA levels of miR-122 (i), Pkm1 (j), and Pkm2 (k) in islets. l, Pyruvate kinase activity in islets (n=4 mice per group). m, Basal and glucose-stimulated insulin levels. n, IP-GTT with AUC analysis. o, Fasting blood glucose levels. p, Tumours volumes (left) and individual tumour growth curve (right) (n=8 mice per group for m-p). For all bar and line graphs, values are shown as mean ± SEM. Unpaired two-tailed t-test was used for a,c,g and AUC panel of f. Two-way ANOVA followed by Bonferroni’s multiple comparison test was used for d,f,h. For i-l, o and AUC panel of n, one-way ANOVA followed by Tukey’s multiple comparison test was used among groups receiving the same antisense or control treatment and unpaired t-test was used for comparing MDA-MB-231/control groups with mismatch control or anti-miR-122. For m,n,p, two-way ANOVA followed by Tukey’s multiple comparison test was used. *P<0.05, **P<0.01, ***P<0.001 for MDA-MB-231/control vs. tumour-free both receiving mismatch control or as indicated; #P<0.05, ##P<0.01, ###P<0.001 for MDA-MB-231/control vs. MDA-MB-231/Rab27a KD both receiving mismatch control; &P<0.05, &&P<0.01, &&&P<0.001 for MDA-MB-231/control receiving anti-miR-122 vs. mismatch control. Numerical source data, statistics and unprocessed blots are available online.
Figure 6:
Figure 6:. Restoration of PKM2 expression in β-cells abolishes the effects of BC tumours on insulin and glucose metabolism.
Indicated AAV were injected through the bile duct prior to mammary fat pad injection of MDA-MB-231 cells. Tumour-bearing and age-matched tumour-free mice were sacrificed for tissue collection before all tests of insulin and glucose metabolism were performed on day 30–35. a, Immunofluorescence of pancreas sections (left) showing AAV-delivered EGFP expression (green) in β-cells (insulin+; red). Liver sections (right) were stained with EGFP antibody to show lack of a leakage from bile duct injection. Bar=100 μm. b, Representative IHC of PKM in pancreas sections. Islets are indicated by dashed lines. Bar=100 μm. c, Body weight over time. d, Basal and glucose-stimulated insulin levels. e, IP-GTT with AUC analysis. f, Immunoblots showing protein levels in the liver. g, Relative RNA levels in the liver. h, Fasting blood glucose. i, Tumour volumes (left) and individual tumour growth curve (right). j, Representative IHC of Ki67 (left) and percentage of Ki67+ tumour cells (right). Bar=100 μm. For all bar and line graphs, values are shown as mean ± SEM. n=5 mice for MDA-MB-231/AAV8-mI-mPKM2 group and n=4 mice for other groups. Two-way ANOVA followed by Tukey’s multiple comparison test was used for c-e. Two-way ANOVA followed by Bonferroni’s multiple comparison test was used for i. One-way ANOVA followed by Tukey’s multiple comparison test was used for g,h and AUC analysis of e. Unpaired two-tailed t-test was used for j. *P<0.05, **P<0.01, ***P<0.001 for MDA-MB-231/AAV8-mI-EGFP vs. tumour-free/AAV8-mI-EGFP or as indicated; #P<0.05, ##P<0.01, ###P<0.001 for MDA-MB-231/AAV8-mI-EGFP vs. MDA-MB-231/AAV8-mI-mPKM2. Numerical source data, statistics and unprocessed blots are available online.
Figure 7:
Figure 7:. Supplementing insulin or lowering glucose levels intervenes BC tumour growth.
a-f, Insulin-releasing or control pellets were implanted in tumour-bearing and tumour-free mice. Live animal assays were conducted in week 6 post tumour cell injection, and tissues were collected at the end of week 6. a, Body weight over time (n=7 mice for MDA-MB-231/Rab27a KD group with insulin implant and n=9 mice per group for others. b, Basal (fasting, at 0 minute) and glucose-stimulated insulin levels (at 10 or 90 minutes; n=7 for MDA-MB-231/Rab27a KD groups with insulin or control implants and n=8 mice per group for others). c, Immunoblots of liver tissues. d, IP-GTT with AUC analysis. e, Fasting blood glucose levels. f, Tumour volumes (left) and individual tumour growth curves (right). For a, d-f, n=7 mice for MDA-MB-231/Rab27a KD group with insulin implant and n=9 mice per group for others. g-j, SGLT2i or placebo was orally given to tumour-bearing mice. Live animal assays were conducted in week 6 and tissues were collected at the end of week 6. g, Body weight over time. h, Blood glucose levels at ZT9 and ZT14 (1 hour before or 4 hours after drug administration). i, IP-GTT with AUC analysis. j, Tumour volumes (left) and individual tumour growth curves (right). For g-j, n=9 mice per group. For bar and line graphs, values are shown as mean ± SEM. Two-way ANOVA followed by Tukey’s multiple comparison test was used for a,d,f,g,i,j. One-way ANOVA followed by Tukey’s multiple comparison test was used among groups with the same implants in b,e and AUC analysis of d and i. Unpaired two-tailed t-test was used for MDA-MB-231/control with control vs. insulin implants in b,d,e, as well as for h. For a-f, *P<0.05, **P<0.01, ***P<0.001 for MDA-MB-231/control vs. MDA-MB-231/Rab27a KD with control implants or as indicated; #P<0.05, ##P<0.01, ###P<0.001 for MDA-MB-231/control with control vs. insulin implants. ns: not significant. For g-j, *P<0.05, **P<0.01, ***P<0.001 for MDA-MB-231/control + placebo vs. MDA-MB-231/miR-122 KO + placebo or as indicated; #P<0.05, ##P<0.01, ###P<0.001 for MDA-MB-231/control + placebo vs. MDA-MB-231/control + SGLT2i. Numerical source data, statistics and unprocessed blots are available online.
Figure 8:
Figure 8:. miR-122 in circulating EVs is associated with fasting blood glucose and insulin in BC patients.
a-g, Fasting serum was collected from BC patients who had never been diagnosed with diabetes and had a BMI<35 kg/m2 (n=26), a group of non-cancer control females initially selected to match the BC patient characteristics of age and BMI (n=30), and an additional group of non-cancer control females selected to match the high glucose (HG) levels in BC patients (n=20). Scatter plots: (a) glucose, (b) insulin, (c) c-peptide, (d) HOMA-β (%), (e) HOMA-IR, (f) miR-122 in total circulating EVs (CD9/CD63/CD81+), and (g) miR-122 in CD24+ circulating EVs compared among the three groups (n=27 for non-cancer control group in g due to insufficient amount of serum for the other 3 samples in this group). Relative miR-122 levels were determined in circulating EVs enriched by CD9/CD63/CD81 or CD24 antibodies by RT-qPCR and normalized to ath-miR159a spike-in control. h and i, Donated human islets were treated twice in 48 hours with EVs purified from serum samples of selected non-cancer control and breast cancer subjects prior to assays of ATP levels (h) and insulin secretion (i) under 3.3 mM or 20 mM glucose stimulation (n=10 replicates). j-l, Scatter plots showing the correlations between relative miR-122 levels and fasting insulin (j), c-peptide (k), and glucose (l) among BC patients and the non-cancer control females (the non-cancer HG group is excluded due to the presence of IR confounding data interpretation). Kendall rank correlation coefficient (Tau) and P value are shown. For bar graphs in h and i, values are shown as mean ± SEM. One-way ANOVA followed by Holm-Sidak’s multiple comparison test was used for a-g. Two-way ANOVA followed by Bonferroni’s multiple comparison test was used for h and i. *P<0.05, **P<0.01, ***P<0.001. Numerical source data and statistics are available online.

References

    1. Ferlay J et al. Cancer incidence and mortality worldwide: sources, methods and major patterns in GLOBOCAN 2012. Int J Cancer 136, E359–386 (2015). - PubMed
    1. Ryu TY, Park J & Scherer PE Hyperglycemia as a risk factor for cancer progression. Diabetes Metab J 38, 330–336 (2014). - PMC - PubMed
    1. Maskarinec G et al. Type II Diabetes, Obesity, and Breast Cancer Risk: The Multiethnic Cohort. Cancer Epidemiol Biomarkers Prev 26, 854–861 (2017). - PMC - PubMed
    1. Bronsveld HK et al. Diabetes and Breast Cancer Subtypes. PLoS One 12, e0170084 (2017). - PMC - PubMed
    1. Xue F & Michels KB Diabetes, metabolic syndrome, and breast cancer: a review of the current evidence. Am J Clin Nutr 86, s823–835 (2007). - PubMed

Publication types