

Scalable single-cell RNA sequencing from full transcripts with Smart-seq3xpress
- PMID: 35637418
- PMCID: PMC9546772
- DOI: 10.1038/s41587-022-01311-4
Scalable single-cell RNA sequencing from full transcripts with Smart-seq3xpress
Abstract
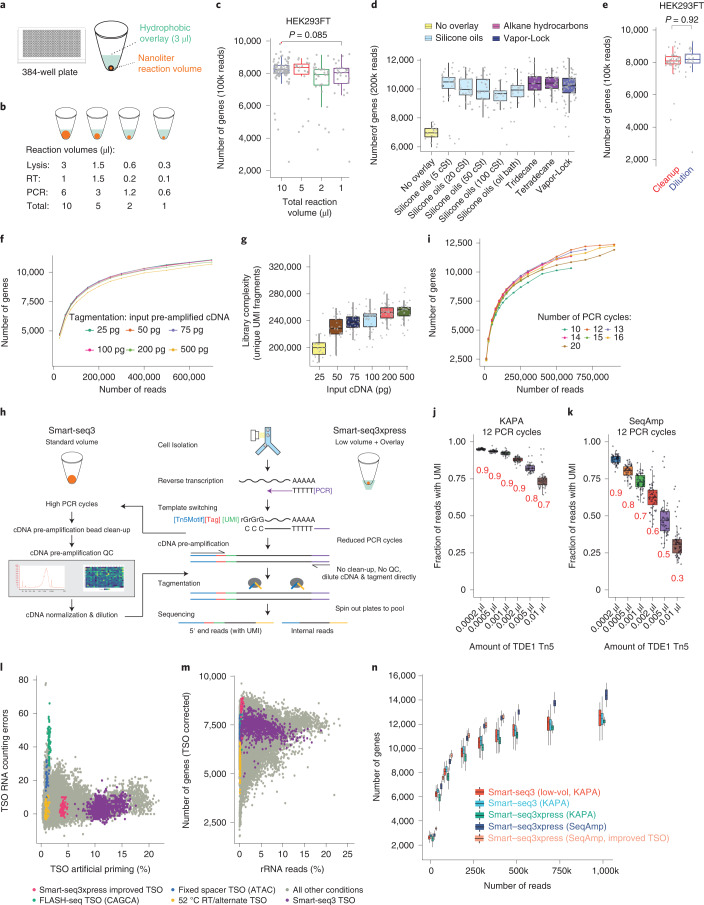
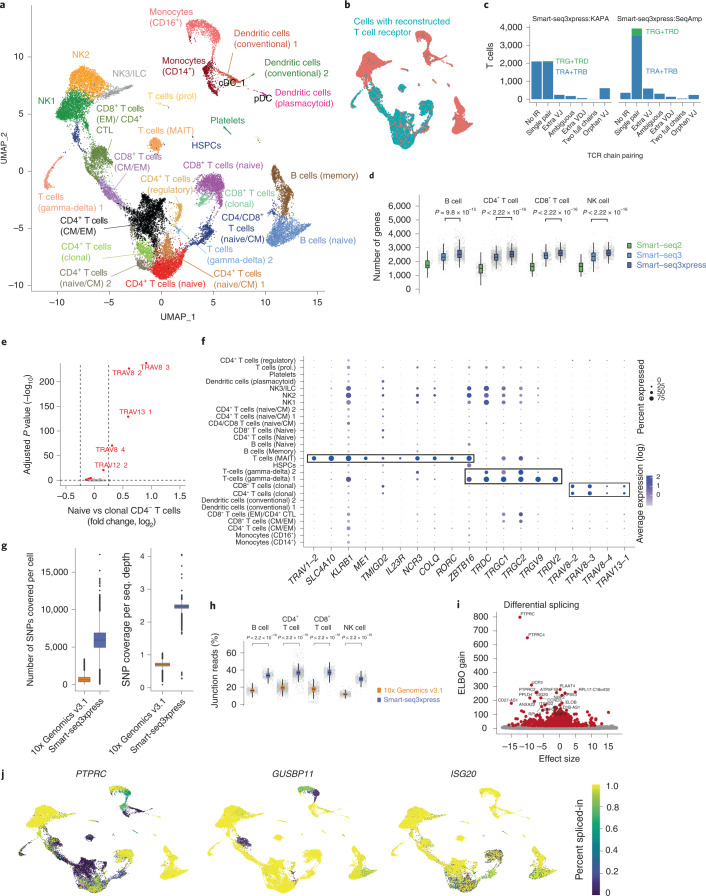
Current single-cell RNA sequencing (scRNA-seq) methods with high cellular throughputs sacrifice full-transcript coverage and often sensitivity. Here we describe Smart-seq3xpress, which miniaturizes and streamlines the Smart-seq3 protocol to substantially reduce reagent use and increase cellular throughput. Smart-seq3xpress analysis of peripheral blood mononuclear cells resulted in a granular atlas complete with common and rare cell types. Compared with droplet-based single-cell RNA sequencing that sequences RNA ends, the additional full-transcript coverage revealed cell-type-associated isoform variation.
© 2022. The Author(s).
Conflict of interest statement
M.H-J. and R.S. are inventors on the patent relating to Smart-seq3 that is licensed to Takara Bio USA. C.Z. declares no competing interests.
Figures


References
Publication types
MeSH terms
Substances
LinkOut - more resources
Full Text Sources
Other Literature Sources
