. 2022 Jun;29(6):507-518.
doi: 10.1038/s41594-022-00772-0. Epub 2022 May 30.

Structural insights into binding of therapeutic channel blockers in NMDA receptors

Affiliations

Structural insights into binding of therapeutic channel blockers in NMDA receptors

Tsung-Han Chou et al. Nat Struct Mol Biol. 2022 Jun.

Abstract

Excitatory signaling mediated by N-methyl-D-aspartate receptor (NMDAR) is critical for brain development and function, as well as for neurological diseases and disorders. Channel blockers of NMDARs are of medical interest owing to their potential for treating depression, Alzheimer's disease, and epilepsy. However, precise mechanisms underlying binding and channel blockade have remained limited owing to challenges in obtaining high-resolution structures at the binding site within the transmembrane domains. Here, we monitor the binding of three clinically important channel blockers: phencyclidine, ketamine, and memantine in GluN1-2B NMDARs at local resolutions of 2.5-3.5 Å around the binding site using single-particle electron cryo-microscopy, molecular dynamics simulations, and electrophysiology. The channel blockers form different extents of interactions with the pore-lining residues, which control mostly off-speeds but not on-speeds. Our comparative analyses of the three unique NMDAR channel blockers provide a blueprint for developing therapeutic compounds with minimal side effects.


Conflict of interest statement

Competing interests

The authors declare no competing interests.

Figures
Extended Data Figure 1.
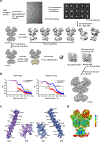
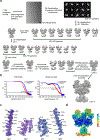
Extended Data Figure 1.. Single-particle analysis on agonist-bound GluN1a-2B NMDARs.
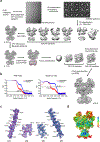
a, A representative EM micrograph, 2D classes, and the 3D classification/refinement workflow. The scale bar represents 34.9 nm. b, The masked (Blue) and unmasked (Red) Fourier shell correlation (FSC) curves of two half maps (Left) and map vs model (Right). c, Zoom-in views of the gate and the pore-forming region fitted with the molecular model. d, The local resolution estimation calculated by ResMap.
Extended Data Figure 2.
Extended Data Figure 2.. Structural analysis of agonist-bound GluN1a-2B NMDARs
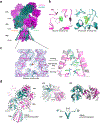
a, Overall cryo-EM density of the agonist-bound rat GluN1a-2B NMDAR (GluN1a and GluN2B in magenta and forest, respectively). b, EM density of the bound glycine (left) and glutamate (right) at LBD of GluN1a and GluN2B, respectively. c, Zoom-in view of the channel blocker binding cavity at the TMD where there is no density (left). The binding site has three layers, Thr-ring (GluN1a-Thr648 GluN2B-Thr647) at the channel gate, the hydrophobic-ring (GluN1a-Val644 and -Ala645 and GluN2B-Leu643 and -Ala644), and the Asn-ring (GluN1a-Asn616 and GluN2B-Asn615). d, Domain organization and functional state. The agonist-bound GluN1a-2B NMDAR here has similarity to the non-active1 conformation of GluN1b-2B NMDAR (gray, PDBID: 6WHS) with the similar ATD and LBD orientations and extent of separation between the LBD-TMD linkers of GluN2B (spheres = GluN2B-Gln662).
Extended Data Figure 3.
Extended Data Figure 3.. Single-particle analysis on PCP-bound GluN1a-2B NMDARs.
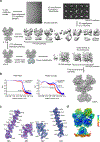
a, A representative EM micrograph, 2D classes, and the 3D classification/refinement workflow. The scale bar represents 34.9 nm. b, The masked (Blue) and unmasked (Red) Fourier shell correlation (FSC) curves of two half maps (Left) and map vs model (Right). c, Zoom-in views of the gate and the pore-forming region fitted with the molecular model. d, The local resolution estimation calculated by ResMap.
Extended Data Figure 4.
Extended Data Figure 4.. Comparison of channel blocker binding sites.
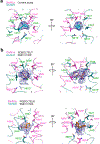
a-d, Cryo-EM density and fitted models of structures in the absence of a channel blocker (a, apo), PCP (b, orange), S(+)-ketamine (c, cyan), and memantine (d, grey). The residues that are forming the binding site are highlighted as sticks and the densities of the channel blockers are highlighted in green. e-g, Local structural comparison of binding residues between apo and PCP (e), S-(+)-ketamine (f), and memantine (g).
Extended Data Figure 5.
Extended Data Figure 5.. Single-particle analysis on S-(+)-ketamine-bound GluN1a-2B NMDARs.
a, A representative EM micrograph, 2D classes, and the 3D classification/refinement workflow. The scale bar represents 34.9 nm. b, The masked (Blue) and unmasked (Red) Fourier shell correlation (FSC) curves of two half maps (Left) and map vs model (Right). c, Zoom-in views of the gate and the pore-forming region fitted with the molecular model. d, The local resolution estimation calculated by ResMap.
Extended Data Figure 6.
Extended Data Figure 6.. Cryo-EM density at the (S)-(+)-ketamine binding site.
a, Zoomed-in views of the cryo-EM density (mesh) fitted with the (S)-(+)-ketamine molecule (cyan sticks) in Pose-3. b-c, Cryo-EM density of human GluN1a-2A NMDARs (PDBID:7EU7 and EMD:31308, panel b) complexed to (S)-(+)-ketamine (salmon sticks) and human GluN1a-GluN2B NMDARs (PDBID:7EU8 and EMD:31309, panel c) complexed with (S)-(+)-ketamine (orange sticks).
Extended Data Figure 7.
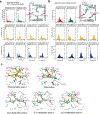
Extended Data Figure 7.. Long time-scale MD simulations of (S)-(+)-ketamine-bound GluN1a-2B NMDAR starting from Pose-1.
a, RMSD population density distributions (80 bins per distribution) for three individual Pose-1 1 μs long simulations with runs 1, 2 and 3 each colored blue, orange and green respectively. b, Time series analysis of the (S)-(+)-ketamine Z1 distance expressed as a rolling average (100 frames with a total of 10,000 frames per run) for runs 1 (blue), 2 (orange) and 3 (green). c, Probability density distribution (100 bins) for each independent run of their Z1 (red) and Z2 (green) distances. Dashed lines represent the starting Z1 and Z2 distances of Pose-1.
Extended Data Figure 8.
Extended Data Figure 8.. Single-particle analysis on memantine-bound GluN1a-GluN2B NMDARs.
a, A representative EM micrograph, 2D classes, and the 3D classification/refinement workflow. The scale bar represents 34.9 nm. b, The masked (Blue) and unmasked (Red) Fourier shell correlation (FSC) curves of two half maps (Left) and map vs model (Right). c, Zoom-in views of the gate and the pore-forming region fitted with the molecular model. d, The local resolution estimation calculated by ResMap.
Extended Data Figure 9.
Extended Data Figure 9.. Potency measurement of channel blockers on GluN1a-2B NMDAR.
a-d, Dose-responses of PCP (panel a), S-(+)-ketamine (panel b), memantine (panel c), and Mg2+ (panel d) for wildtype (black circle), GluN1a-V644A (red circle), GluN2B-N615Q (blue triangle), GluN2B-L645A (blue square), and GluN2B-T646S (blue circle) channels recorded on cRNA injected Xenopus oocytes by TEVC. Data points represent the means ± s.d. e, A list of IC50 values, Hill coefficients (nH) calculated based on the dose-response curves. The statistical analysis was done by two-tail Student t-test (*** p<0.001, ** 0.001<p<0.01, * 0.01<p<0.05, n.s. not significant. The IC50 values were estimated from independent dose-response recordings from at least four independent oocytes (n).
Extended Data Figure 10.
Extended Data Figure 10.. Hydrogen-bond network in the Asn-ring.
a-b, Probability density distributions (100 bins) of h-bond distances between all feasible pairs of hydrogen bond doner and acceptor moieties in the Asn-ring for the agonist-bound (panel a) and agonist-memantine-bound (panel b) structures. Density distributions for GluN2B-Asn615 (chain B and D) are in green and red. Those for GluN1a-Asn616 (chain A)/GluN2B-Asn615 (chain B and D) and GluN1a-Asn616 (chain C)/GluN2B-Asn615 (chain B and D) are in yellow and blue, respectively. Asterisks denote the interaction pairs for which h-bonds are the main interaction, as suggested by the highest peak at ~2.5 Å. The structures are representative snapshots of collective variables that maximize the total number of possible simultaneous h-bonding interactions. The Asn-rings are viewed from the extracellular space where representative h-bonds are depicted as dashed yellow lines. The nitrogen atom h-bond doner variable is represented as the COG between both N+-H atoms. Note that the h-bond network patterns for (S)-(+)-ketamine and PCP are similar to the agonist-bound structure. c, Comparison of binding of PCP pose-1 (orange sticks), memantine (gray sticks), and S-(+)-ketamine pose-2, 3, and 4 (cyan sticks) showing inter-carbon (C-C) interactions within 5 Å (yellow dots) and a hydrogen bond (green dots, arrow).
Figure 1.
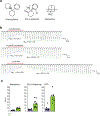
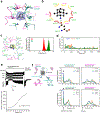
Figure 1.. Channel blocking of NMDAR by memantine, S-(+)-ketamine, and PCP.
a, Chemical structures of phencyclidine (PCP), S-(+)-ketamine, and memantine. b-c, Whole-cell patch-clamp electrophysiology on HEK293 cells transfected with rat GluN1a-2B NMDARs at −80 mV holding voltage. Channel blocking patterns of each blocker compound are measured using the short-pulse glutamate application (5 ms) protocol in the presence and absence of blocker compounds. The hierarchy, memantine > S-(+)-ketamine > PCP, is observed for on and off speeds where on/off-speeds are estimated to be 18.4 ± 5.6/99.2 ± 13.4, 10.9 ± 0.9/50.0 ± 7.8, and 6.5 ± 0.3/18.7 ± 2.6 (sec ± SEM) for PCP (n=7), S-(+)-ketamine (n=11), and memantine (n=8), respectively, by an exponential fit (light purple and green for the on and off components, respectively).
Figure 2.
Figure 2.. Cryo-EM structure and MD simulations of Phencyclidine-bound GluN1a-GluN2B NMDARs.
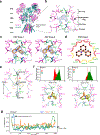
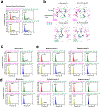
a, The structure of the GluN1a-2B NMDAR (GluN1a and GluN2B in magenta and forest, respectively) bound to PCP (orange sphere) at TMD. b, The zoomed-in view of the EM density (light blue mesh) of PCP surrounded by residues from the three layers, Thr-ring, hydrophobic-ring, and Asn-ring in sticks. c, The two possible PCP binding poses, Pose-1 and 2 (orange sticks), fitted into the EM density. d, LIGPLOT presentation of the binding site for PCP in Pose-1. The ‘eyelashes’ represent hydrophobic interactions and are color coded by distances of carbon-carbon interactions (3–4.5 Å in red and 4.5–5 Å in orange). e, Euclidean distance between the center of geometry (COG) of PCP (orange sticks) and that of Cαs of the Thr-ring residues (Z1) or Cαs of the Asn-ring residues (Z2). f, Probability density of Z1 and Z2 distances are shown as red and green histograms respectively, for simulations starting from Pose-1 (top left) and Pose-2 (top right). Dashed lines in red and green represent the initial Z1 and Z2 distances of the cryo-EM poses, respectively. Snapshots of representative poses from MD simulations (limon) are shown in comparison with cryo-EM poses (orange; lower panels). g, Time series analysis of three independent 1 μs simulations starting from PCP Pose-2 (rolling average of 100 frames from a total of 10,000 frames per run) where convergence to the Pose-1-like Z1 distance can be observed (arrows).
Figure 3.
Figure 3.. Cryo-EM structure and MD simulations of S-(+)-ketamine-bound GluN1a-2B NMDARs.
a, The four possible binding poses (Pose-1–4) of S-(+)-ketamine fitted into the cryo-EM density (grey mesh; upper panels). LIGPLOT presentation of each pose where the ‘eyelashes’ represent hydrophobic interactions as in Fig. 1 (lower panels). b, Population density (100 bins) of the Euclidean distances (Z1 and Z2) calculated as in Fig. 1E–F. Dashed lines in red and green represent the initial Z1 and Z2 distances of the cryo-EM poses, respectively. c, Snapshots of representative poses from MD simulations (limon) are shown in comparison with cryo-EM poses (cyan) for each simulation.
Figure 4.
Figure 4.. Cryo-EM structure and MD simulations of memantine-bound GluN1a-2B NMDARs.
a, The binding of memantine (grey sticks) and the EM density (light blue mesh). A dashed line represents a hydrogen bond. b, LIGPLOT presentation of memantine binding where the ‘eyelashes’ represent hydrophobic interactions as in Fig. 1. c, MD simulations (30 × 100 ns) starting from the cryo-EM pose. Probability density of the Euclidean distances (Z1 and Z2) calculated as in Fig. 1e–f. Dashed lines in red and green represent the initial Z1 and Z2 distances of the cryo-EM poses, respectively. A representative pose of the simulations (limon) with rotation and slight translation in the XY plane compared to the cryo-EM pose (grey, lower panel). d, MD simulations (3 × 1 μs) starting from the cryo-EM pose. The time-series analysis of the Z1 distance where it stays at 6 Å during the simulations. e, Voltage sensitivity of memantine block. Representative whole-cell patch-clamp recording of a transfected HEK293 cell during applications of glutamate and memantine at various membrane potentials (top) and quantification of memantine block over a range of voltage potentials (bottom). Memantine (10 μM) was applied for 10 seconds during each glutamate application followed by 25 seconds of washout. Membrane potential was briefly set to +80 mV to dissociate lingering memantine before the next sweep. Points represent the extent of memantine block at each tested membrane potential, and error bars represent the SEM of n=3 recordings. f, MD simulations conducted at +70 mV (orange), 0 mV (green), and −70 mV (blue). Shown here are pairwise population densities of hydrogen bonding interactions between memantine and the Asn-ring residues. Note that density at the hydrogen bonding distance (asterisks) is observed only for GluN2B-Asn615-memantine and at different heights depending on voltages (arrows).
Figure 5.
Figure 5.. MD simulations of the Thr-ring in the presence and absence of channel blockers.
a, Distance analysis of GluN1a-Thr648 (side chain)-Val644 (main chain carbonyl oxygen) or GluN2B-Thr647 (side chain)-L643 (main chain carbonyl oxygen) from the MD simulations of the agonist-bound GluN1a-2B NMDAR (30 × 100 ns) show two populations, peak 1 and 2 at 2 and 3.5 Å, respectively, in all four subunits (chain A-D). b, Associated representative poses of Peak1 and 2 showing hydrogen bonded (H-bond, dashed lines, left panels) and no hydrogen bonded (No H-bond; right panels) threonine residues, respectively, for GluN1a (upper panels) and GluN2B (lower panels). Arrows are placed at the H-bonds or equivalent sites. c-e, The same distance analysis for the PCP-bound (c), the memantine-bound (d), and the S-(+)-ketamine-bound (e) structures. All probability distributions consist of 100 bins, with 10 frames per nanosecond of simulation time.
Figure 6.
Figure 6.. Effects of interacting residues on association and dissociation kinetics of channel blockers.
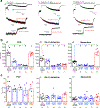
a, Whole-cell patch-clamp recording on HEK293 cells transfected with GluN1a-GluN2B NMDAR. Cells were held at −80 mV and exposed to 100 μM glutamate and glycine. The indicated channel blockers were applied during the steady-state current for 10 s before washout. On and off kinetics were estimated by fitting data to an exponential (red curves). b-c, Kinetic analysis of blocker binding site mutants for dissociation (B; off) and association (C; on). Error bars represent the average tau ± SEM and dots represent the tau measurements from each cell (n = 4–11 unique cells per mutant, indicated below each graph). Pair-wise comparison shows off rates but not on-speeds are mainly affected (One-way ANOVA, DF=4. Asterisks indicate p < 0.05 determined by two-tail t test with Bonferroni correction between wildtype and mutant channels. The p-values for panel b are: PCP, N615Q=1.85363E-6, L643A=2.3805E-8, T646S=9.04006E-10. (S)-(+)-ketamine, N615Q=0.01392, L643A=9.57094E-11, T646S=1.01169E-9, V644A=4.88839E-9. Memantine, N615Q=5.55779E-4, L643A=8.33691E-5, T646S=1.15855E-5, V644A=1.39864E-13.).
Figure 7.
Figure 7.. Molecular elements involved in channel blockade.
In the absence of compounds, the Thr-ring residues exist in configurations where they are hydrogen bonded with the main chain carbonyl oxygen (H-bond) or in the non-hydrogen bonded forms. Channel blockers tested here bind to residues in the hydrophobic-ring, favor the H-bond formation between the Thr-ring hydroxyl group and the hydrophobic-ring residue backbone carbonyl oxygens, and interact with the methyl group of threonine residues via hydrophobic interactions; thereby interacting both with the pore and the gate.

References

    1. Mayer ML, Westbrook GL & Guthrie PB Voltage-dependent block by Mg2+ of NMDA responses in spinal cord neurones. Nature 309, 261–263 (1984). - PubMed
    1. Nowak L, Bregestovski P, Ascher P, Herbet A & Prochiantz A Magnesium gates glutamate-activated channels in mouse central neurones. Nature 307, 462–465, doi:10.1038/307462a0 (1984). - DOI - PubMed
    1. Mayer ML, MacDermott AB, Westbrook GL, Smith SJ & Barker JL Agonist- and voltage-gated calcium entry in cultured mouse spinal cord neurons under voltage clamp measured using arsenazo III. The Journal of neuroscience : the official journal of the Society for Neuroscience 7, 3230–3244 (1987). - PMC - PubMed
    1. Nicoll RA & Roche KW Long-term potentiation: peeling the onion. Neuropharmacology 74, 18–22, doi:10.1016/j.neuropharm.2013.02.010 (2013). - DOI - PMC - PubMed
    1. Nabavi S et al. Engineering a memory with LTD and LTP. Nature 511, 348–352, doi:10.1038/nature13294 (2014). - DOI - PMC - PubMed

Publication types

MeSH terms