. 2022 May 30;20(1):76.
doi: 10.1186/s12964-022-00884-6.

Podocyte specific deletion of PKM2 ameliorates LPS-induced podocyte injury through beta-catenin

Affiliations

Podocyte specific deletion of PKM2 ameliorates LPS-induced podocyte injury through beta-catenin

Mohammed Alquraishi et al. Cell Commun Signal. .

Abstract

Background: Acute kidney injury (AKI) is associated with a severe decline in kidney function caused by abnormalities within the podocytes' glomerular matrix. Recently, AKI has been linked to alterations in glycolysis and the activity of glycolytic enzymes, including pyruvate kinase M2 (PKM2). However, the contribution of this enzyme to AKI remains largely unexplored.

Methods: Cre-loxP technology was used to examine the effects of PKM2 specific deletion in podocytes on the activation status of key signaling pathways involved in the pathophysiology of AKI by lipopolysaccharides (LPS). In addition, we used lentiviral shRNA to generate murine podocytes deficient in PKM2 and investigated the molecular mechanisms mediating PKM2 actions in vitro.

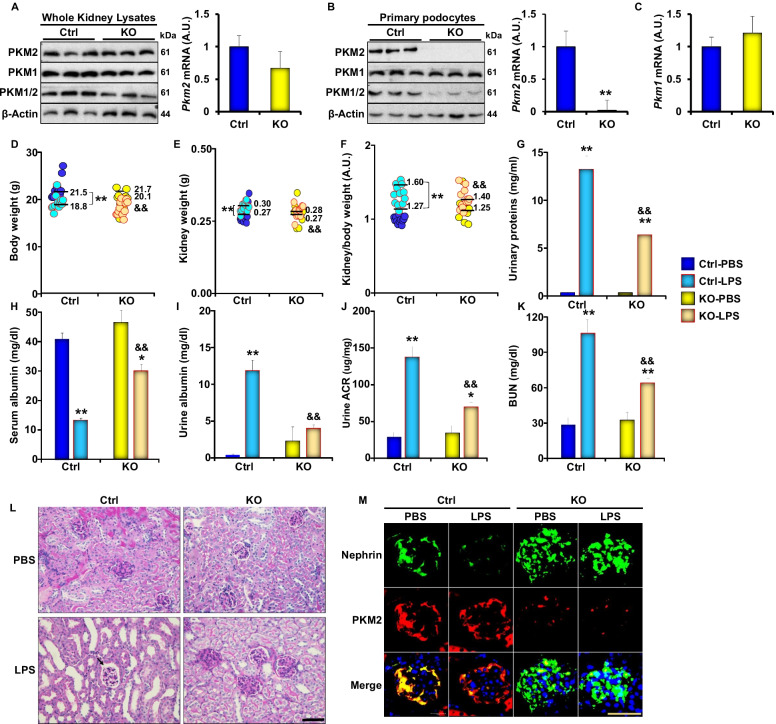
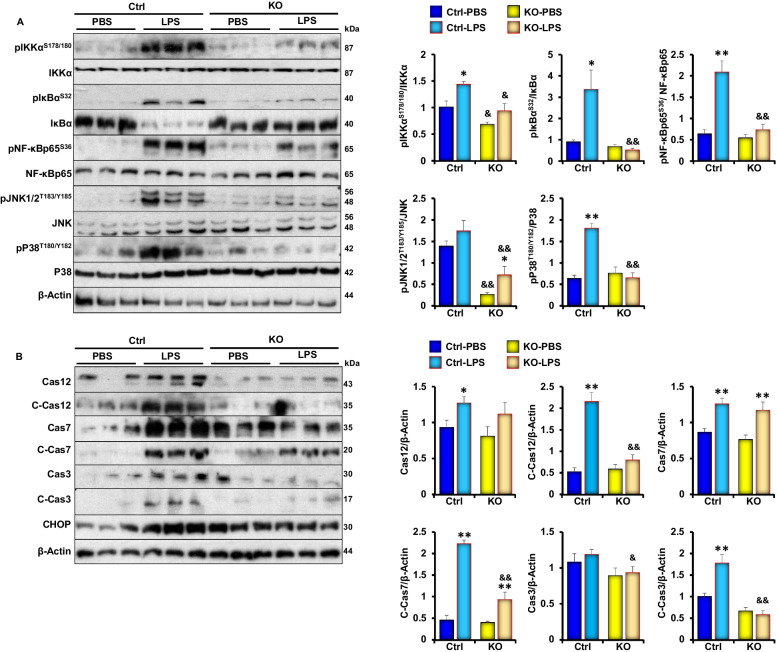
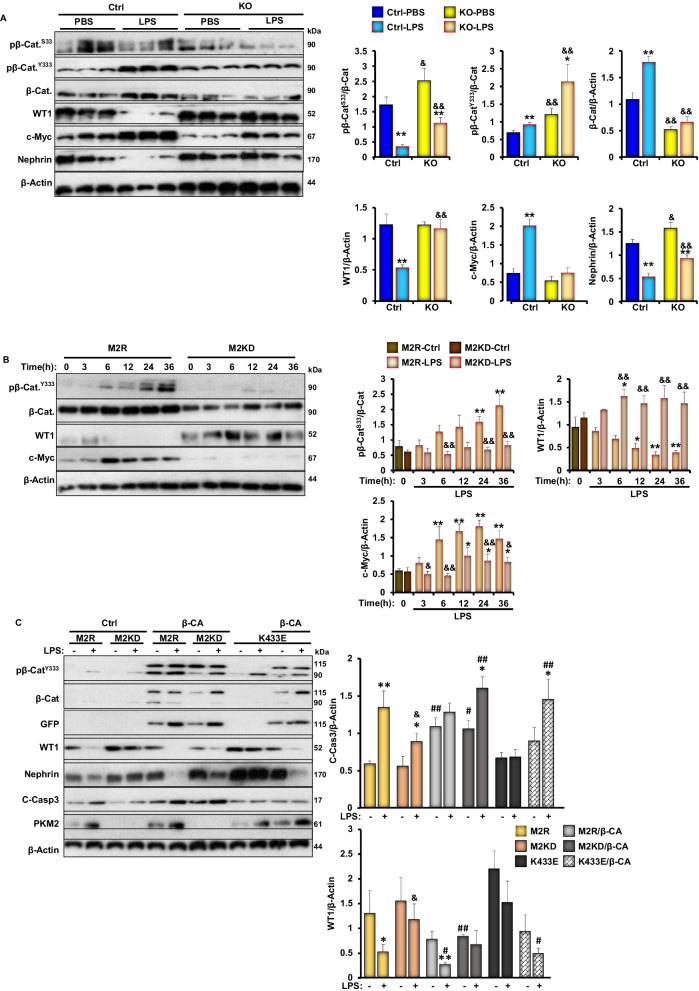
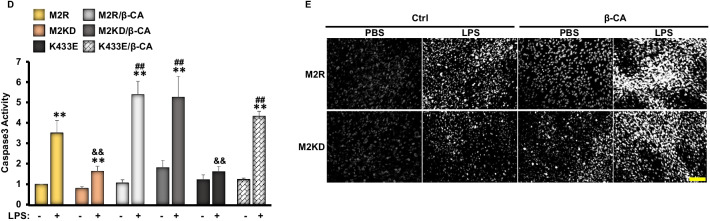
Results: Specific PKM2 deletion in podocytes ameliorated LPS-induced protein excretion and alleviated LPS-induced alterations in blood urea nitrogen and serum albumin levels. In addition, PKM2 deletion in podocytes alleviated LPS-induced structural and morphological alterations to the tubules and to the brush borders. At the molecular level, PKM2 deficiency in podocytes suppressed LPS-induced inflammation and apoptosis. In vitro, PKM2 knockdown in murine podocytes diminished LPS-induced apoptosis. These effects were concomitant with a reduction in LPS-induced activation of β-catenin and the loss of Wilms' Tumor 1 (WT1) and nephrin. Notably, the overexpression of a constitutively active mutant of β-catenin abolished the protective effect of PKM2 knockdown. Conversely, PKM2 knockdown cells reconstituted with the phosphotyrosine binding-deficient PKM2 mutant (K433E) recapitulated the effect of PKM2 depletion on LPS-induced apoptosis, β-catenin activation, and reduction in WT1 expression.

Conclusions: Taken together, our data demonstrates that PKM2 plays a key role in podocyte injury and suggests that targetting PKM2 in podocytes could serve as a promising therapeutic strategy for AKI.

Trial registration: Not applicable. Video abstract.

Keywords: Podocyte; Proteinuria; Pyruvate kinase M2; β-Catenin.


Conflict of interest statement

The authors declare that there is no conflict of interest regarding the publication of this article.

Figures

Fig. 1
Fig. 1
LPS increases PKM2 phosphorylation and expression levels in renal tissue and cultured podocytes. Representative immunoblots of pPKM2Y105, pPKM2S37, PKM2, PKM1, PKM1/2, nephrin, and β-Actin as a loading control in A total kidney lysates harvested from C57bl6/J wild type mice 24 h after PBS or LPS injection (n = 6/group) and B primary podocytes isolated from C57bl6/J wild type mice 24 h after PBS or LPS injection (n = 12; 4 animals/lane). C Representative immunoblots (left panel) of pPKM2Y105, pPKM2S37, PKM2, PKM1, PKM1/2, nephrin, and β-Actin in cultured murine E11 podocytes in response to PBS or LPS treatment for the indicated duration. Bar graphs (right panel) displays changes in PKM2 and nephrin levels normalized to β-Actin from three independent experiments. *p < 0.05, **p < 0.01 indicate a significant difference between cells treated with LPS and non-treated cells
Fig. 2
Fig. 2
PKM2 podocyte deletion ameliorates LPS induced proteinuria and kidney injury. A Representative immunoblots (left panel) of PKM2, PKM1, PKM1/2, and β-Actin in whole kidney lysates from wild type (Ctrl) and podocyte PKM2 knockout mice (KO). mRNA levels (right panel) of Pkm2 in total kidney lysates of Ctrl and KO mice (n = 6 group). B Representative immunoblots (left panel) of PKM2, PKM1, PKM1/2, and β-Actin in primary podocytes isolated from Ctrl and KO mice. The right panel is the mRNA level of Pkm2 and Pkm1 C in primary podocytes (n = 12; 4 animals/lane). D Body weights, E kidney weights, and F kidney to body weight ratio of wild type (Ctrl) and podocyte PKM2 knockout mice (KO) mice, under PBS and LPS treated states. Assessment of G total urinary proteins levels, H serum albumin levels, I urine albumin levels, J albumin to creatinine ratios (ACR), and K blood urea nitrogen (BUN) levels of Ctrl and KO mice after PBS and LPS injection (n = 6–12 per group). L PAS staining of kidney sections in Ctrl and KO mice under PBS and LPS conditions; the arrow is pointing to the expansion of Bowman space in response to LPS treatment. Scale bar = 50 μM. M Immunofluorescence of Nephrin (green), PKM2 (red), and nuclear DNA using DAPI (blue) in kidney sections obtained from both genotypes injected with PBS or LPS. Scale bar = 50 μM. In D–K, *p < 0.05, **p < 0.01 indicate a significant difference between PBS- and LPS-injected mice. &p < 0.05, &&p < 0.01 indicate a significant difference between Ctrl and KO mice
Fig. 3
Fig. 3
Podocyte specific deletion of PKM2 attenuates LPS-Induced inflammation and apoptosis in Vivo. A Representative immunoblots (left panel) and bar graph quantitative assessment (right panel) of major signal transduction molecules involved in the NF-κB (pIKKαS178/S180, IKKα, pIκBαS32, IκBα, pNF-κBp65S36, NF-κBp65), MAPK (pJNK1/2T183/Y185, JNK, pP38T180/Y182, P38) signaling pathways, and β-Actin as a loading control in whole kidney lysates of control (Ctrl) and podocyte PKM2 knockout mice (KO) mice harvested 24 h after PBS or LPS injection (n ≥ 6/group). *p < 0.05, **p < 0.01 indicate a significant difference between PBS- and LPS-injected mice. &p < 0.05, &&p < 0.01 indicate a significant difference between Ctrl and KO mice. B Representative immunoblots (left panel) and bar graph quantification (right panel) of apoptotic markers: Caspase 12, 7, and 3, their cleaved forms, and CHOP in whole kidney lysates of control (Ctrl) and podocyte PKM2 knockout mice (KO) mice harvested 24 h after PBS or LPS injection (n ≥ 6/group). *p < 0.05, **p < 0.01 indicate a significant difference between PBS- and LPS-injected mice. &p < 0.05, &&p < 0.01 indicate a significant difference between Ctrl and KO mice
Fig. 4
Fig. 4
PKM2 deficiency in cultured E11 podocytes alleviates LPS-induced nephrin loss. A Representative immunoblots (left panel) and bar graph quantitative assessment (right panel) of PKM2, PKM1, and PKM1/2 levels in undifferentiated (day 1; D1) and differentiated (D15) E11 murine podocytes infected with lentivirus particles carrying scramble-shRNA (SCR), shRNA targeting PKM2 (M2KD) or an open reading frame of the human DNA (M2R). β-Actin was used as a loading control. *p < 0.05, **p < 0.01 indicate a significant difference between differentiated and undifferentiated cells. #p < 0.05, ##p < 0.01 indicate a significant difference between the indicated cell and control E11 cells exposed to the same treatment. B Representative immunoblots (left panel) and bar graph quantitative assessment (right panel) of pPKM2Y105, pPKM2S37, PKM2, PKM1, PKM1/2, and Nephrin in differentiated M2R and M2KD podocytes treated with LPS for the indicated durations. β-Actin was used as a loading control. Data is representative of at least three independent experiments. *p < 0.05, **p < 0.01 indicate a significant difference between LPS-treated or non-treated cells. &p < 0.05, &&p < 0.01 indicate a significant difference between M2R and M2KD cells exposed to the same treatment
Fig. 5
Fig. 5
PKM2 deficiency ameliorates LPS-induced inflammation and apoptosis in cultured E11 podocytes. A Representative immunoblots (left panel) and bar graph quantitative assessment (right panel) of pIKKαS178/S180, IKKα, pIκBαS32, IκBα, pNF-κBp65S36, NF-κBp65, pJNK1/2T183/Y185, JNK, pP38T180/Y182, P38, and PKM2 in total cell lysates from differentiated M2R and M2KD podocytes treated with LPS for the indicated durations. β-Actin was used as a loading control. Data is representative of at least three independent experiments. *p < 0.05, **p < 0.01 indicate a significant difference between LPS-treated or non-treated cells. &p < 0.05, &&p < 0.01 indicate a significant difference between M2R and M2KD cells exposed to the same treatment. B Representative immunoblots (left panel) and bar graph quantitative assessment (right panel) of CHOP and cleaved-caspase 3 (C-Cas3) in total cell lysates from differentiated M2R and M2KD podocytes treated with LPS for the indicated durations. β-Actin was used as a loading control. Data is representative of at least three independent experiments. *p < 0.05, **p < 0.01 indicate a significant difference between LPS-treated or non-treated cells. &p < 0.05, &&p < 0.01 indicate a significant difference between M2R and M2KD cells exposed to the same treatment. C Caspase 3 activity in M2R and M2KD cells treated (LPS) or non-treated (Ctrl) with LPS for 24 h. **p < 0.01 indicate a significant difference between LPS-treated or non-treated cells. &&p < 0.01 indicate a significant difference between M2R and M2KD cells exposed to the same treatment. D Representative images of chromatin condensation in Hoechst-stained M2R and M2KD podocytes treated with LPS for 24 h. Scale bar: 100 μm. Images are representative of at least three independent experiments
Fig. 6
Fig. 6
PKM2 depletion suppress LPS-induced-β-catenin activation in kidneys and E11 cultured podocytes. A Representative immunoblots (left panel) and bar graph quantitative assessment (right panel) of pβ-CateninS33, pβ-CateninY333, β-Catenin and its downstream targets (WT1 and c-Myc), and nephrin in total kidney lysates harvested from C57bl6/J wild type mice 24 h after PBS or LPS injection (n ≥ 6/group). β-Actin was used as a loading control. *p < 0.05, **p < 0.01 indicate a significant difference between PBS- and LPS-injected mice. &p < 0.05, &&p < 0.01 indicate a significant difference between Ctrl and KO mice. B Representative immunoblots (left panel) and bar graph quantitative assessment (right panel) of pβ-CateninY33, β-Catenin, WT1, and c-Myc in total cell lysates from differentiated M2R and M2KD podocytes treated with LPS for the indicated durations. β-Actin was used as a loading control. Data is representative of at least three independent experiments. *p < 0.05, **p < 0.01 indicate a significant difference between LPS-treated or non-treated cells. &p < 0.05, &&p < 0.01 indicate a significant difference between M2R and M2KD cells exposed to the same treatment. C Representative immunoblots (left panel) and bar graph quantitative assessment (right panel) of pβ-CateninY333, β-Catenin, GFP, WT1, nephrin, C-Caspase 3, and PKM2 in in total cell lysates from LPS treated or non-treated M2R, M2KD transfected with empty pCS2 + vector (Ctrl), pCS2 plasmid expressing the constitutively active β-catenin mutant (β-CA), or the pLHCX vector expressing the K433E mutant of PKM2. β-Actin was used as a loading control. Data is representative of at least three independent experiments. *p < 0.05, **p < 0.01 indicate a significant difference between LPS-treated or non-treated cells. &p < 0.05, &&p < 0.01 indicate a significant difference between M2R and M2KD cells exposed to the same treatment. #p < 0.05, ##p < 0.01 indicate a significant difference between the indicated cell overexpressing the constitutively active mutant of β-catenin (β-CA) or the K433E mutant of PKM2 and M2KD cells exposed to the same treatment. D Caspase 3 activity in M2R, M2KD cells in total cell lysates from LPS treated or non-treated M2R, M2KD transfected with empty pCS2 + vector (Ctrl), pCS2 plasmid expressing the constitutively active β-catenin mutant (β-CA) plasmids, or the pLHCX vector expressing the K433E mutant of PKM2. Data is representative of at least three independent experiments. *p < 0.05, **p < 0.01 indicate a significant difference between LPS-treated or non-treated cells. &p < 0.05, &&p < 0.01 indicate a significant difference between M2R and M2KD cells exposed to the same treatment. #p < 0.05, ##p < 0.01 indicate a significant difference between the indicated cell overexpressing the constitutively active mutant of β-catenin (β-CA) or the K433E mutant of PKM2 and M2KD cells exposed to the same treatment. E Representative images of chromatin condensation in Hoechst-stained M2R and M2KD podocytes transfected with empty pCS2 + vector (Ctrl) or a pCS2 plasmid expressing the constitutively active β-catenin mutant (β-CA). Scale bar: 100 μm. Images are representative of at least three independent experiments
Fig. 6
Fig. 6
PKM2 depletion suppress LPS-induced-β-catenin activation in kidneys and E11 cultured podocytes. A Representative immunoblots (left panel) and bar graph quantitative assessment (right panel) of pβ-CateninS33, pβ-CateninY333, β-Catenin and its downstream targets (WT1 and c-Myc), and nephrin in total kidney lysates harvested from C57bl6/J wild type mice 24 h after PBS or LPS injection (n ≥ 6/group). β-Actin was used as a loading control. *p < 0.05, **p < 0.01 indicate a significant difference between PBS- and LPS-injected mice. &p < 0.05, &&p < 0.01 indicate a significant difference between Ctrl and KO mice. B Representative immunoblots (left panel) and bar graph quantitative assessment (right panel) of pβ-CateninY33, β-Catenin, WT1, and c-Myc in total cell lysates from differentiated M2R and M2KD podocytes treated with LPS for the indicated durations. β-Actin was used as a loading control. Data is representative of at least three independent experiments. *p < 0.05, **p < 0.01 indicate a significant difference between LPS-treated or non-treated cells. &p < 0.05, &&p < 0.01 indicate a significant difference between M2R and M2KD cells exposed to the same treatment. C Representative immunoblots (left panel) and bar graph quantitative assessment (right panel) of pβ-CateninY333, β-Catenin, GFP, WT1, nephrin, C-Caspase 3, and PKM2 in in total cell lysates from LPS treated or non-treated M2R, M2KD transfected with empty pCS2 + vector (Ctrl), pCS2 plasmid expressing the constitutively active β-catenin mutant (β-CA), or the pLHCX vector expressing the K433E mutant of PKM2. β-Actin was used as a loading control. Data is representative of at least three independent experiments. *p < 0.05, **p < 0.01 indicate a significant difference between LPS-treated or non-treated cells. &p < 0.05, &&p < 0.01 indicate a significant difference between M2R and M2KD cells exposed to the same treatment. #p < 0.05, ##p < 0.01 indicate a significant difference between the indicated cell overexpressing the constitutively active mutant of β-catenin (β-CA) or the K433E mutant of PKM2 and M2KD cells exposed to the same treatment. D Caspase 3 activity in M2R, M2KD cells in total cell lysates from LPS treated or non-treated M2R, M2KD transfected with empty pCS2 + vector (Ctrl), pCS2 plasmid expressing the constitutively active β-catenin mutant (β-CA) plasmids, or the pLHCX vector expressing the K433E mutant of PKM2. Data is representative of at least three independent experiments. *p < 0.05, **p < 0.01 indicate a significant difference between LPS-treated or non-treated cells. &p < 0.05, &&p < 0.01 indicate a significant difference between M2R and M2KD cells exposed to the same treatment. #p < 0.05, ##p < 0.01 indicate a significant difference between the indicated cell overexpressing the constitutively active mutant of β-catenin (β-CA) or the K433E mutant of PKM2 and M2KD cells exposed to the same treatment. E Representative images of chromatin condensation in Hoechst-stained M2R and M2KD podocytes transfected with empty pCS2 + vector (Ctrl) or a pCS2 plasmid expressing the constitutively active β-catenin mutant (β-CA). Scale bar: 100 μm. Images are representative of at least three independent experiments

References

    1. Pavkov ME, Harding J, Burrows NR. Trends in hospitalizations for acute kidney injury—United States, 2000–2014. In: MMWR morbidity and mortality weekly report. Centers for Disease Control and Prevention; 2018. p. 289–93. - PMC - PubMed
    1. Chawla LS, Kimmel PL. Acute kidney injury and chronic kidney disease: an integrated clinical syndrome. Kidney Int. 2012;82:516–524. - PubMed
    1. Greka A, Mundel P. Cell biology and pathology of podocytes. Annu Rev Physiol. 2012;74:299–323. - PMC - PubMed
    1. Asanuma K, Yanagida-Asanuma E, Takagi M, Kodama F, Tomino Y. The role of podocytes in proteinuria. Nephrology (Carlton) 2007;12(Suppl 3):S15–20. - PubMed
    1. Garg P. A review of podocyte biology. Am J Nephrol. 2018;47(Suppl 1):3–13. - PubMed

Publication types