. 2022 May 21:2022:9204201.
doi: 10.1155/2022/9204201. eCollection 2022.

Integrated Bioinformatics and Clinical Correlation Analysis of Key Genes, Pathways, and Potential Therapeutic Agents Related to Diabetic Nephropathy

Affiliations

Integrated Bioinformatics and Clinical Correlation Analysis of Key Genes, Pathways, and Potential Therapeutic Agents Related to Diabetic Nephropathy

Shengnan Chen et al. Dis Markers. .

Abstract

Background: Diabetic nephropathy (DN) is a common microvascular complication of diabetes and a major cause of end-stage renal disease, resulting in a substantial socioeconomic burden around the world. Some unknown biomarkers, mechanisms, and potential novel agents regarding DN are yet to be identified.

Methods: GSE30528 and GSE1009 were downloaded as training datasets to identify differentially expressed genes (DEGs) of DN. Common DEGs were selected for further analysis. Gene Ontology and Kyoto Encyclopedia of Genes and Genomes (KEGG) analyses of DEGs were performed to explore molecular mechanisms and pathways. Protein-protein interaction (PPI) network of DEGs was used to identify the top 10 hub genes of DN. Expression profiles of the hub genes were validated in GSE96804 and GSE47183 datasets. The clinical correlation analyses were conducted to confirm the association between key genes and clinical characteristics in the Nephroseq v5 database. The Drug Gene Interaction Database was used to predict potential targeted drugs.

Results: 345 and 1228 DEGs were identified in GSE30528 and GSE1009, respectively; and 120 common DEGs were found. The biological process of DEGs was significantly enriched in kidney development. PI3K-Akt signaling pathway, focal adhesion, complement and coagulation cascades were significantly enriched KEGG pathways. The identified top10 hub genes were VEGFA, NPHS1, WT1, TJP1, CTGF, FYN, SYNPO, PODXL, TNNT2, and BMP2. VEGFA, NPHS1, WT1, CTGF, SYNPO, PODXL, and TNNT2 were significantly downregulated in DN. VEGFA, NPHS1, WT1, CTGF, SYNPO, and PODXL were positively correlated with glomerular filtration rate. The targeted drugs or molecular compounds were enalapril, sildenafil, and fenofibrate target for VEGFA; losartan target for NPHS1; halofuginone, deferoxamine, curcumin, and sirolimus target for WT1; and purpurogallin target for TNNT2.

Conclusions: VEGFA, NPHS1, WT1, CTGF, SYNPO, and PODXL are promising biomarkers for diagnosing and evaluating the progression of DN. The drug-gene interaction analyses provide a list of candidate drugs for the precise treatment of DN.


Conflict of interest statement

The authors declare that there is no conflict of interest regarding the publication of this article.

Figures
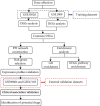
Figure 1
Figure 1
Flowchart of the study. GSE30528 and GSE1009 were defined as training datasets to screen DEGs, and the intersection was taken as common DEGs to perform functional enrichment analysis. The common DEGs were used to construct PPI network and identify the top 10 hub genes of DN. GSE96804 and GSE47183 were defined as external validation datasets to verify the gene expression profiles of the screened hub genes. The clinical correlation analysis and drug-gene interaction analysis were performed to validate the clinical significance and potential targeted drugs of hub genes associated with DN.
Figure 2
Figure 2
Volcano plots of DEGs in the DN group vs. normal control. (a) GSE30528, (b) GSE1009. Each symbol represents a different gene. The black dots represent the genes expressed without significant differences. The red color of the symbols represents upregulated genes, whereas points in green represent downregulated genes.
Figure 3
Figure 3
Common DGEs of GSE30528 and GSE1009. Red represents upregulated genes, green represents downregulated genes, and gray indicates genes changed in the opposite direction between GSE1009 and GSE30528.
Figure 4
Figure 4
GO enrichment analysis of common DEGs. The x-axis label represents the gene ratio (the number of genes enriched in one GO term divided by the total number of genes used for enrichment analysis), and the y-axis label represents GO terms. The color of the node is displayed in a gradient from red to blue according to the ascending order of the adjusted P value.
Figure 5
Figure 5
KEGG pathway enrichment analysis of common DEGs. The x-axis label represents the gene number, and the y-axis label represents signaling pathways. The color of the bar is displayed in a gradient from red to blue according to the ascending order of the adjusted P value.
Figure 6
Figure 6
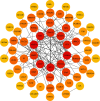
The PPI network of common DEGs and top 10 hub genes of DN. The top 10 hub genes were represented in the central of the network. The color of the nodes reflects the degree of connectivity (red color represents a higher degree, and yellow color represents a lower degree).
Figure 7
Figure 7
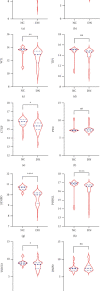
Expression profiles of hub genes in DN compared with NC in the GSE96804 and GSE47183 datasets. The expression level of (a) VEGFA, (b) NPHS1, (c) WT1, (d) TJP1, (e) CTGF, (f) FYN, (g) SYNPO, (h) PODXL, (i) TNNT2, and (j) BMP2. DN: diabetic nephropathy; NC: normal control. ∗∗∗∗P < 0.0001, ∗∗∗P < 0.001, ∗∗P < 0.01, ∗P < 0.05, ns: P > 0.05.
Figure 8
Figure 8
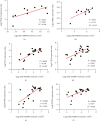
Correlation analysis between the expression of hub genes and renal function. The expression of (a) VEGFA, (b) NPHS1, (c) WT1, (d) CTGF, (e) SYNPO, and (f) PODXL were positively correlated with GFR.
Figure 9
Figure 9
The drug-gene interaction network. The red oval nodes represent the genes, and the blue circle nodes mean the drugs.

Similar articles

Cited by

References

    1. Lei D., Chengcheng L., Xuan Q., et al. Quercetin inhibited mesangial cell proliferation of early diabetic nephropathy through the Hippo pathway. Pharmacological Research . 2019;146, article 104320 doi: 10.1016/j.phrs.2019.104320. - DOI - PubMed
    1. Reutens A. T. Epidemiology of diabetic kidney disease. The Medical Clinics of North America . 2013;97(1):1–18. doi: 10.1016/j.mcna.2012.10.001. - DOI - PubMed
    1. Khan M. A. B., Hashim M. J., King J. K., Govender R. D., Mustafa H., Al Kaabi J. Epidemiology of type 2 diabetes - global burden of disease and forecasted trends. Journal of Epidemiology and Global Health . 2020;10(1):107–111. doi: 10.2991/jegh.k.191028.001. - DOI - PMC - PubMed
    1. Alicic R. Z., Rooney M. T., Tuttle K. R. Diabetic kidney disease: challenges, progress, and possibilities. Clinical Journal of the American Society of Nephrology . 2017;12(12):2032–2045. doi: 10.2215/CJN.11491116. - DOI - PMC - PubMed
    1. Zhang L., Long J., Jiang W., et al. Trends in chronic kidney disease in China. The New England Journal of Medicine . 2016;375(9):905–906. doi: 10.1056/NEJMc1602469. - DOI - PubMed

MeSH terms