. 2022 May 16;2(5):100220.
doi: 10.1016/j.crmeth.2022.100220. eCollection 2022 May 23.

Bimodal endocytic probe for three-dimensional correlative light and electron microscopy

Affiliations

Bimodal endocytic probe for three-dimensional correlative light and electron microscopy

Job Fermie et al. Cell Rep Methods. .

Abstract

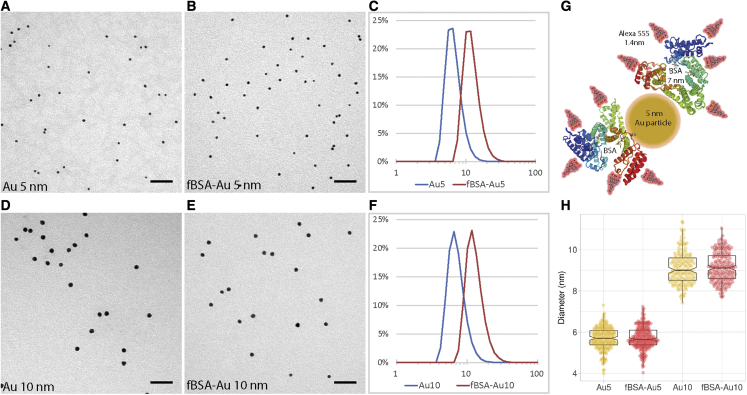
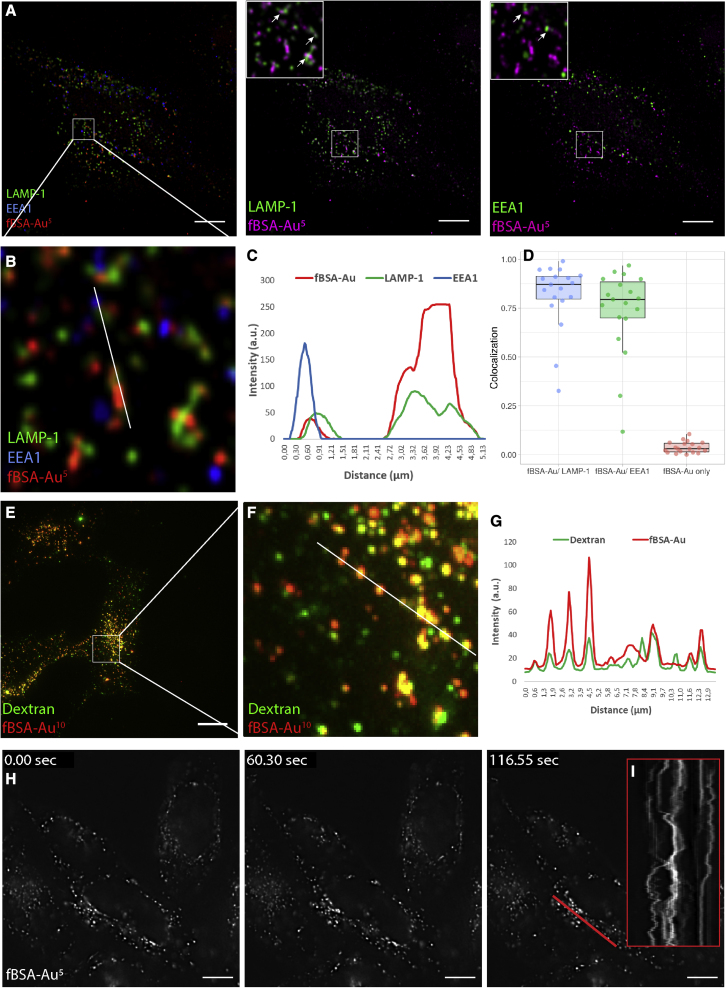
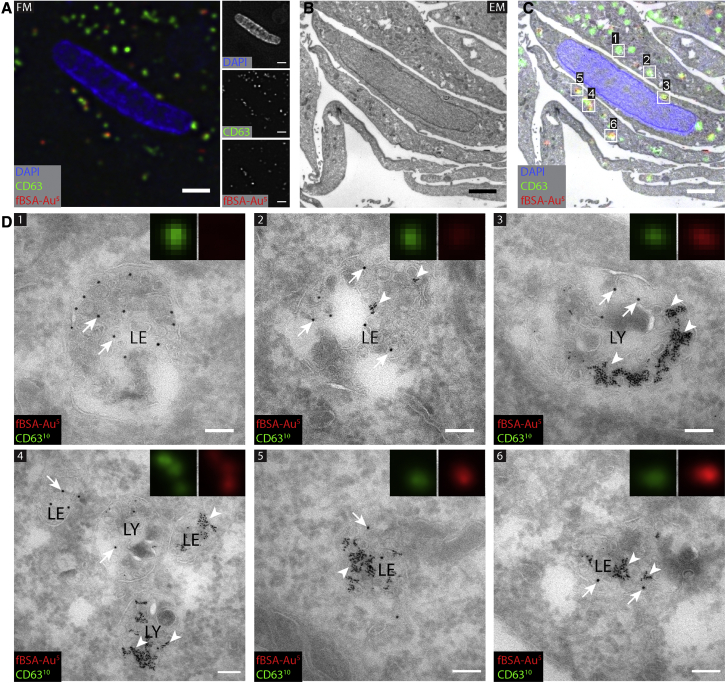
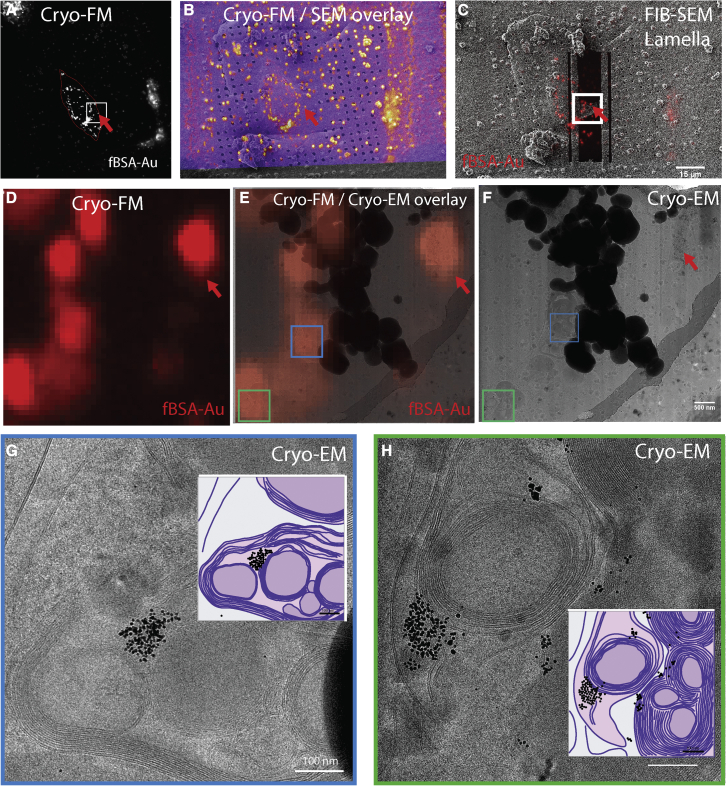
We present a bimodal endocytic tracer, fluorescent BSA-gold (fBSA-Au), as a fiducial marker for 2D and 3D correlative light and electron microscopy (CLEM) applications. fBSA-Au consists of colloidal gold (Au) particles stabilized with fluorescent BSA. The conjugate is efficiently endocytosed and distributed throughout the 3D endolysosomal network of cells and has an excellent visibility in both fluorescence microscopy (FM) and electron microscopy (EM). We demonstrate that fBSA-Au facilitates rapid registration in several 2D and 3D CLEM applications using Tokuyasu cryosections, resin-embedded material, and cryoelectron microscopy (cryo-EM). Endocytosed fBSA-Au benefits from a homogeneous 3D distribution throughout the endosomal system within the cell, does not obscure any cellular ultrastructure, and enables accurate (50-150 nm) correlation of fluorescence to EM data. The broad applicability and visibility in both modalities makes fBSA-Au an excellent endocytic fiducial marker for 2D and 3D (cryo)CLEM applications.

Keywords: correlative light and electron microscopy; cryoelectron microscopy; electron tomography; endolysosomal system; nanogold fiducials; volume-electron microscopy.


Conflict of interest statement

The endocytic fBSA-Au5 and fBSA-Au10 fiducials reported here are available in the product listing of Cell Microscopy Core, UMC Utrecht.

Figures

None
Graphical abstract
Figure 1
Figure 1
Characterization of synthesized fBSA-Au conjugates (A and B) Representative TEM micrographs of 5-nm colloidal gold, showing the monodisperse nature of the particles before (A) and after (B) BSA functionalization. (C) DLS measurements showing the size distribution of 5-nm colloidal gold and BSA-Alexa555 functionalized particles. Functionalization causes a shift in size distribution but does not induce larger aggregates. (D and E) Representative TEM micrographs of 10-nm colloidal gold before (D) and after (E) BSA functionalization. (F) DLS measurements showing the size distribution of 10-nm colloidal gold and BSA-Alexa555 functionalized particles. BSA functionalization causes a shifted size distribution but does not induce larger aggregates. (G) Representative schematic showing the relative sizes of BSA (7.1 nm), Alexa 555 (1.4 nm), and Au particles (5 nm). (H) Sizing of Au5 and Au10 particles determined by TEM. Au5 and Au10 are homogeneously sized. Unlike in DLS measurements, the apparent size of the functionalized particles does not increase after BSA functionalization, likely because of the poor visibility of the electron-lucent BSA. Graphs depict mean ± SD Scale bars, 50 nm.
Figure 2
Figure 2
fBSA-Au is a highly fluorescent, efficiently internalized endocytic tracer (A) Fluorescence images of fixed HeLa cells incubated with fBSA-Au5 and immunolabeled for EEA1 and LAMP-1. fBSA-Au5 is visible in EEA1- and LAMP-1-positive compartments; i.e., throughout the endolysosomal system. (B–D) Magnification of the white square in (A) (B), depicted line profile (C), and colocalization analysis (D) show that internalized fBSA-Au5 colocalizes with EEA1 and LAMP-1. (E) Fluorescence images of fixed HeLa cells incubated with fBSA-Au10 and dextran-Alexa 488. (F and G) Magnification (F) and intensity profile (G) over the depicted lane show that fBSA-Au10 is readily endocytosed and largely colocalizes with dextran. (H) Stills from Video S1 of live HeLa cells loaded with fBSA-Au5. fBSA-Au5 has sufficient fluorescence intensity to employ time-lapse experiments with high temporal resolution. (I) Kymograph over the indicated red line shows the x-t scan along the depicted red line. Scale bars, 10 μm.
Figure 3
Figure 3
CLEM of CD63-positive, fBSA-Au-containing compartments in HeLa cells (A) FM image of an ultrathin cryosection. Shown is the region of interest (ROI) with CD63 immunolabeling (Alexa 488 and Au10) and Alexa 555 fluorescence of internalized fBSA-Au5. (B and C) EM of the ROI (B) and overlay of FM and EM images (C), showing high registration accuracy between modalities. (D) High-magnification EM of fBSA-Au5 (arrowheads) containing organelles labeled for CD63 (10-nm gold, arrows). All selected compartments are positive for CD63 (10-nm gold, arrows). Insets: magnification of CD63 and fBSA-Au5 fluorescence of the selected compartments; width of insets, 800 nm. The intensity of fBSA-Au5 Alexa 555 fluorescence corresponds to the number of gold particles per compartment. (1) and (2) show late endosomes (LEs) containing many intraluminal vesicles and no (1) or little (2) fBSA-Au5 label. (3) shows a lysosome (LY) with clusters of fBSA-Au5 gold particles. (4) shows several LEs and LYs containing varying levels of fBSA-Au5. (5) and (6) show LEs heavily loaded with fBSA-Au5 correlating with intense red fluorescence. Scale bars, 2 μm (A–C) and 100 nm (D).
Figure 4
Figure 4
3D CLEM of 350 nm cryosections using ET HeLa cells were incubated with fBSA-Au5 fiducials (3 h) and immunogold labeled for LAMP-1 (10-nm gold). (A) FM image of a 350-nm-thick cryosection with the selected ROI for ET highlighted by the white box. Insets show separate channels for the used fluorophores. (B) EM of the same region shown in (A). At this magnification, clusters of endocytosed fBSA-Au5 gold particles are visible, allowing rapid correlation from FM to EM. The ROI selected for ET is shown in the white box. (C) Magnified crop from (A), showing the ROI selected for ET. Numbers refer to the same spots as shown in (E) and (F). (D) Magnification of the ROI with the fluorescence information overlaid. fBSA-Au5 fluorescence strictly corresponds to fBSA-Au5 gold particles. (E) Virtual slice from the tomogram, highlighting selected organelles. (F) Magnification of selected organelles. (1) shows LEs and LYs with large amounts of fBSA-Au5 gold particles (white arrows) and minimal LAMP-1 labeling (white arrowheads). (2) shows a LAMP-1-labeled LY devoid of endocytosed fBSA-Au5. This slice is from the surface of the section, showing LAMP-1 representing gold particles that do not penetrate the section. (3) shows LAMP-1-labeled LY abundantly filled with endocytosed fBSA-Au5 gold. (G) Virtual sections through the LY shown in (1) of (F), showing distribution of gold throughout the compartment. Scale bars: 2 μm (A and B), 500 nm (C–E), 200 nm (F), and 100 nm (G).
Figure 5
Figure 5
fBSA-Au serves as a bimodal endocytic probe for CLEM using pre-embedding fluorescence and resin sections HeLa cells were incubated for 3 h with fBSA-Au5. (A) Schematic of the imaging strategy employed. A fluorescent z stack with 200-nm intervals is collected after fixation but prior to resin embedding. After resin embedding, 250-nm-thick sections were cut for ET. The depth (z plane) bearing the organelles of interest was estimated based on the fluorescent z stack, and the corresponding section was imaged in ET. (B) DIC image of a cell with fluorescence of fBSA-Au5 overlayed in red. (C) Fluorescence signal of fBSA-Au5 shown in (A). The ROI for CLEM is highlighted with a white box. (D) TEM micrograph of a 250-nm-thick section showing the ROIs from (B) and (C). The ROI for ET is indicated by the dashed white box. (E) Fluorescence signal corresponding to the ET ROI with numbered spots of interest. (F) Virtual slice from the tomogram, overlaid with fluorescence data. (G) Virtual slice from the tomogram, showing the 3 selected organelles. (H) Magnified virtual slices of the selected organelles containing fBSA-Au5, visible by the 5-nm gold particles (arrows). Organelles 1 and 2 are late endolysosomes, and organelle 3 is an LE. Scale bars: 10 μm (B and C), 2 μm (D), 500 nm (E–G), and 100 nm (H).
Figure 6
Figure 6
fBSA-Au as a bimodal endocytic probe for cryo-ET (A and B) Cryo-FM (A) and cryo-EM (B) images of neurons grown on EM grids. The red signal in cryo-FM originates from the Alexa 555 groups of fBSA-Au5. Yellow arrows point to less intense fluorescent spots corresponding to small endolysosomal organelles in the thin parts of axons. White arrowheads point to dense clusters of fBSA-Au5 adhering to the laminin-coated grid. (C) Small vesicles in cryo-ETs of DRG neurons containing fBSA-Au5 gold particles. A model for each example is shown below, with the lipid bilayer shown in purple, the vesicle lumen in light pink, and fBSA-Au5 as a black circle. The neuron cytoplasm is shown in gray, and the region outside of the cell is white. (D and E) As in (C) for tubular structures (D) and as in (C) and (D) for an early endosome (E). The lumen of the internal vesicle is shown in light purple. (F) As in (C) and (E) for a multi-vesicular body. (G) As in (F) and (C) for an LE/LY. Scale bars, 10 μm (A and B) and 50 μm (C–G).
Figure 7
Figure 7
fBSA-Au as a fiducial marker for cryo-CLEM (A) Red channel maximum intensity projection of the cryo-FM z stack of the selected U2OS cell. The red signal in cryo-FM originates from the Alexa 555 groups of fBSA-Au5. (B) Green channel cryo-FM image (Dynabeads) overlayed onto the SEM overview. (C) Magnified cryo-FM image of the ROI, showing the organelles bearing fBSA-Au5 selected for lamella preparation. The ROI is also depicted with a white square in (A). (D) Post-milling SEM image of the prepared lamella overlayed with the corresponding individual z stack image of the FM data. (E) Overlay of the cryo-FM signal of fBSA-Au5 in the corresponding organelles in the lamella and cryo-TEM images. (F) Overview cryo-TEM image of the lamella. Organelles imaged with higher resolution are depicted with green and blue squares and are shown in (G) and (H), respectively. (G) A LY bearing fBSA-Au5 in its lumen. (H) Another LY bearing fBSA-Au5. A model for each organelle is shown as an inset, with the lipid bilayer shown in purple, the lumen in light pink, and fBSA-Au5 as black circles. Scale bars: 15 μm (B and D), 500 nm (E and F), and 100 nm (G and H).

References

    1. Arnold J., Mahamid J., Lucic V., de Marco A., Fernandez J.J., Laugks T., Mayer T., Hyman A., Baumeister W., Plitzko J. Site-specific cryo-focused ion beam sample preparation guided by 3D correlative microscopy. Biophys. J. 2016;110:860–869. doi: 10.1016/j.bpj.2015.10.053. - DOI - PMC - PubMed
    1. Beck M., Baumeister W. Cryo-electron tomography: can it reveal the molecular sociology of cells in atomic detail? Trends Cell Biol. 2016:825–837. doi: 10.1016/j.tcb.2016.08.006. - DOI - PubMed
    1. Berger C., Ravelli Raimond B.G., López-Iglesias C., Peters P.J. Endocytosed nanogold fiducials for improved in-situ cryo–electron tomography tilt-series alignment. J. Struct. Biol. 2021;213:107698. doi: 10.1016/j.jsb.2021.107698. - DOI - PubMed
    1. Bishop D., Nikic I., Brinkoetter M., Knecht S., Potz S., Kerschensteiner M., Misgeld T. Near-infrared branding efficiently correlates light and electron microscopy. Nat. Methods. 2011;8:568–570. doi: 10.1038/nmeth.1622. - DOI - PubMed
    1. Bright N.A., Reaves B., Mullock B., Luzio J. Dense core lysosomes can fuse with late endosomes and are re-formed from the resultant hybrid organelles. J. Cell Sci. 1997;110:2027–2040. doi: 10.1242/jcs.110.17.2027. - DOI - PubMed

Publication types

MeSH terms

LinkOut - more resources