. 2023 Mar 1;108(3):772-784.
doi: 10.3324/haematol.2022.280816.

APOLD1 loss causes endothelial dysfunction involving cell junctions, cytoskeletal architecture, and Weibel-Palade bodies, while disrupting hemostasis

Affiliations

APOLD1 loss causes endothelial dysfunction involving cell junctions, cytoskeletal architecture, and Weibel-Palade bodies, while disrupting hemostasis

Simon Stritt et al. Haematologica. .

Abstract

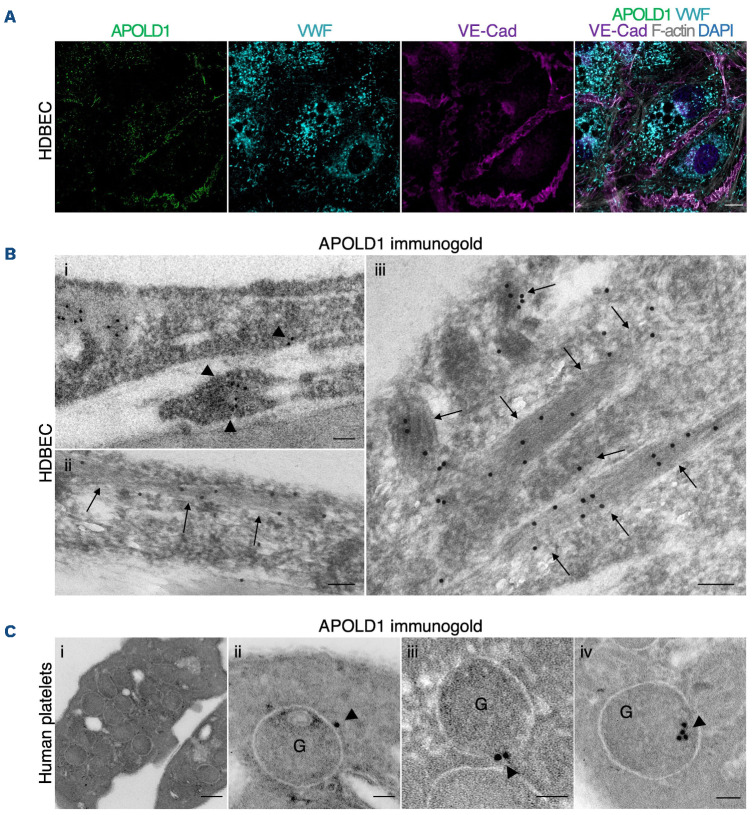
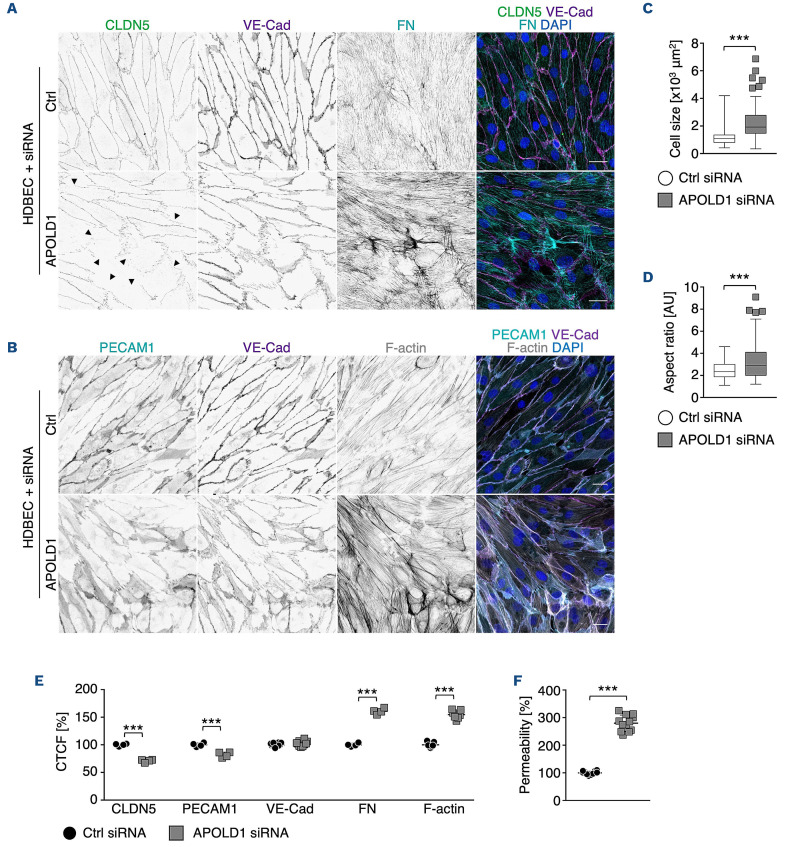
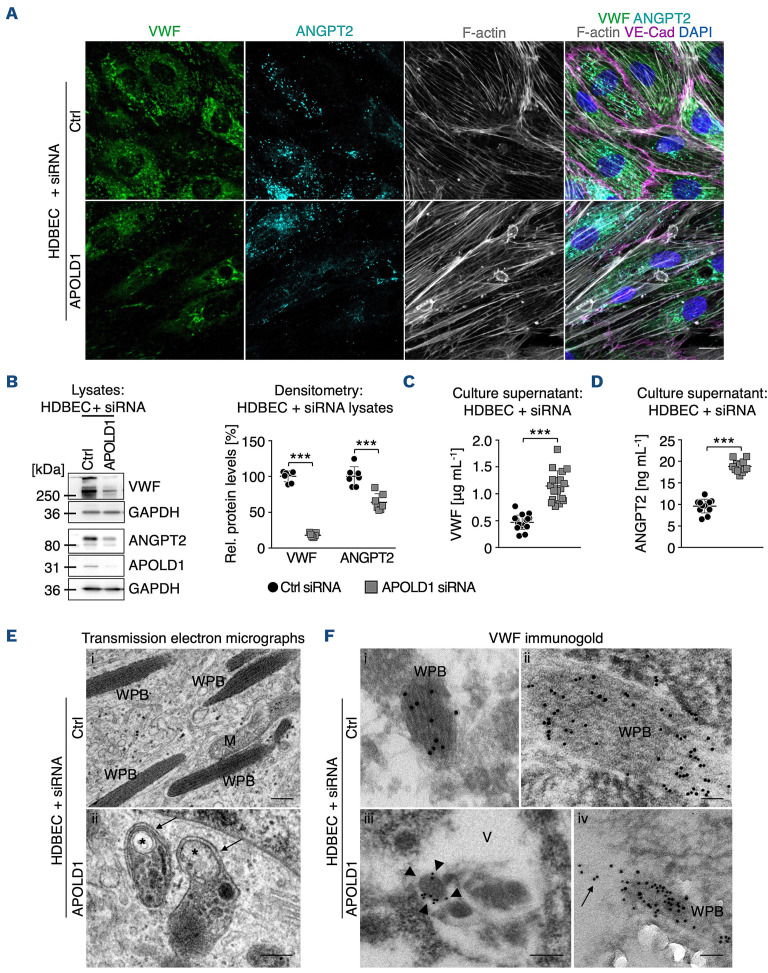
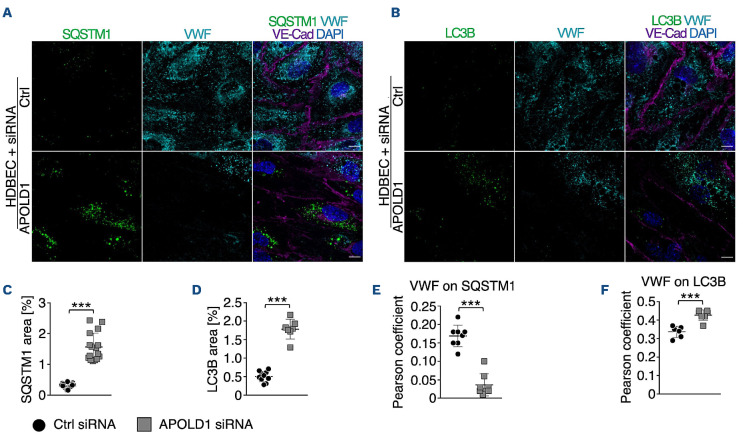
Vascular homeostasis is impaired in various diseases thereby contributing to the progression of their underlying pathologies. The endothelial immediate early gene Apolipoprotein L domain-containing 1 (APOLD1) helps to regulate endothelial function. However, its precise role in endothelial cell biology remains unclear. We have localized APOLD1 to endothelial cell contacts and to Weibel-Palade bodies (WPB) where it associates with von Willebrand factor (VWF) tubules. Silencing of APOLD1 in primary human endothelial cells disrupted the cell junction-cytoskeletal interface, thereby altering endothelial permeability accompanied by spontaneous release of WPB contents. This resulted in an increased presence of WPB cargoes, notably VWF and angiopoietin-2 in the extracellular medium. Autophagy flux, previously recognized as an essential mechanism for the regulated release of WPB, was impaired in the absence of APOLD1. In addition, we report APOLD1 as a candidate gene for a novel inherited bleeding disorder across three generations of a large family in which an atypical bleeding diathesis was associated with episodic impaired microcirculation. A dominant heterozygous nonsense APOLD1:p.R49* variant segregated to affected family members. Compromised vascular integrity resulting from an excess of plasma angiopoietin-2, and locally impaired availability of VWF may explain the unusual clinical profile of APOLD1:p.R49* patients. In summary, our findings identify APOLD1 as an important regulator of vascular homeostasis and raise the need to consider testing of endothelial cell function in patients with inherited bleeding disorders without apparent platelet or coagulation defects.


Figures

Figure 1.
Figure 1.
APOLD1 localizes to endothelial cell-cell junctions and von Willebrand factor storage organelles. (A) Cultured human dermal blood endothelial cells (HDBEC) were immunolabeled for Apolipoprotein L domain-containing 1 (APOLD1; green [processed by super-resolution radial fluctuations]), von Willebrand factor (VWF; cyan), vascular endothelial cadherin (VE-Cad; magenta), F-actin (gray), and nuclei were highlighted with DAPI (blue) and subsequently analyzed by confocal microscopy. Scale bar, 10 mm. (B) Immunogold labeling of adherent HDBEC for APOLD1 and subsequent electron microscopic analysis revealed localization to cell-cell contacts (i, arrowheads) and Weibel-Palade bodies (ii-iii, arrows). Scale bars, 100 nm. Images in (A) and (B) are representative of at least three independent experiments. (C) Immunogold labeling of resting human control platelets reveals APOLD1 localized to the membranes of a-granules (ii-iii) and to have an eccentric localization in the granule lumen, suggesting a possible association with VWF (iv). Of note, APOLD1 was not detected on the platelet surface. Scale bars, 200 nm (i) or 50 nm (ii-iv). Images are representative of one experiment.
Figure 2.
Figure 2.
APOLD1 silencing alters cytoskeletal and junctional organization of human dermal blood endothelial cells. (A, B) APOLD1 silencing in human dermal blood endothelial cells (HDBEC) alters the organization of cell-cell junctions (claudin 5, CLDN5; vascular endothelial cadherin, VE-Cad; platelet-endothelial cell adhesion molecule 1, PECAM1/CD31) as well as cytoskeletal architecture and leads to increased fibronectin (FN) fibrillogenesis. Arrowheads in (A) highlight disrupted/CLDN5-negative junctions. Scale bars, 25 mm. Images are representative of three independent experiments. (C, D) Lack of APOLD1 results in increased HDBEC size and altered shape (aspect ratio = major axis:minor axis). Box plots display first and third quartiles, and whiskers mark minimum and maximum values unless exceeding 1.5 times the interquartile range of at least 150 cells per group from three independent experiments; symbols represent outliers, and the horizontal line denotes the median. (E) Image analysis revealed reduced immunolabeling intensities of the junctional proteins CLDN5 and PECAM1/CD31, alterations of VE-Cad distribution as well as enhanced FN fibrillogenesis and actin stress fiber formation, which is reminiscent of endothelial cell activation leading to increased (F) endothelial permeability (40 kDa dextran-FITC). Data in (E) represent the mean ± standard deviation. Each symbol in (E) represents the average of at least 100 cells from an individual experiment. Pooled data from at least four experiments are displayed. Each symbol in (F) represents one replicate from three independent experiments. Wilcoxon-Mann-Whitney test, ***P<0.001. CTCF: corrected total cell fluorescence.
Figure 3.
Figure 3.
APOLD1 modulates Weibel-Palade body biology. (A-C) APOLD1 silencing results in a loss of the major Weibel-Palade body (WPB) constituent von Willebrand factor (VWF) as well as angiopoietin 2 (ANGPT2) as revealed by (A) immunolabeling and (B) immunoblotting with subsequent densitometric quantification of VWF and ANGPT2 levels relative to GAPDH in total cell lysates of control and APOLD1 siRNA-treated human dermal blood endothelial cells (HDBEC). Scale bars, 25 mm. Images and immunoblots are representative of at least three independent experiments. Each symbol in (B) represents one experiment and horizontal lines denote the mean ± standard deviation (SD). Wilcoxon-Mann-Whitney test, ***P<0.001. (C, D) VWF and ANGPT2 content in the supernatant of control and APOLD1 siRNA-treated HDBEC determined by enzyme-linked immunosorbent assay. Each symbol represents an individual sample and horizontal lines denote mean ± SD. Pooled data from four independent experiments are displayed. Wilcoxon-Mann-Whitney test, ***P<0.001. (E) Electron microscopic images of WPB in control siRNA-treated HDBEC (i) and autophagosomes (asterisks) with a developing isolation membrane (arrows) in APOLD1-silenced HDBEC (ii). M: mitochondria. Scale bars, 200 nm. Electron microscopic images are representative of three independent experiments. (F) Immunogold (5 or 10 nm gold particles) labeling of VWF highlights WPB with the typical striated rod-shaped structure in control cells (i-ii) while in APOLD1-silenced HDBEC (iii-v) VWF labeling was detected in vacuoles containing amorphous material (iii, arrowheads) and into which WPB release their cargoes (arrows in iv). Scale bars, 50 nm (i-ii, iv) or 100 nm (iii). Images are representative of three independent experiments.
Figure 4.
Figure 4.
Increased release of Weibel-Palade bodies likely occurs via dysfunctional autophagy flux. (A-F) Immunolabeling and subsequent image analysis of control or APOLD1 siRNA-treated human dermal blood endothelial cell (HDBEC) monolayers reveals increased expression of autophagy markers (A, C) SQSTM1 and (B, D) LC3B in the absence of APOLD1. Von Willebrand factor (VWF) co-localized to a lesser extent to (A, E) SQSTM1 but showed an increased localization to (B, F) LC3B-positive vesicles upon APOLD1 silencing. Each symbol in (C-F) represents one analyzed (N≥6) image. Horizontal lines represent the mean ± standard deviation. Wilcoxon-Mann-Whitney test, ***P<0.001. Images are representative of at least three independent experiments. Scale bars, 10 mm.
Figure 5.
Figure 5.
Impaired proteolytic processing of von Willebrand factor upon loss of APOLD1. (A) Immunoblotting of lysates from mock and chloroquine-treated (25 mM for 12 h) control or APOLD1 siRNA-treated human dermal blood endothelial cells (HDBEC) with subsequent densitometric quantification of (B) proteolytic VWF processing, (C) SQSTM1 and (D) LC3B I/II expression. Immunoblots are representative of at least three independent experiments. Bar graphs in (B-D) represent the mean ± standard deviation. Two-way analysis of variance followed by the Sidak multiple comparison test, ***P<0.001.
Figure 6.
Figure 6.
APOLD1 is a candidate gene for a bleeding diathesis. (A) Pedigree of the family with a variant in APOLD1. The red filled symbols indicate a bleeding diathesis co-segregating with a nonsense c.145_146delinsTA variant in APOLD1, resulting in a premature stop codon at arginine 49 (R49*). Pedigree members (PM) 7 and 13 only carry the more frequent single base pair substitution c.G146A in APOLD1 (R49Q) which was not associated with a bleeding syndrome. The hashtags indicate patients studied by whole exome sequencing. The other family members have been subjected to Sanger sequencing of APOLD1. Green filled symbols indicate occurrence of impaired microcirculation and yellow filled symbols of drug-associated bleeding. (B) Resting poly-L-lysine immobilized platelets from healthy control and PM4 and PM6 were stained for APOLD1 (magenta), CD41 (cyan) and F-actin (gray). Scale bars, 3 mm. (C) APOLD1 protein expression was analyzed by immunoblotting and densitometric quantification relative to GAPDH of platelet lysates from two unrelated healthy controls as well as PM4 and PM6. The antibody was directed against amino acids 139-192 and only detects full-length APOLD1. Immunoblots are representative of three experiments. Data represent the mean ± standard deviation (SD). (D) Resting platelets from controls or PM4 and PM6 were labeled for CD62 (P-selectin, green; a-granule marker), von Willebrand factor (VWF, magenta; a-granule marker), and CD63 (granulophysin, cyan; δ-granule/lysosome marker). F-actin is highlighted in gray. Scale bars, 3 mm. (E, F) Quantification of CD62P-, VWF- and CD63-positive granules per platelet from healthy controls, PM4 and PM6. Box plots display first and third quartiles, and whiskers mark minimum and maximum values unless exceeding 1.5 times the interquartile range of at least 100 cells per group; symbols represent outliers, and the horizontal line denotes the median. Results were analyzed by one-way analysis of variance followed by the Dunnett multiple comparisons test, ***P<0.001.

Comment in

References

    1. Hu X, De Silva TM, Chen J, Faraci FM. Cerebral vascular disease and neurovascular injury in ischemic stroke. Circ Res. 2017;120(3):449-471. - PMC - PubMed
    1. Murakami M, Simons M. Regulation of vascular integrity. J Mol Med. 2009;87(6):571-582. - PMC - PubMed
    1. Bogatcheva NV, Garcia JGN, Verin AD. Molecular mechanisms of thrombin-induced endothelial cell permeability. Biochemistry (Mosc). 2002;67(1):75-84. - PubMed
    1. Hakanpaa L, Sipila T, Leppanen V-M, et al. . Endothelial destabilization by angiopoietin-2 via integrin β1 activation. Nat Commun. 2015;6:5962. - PMC - PubMed
    1. Starke RD, Paschalaki KE, Dyer CEF, et al. . Cellular and molecular basis of von Willebrand disease: studies on blood outgrowth endothelial cells. Blood. 2013;121(14):2773-2784. - PMC - PubMed

Publication types