. 2022 Jun 28;7(3):e0023222.
doi: 10.1128/msystems.00232-22. Epub 2022 May 31.

Secondary Metabolism Gene Clusters Exhibit Increasingly Dynamic and Differential Expression during Asexual Growth, Conidiation, and Sexual Development in Neurospora crassa

Affiliations

Secondary Metabolism Gene Clusters Exhibit Increasingly Dynamic and Differential Expression during Asexual Growth, Conidiation, and Sexual Development in Neurospora crassa

Zheng Wang et al. mSystems. .

Abstract

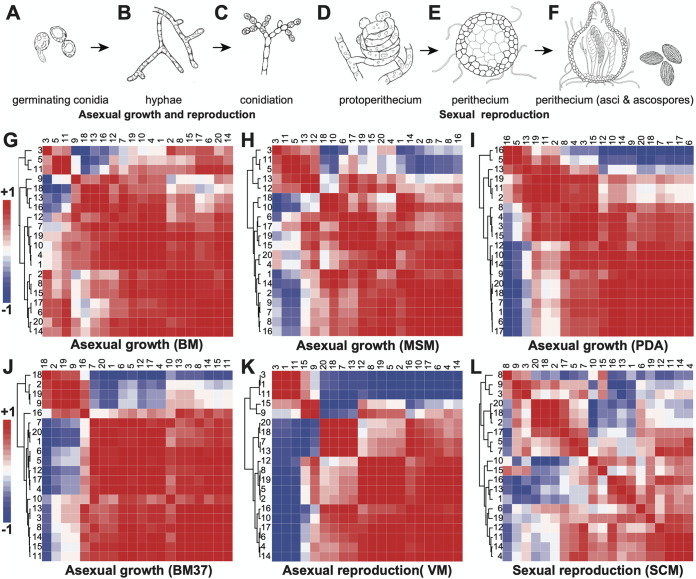
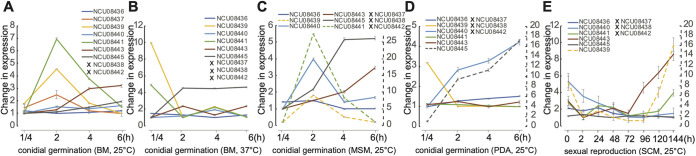
Secondary metabolite clusters (SMCs) encode the machinery for fungal toxin production. However, understanding their function and analyzing their products requires investigation of the developmental and environmental conditions in which they are expressed. Gene expression is often restricted to specific and unexamined stages of the life cycle. Therefore, we applied comparative genomics analyses to identify SMCs in Neurospora crassa and analyzed extensive transcriptomic data spanning nine independent experiments from diverse developmental and environmental conditions to reveal their life cycle-specific gene expression patterns. We reported 20 SMCs comprising 177 genes-a manageable set for investigation of the roles of SMCs across the life cycle of the fungal model N. crassa-as well as gene sets coordinately expressed in 18 predicted SMCs during asexual and sexual growth under three nutritional and two temperature conditions. Divergent activity of SMCs between asexual and sexual development was reported. Of 126 SMC genes that we examined for knockout phenotypes, al-2 and al-3 exhibited phenotypes in asexual growth and conidiation, whereas os-5, poi-2, and pmd-1 exhibited phenotypes in sexual development. SMCs with annotated function in mating and crossing were actively regulated during the switch between asexual and sexual growth. Our discoveries call for attention to roles that SMCs may play in the regulatory switches controlling mode of development, as well as the ecological associations of those developmental stages that may influence expression of SMCs. IMPORTANCE Secondary metabolites (SMs) are low-molecular-weight compounds that often mediate interactions between fungi and their environments. Fungi enriched with SMs are of significant research interest to agriculture and medicine, especially from the aspects of pathogen ecology and environmental epidemiology. However, SM clusters (SMCs) that have been predicted by comparative genomics alone have typically been poorly defined and insufficiently functionally annotated. Therefore, we have investigated coordinate expression in SMCs in the model system N. crassa, and our results suggest that SMCs respond to environmental signals and to stress that are associated with development. This study examined SMC regulation at the level of RNA to integrate observations and knowledge of these genes in various growth and development conditions, supporting combining comparative genomics and inclusive transcriptomics to improve computational annotation of SMCs. Our findings call for detailed study of the function of SMCs during the asexual-sexual switch, a key, often-overlooked developmental stage.

Keywords: Neurospora crassa; asexual development; environmental microbiology; filamentous fungi; gene cluster; secondary metabolism; sexual development; transcriptomics.


Conflict of interest statement

The authors declare no conflict of interest.

Figures

FIG 1
FIG 1
Morphology and transcriptomics for developmental stages of Neurospora crassa. (A to F) Morphologies depicted are (A) germinating conidia, (B) initial hyphal growth, (C) asexual sporulation, (D) initiation of sexual development in protoperithecia, (E) development of perithecia, and (F) sexual sporulation. (G to L) Hierarchically clustered heatmaps of correlation coefficient based on average fold change of gene expression (red, positive; blue, negative) within enumerated secondary metabolic clusters (Table 1) during asexual growth on (G) Bird medium (BM) at 25°C, (H) maple sap medium (MSM) at 25°C, (I) potato dextrose agar medium (PDA) at 25°C, and (J) Bird medium at 37°C; during conidiation on (K) Vogel’s medium (VM) at 25°C (from Sun et al. [84]) and during sexual sporulation on (L) synthetic crossing medium (SCM) at 25°C (from Wang et al. [63]).
FIG 2
FIG 2
LOX expression profiles for selected secondary metabolic clusters (SMCs) no. 1, no. 8, no. 9, no. 13, and no. 20 during key stages of asexual growth (germination of conidia to the first hyphal branching on Bird medium (BM), maple sap medium (MSM), and potato dextrose agar medium (PDA) at 25°C and on Bird medium at 37°C; Table S1). (A to T) Expression profiles for genes in (A to D) SMC no. 1, (E to H) SMC no. 8, (I to L) SMC no. 9, (M to P) SMC no. 13, and (Q to T) SMC no. 20. Profiles for each gene are color-coded. Expression levels of some genes (dashed lines) are quantified by the secondary right-hand dashed y axis. Whiskers represent 95% credible intervals.
FIG 3
FIG 3
Expression profiles exhibited similarly highly coordinated expression among genes for three SMCs during conidiation on Vogel’s medium (see also Table S1). (A to C) Expression profiles relative to time points 0, 12, and 24 h of culture on Vogel’s medium for (A) SMC no. 10, (B) SMC no. 16, and (C) SMC no. 18. Line plots are color-coded by gene. Expression levels of some genes (dashed lines) are quantified by the secondary right-hand dashed y axis tick labels. Whiskers indicate 95% credible intervals.
FIG 4
FIG 4
Expression profiles for SMC no. 5 during asexual growth and sexual reproduction of Neurospora crassa. (A to E) N. crassa was cultured and gene expression measured on (A) Bird medium at 25°C, (B) Bird medium at 37°C, (C) maple sap medium at 25°C, (D) PDA medium at 25°C, and (E) synthetic complete medium (SCM) at 25°C across eight stages of sexual reproduction from protoperithecia: 2 h after crossing and 24, 48, 72, 96, 120, and 144 h of perithecial development toward the maturation of ascospores (63). Line plots are color-coded by gene. Expression levels of some genes (dashed lines) are quantified by the secondary right-hand dashed y axis tick labels. Whiskers indicate 95% credible intervals. Genes with no detectable expression during the sampled processes are designated by a bold X in the legend.
FIG 5
FIG 5
Expression profiles for selected secondary metabolic clusters (SMCs) during Neurospora crassa sexual reproduction cultured at 25°C on synthetic complete medium (SCM; Table S1). (A to D) Expression profiles for genes in (A) SMC no. 2, (B) SMC no. 3, (C) SMC no. 18, and (D) SMC no. 20. N. crassa was sampled at eight stages of sexual reproduction from protoperithecia, 2 h after crossing, and 24, 48, 72, 96, 120, and 144 h of perithecial development toward the maturation of ascospores (63). Line plots are color-coded by gene. Expression levels of some genes (dashed lines) are quantified by the secondary right-hand dashed y axis tick labels. Whiskers indicate 95% credible intervals.
FIG 6
FIG 6
Expression estimates and 95% confidence intervals of genes at four stages of Neurospora crassa conidial germination on Bird medium at 37°C: fresh spores, polar growth, germ tube extension, and first hyphal branching. (A to C) Expression of genes in (A) SMC no. 14, (B) SMC no. 17, and (C) SMC no. 18. The secondary right-hand dashed y axis tick labels quantify expression of neighboring genes NCU12021 and -12022, which exhibited much larger changes across conidial germination than the other genes in the cluster. Line plots are color-coded by gene. Expression levels of some genes (dashed lines) are quantified by the secondary right-hand dashed y axis tick labels. Whiskers indicate 95% credible intervals.
FIG 7
FIG 7
Normal and knockout phenotypes of some SMC genes. (A) Normal sexual development of wild-type strains (FGSC2489 mat A × FGSC1400 mat a) on SCM featured orange-colored conidia and dark-colored perithecia along the crossing line. (B) Knockout mutants (FGSC1638 mat A × FGSC18203 mat a) of os-5 exhibited no sexual development on SCM. (C) Knockout mutants (FGSC17611 mat A × FGSC799 mat a) of al-2 on SCM featured white hyphae and conidia.

References

    1. Hawksworth DL. 2001. The magnitude of fungal diversity: the 1.5 million species estimate revisited. Mycol Res 105:1422–1432. doi:10.1017/S0953756201004725. - DOI
    1. Hawksworth DL, Lücking R. 2017. Fungal diversity revisited: 2.2 to 3.8 million species. Microbiol Spectr 5:1422–1432. doi:10.1128/microbiolspec.FUNK-0052-2016. - DOI - PMC - PubMed
    1. Blackwell M. 2011. The fungi: 1, 2, 3 … 5.1 million species? Am J Bot 98:426–438. doi:10.3732/ajb.1000298. - DOI - PubMed
    1. Stajich JE, Berbee ML, Blackwell M, Hibbett DS, James TY, Spatafora JW, Taylor JW. 2009. The Fungi. Curr Biol 19:R840–R845. doi:10.1016/j.cub.2009.07.004. - DOI - PMC - PubMed
    1. Keller N, Palmer J, Bayram O. 2017. Fungal jewels: secondary metabolites. Frontiers Media, SA.

Publication types

MeSH terms