. 2022 May 31:11:e78182.
doi: 10.7554/eLife.78182.

Syntaxin-1A modulates vesicle fusion in mammalian neurons via juxtamembrane domain dependent palmitoylation of its transmembrane domain

Affiliations

Syntaxin-1A modulates vesicle fusion in mammalian neurons via juxtamembrane domain dependent palmitoylation of its transmembrane domain

Gülçin Vardar et al. Elife. .

Abstract

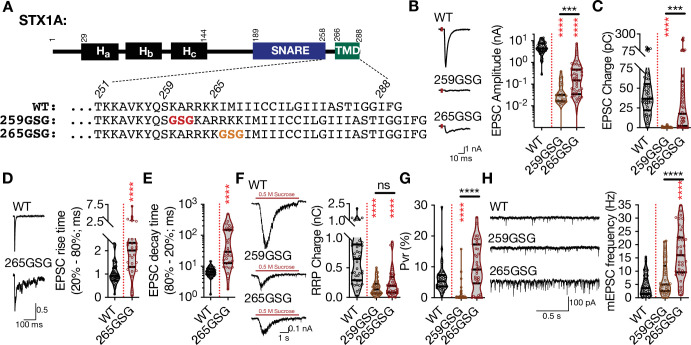
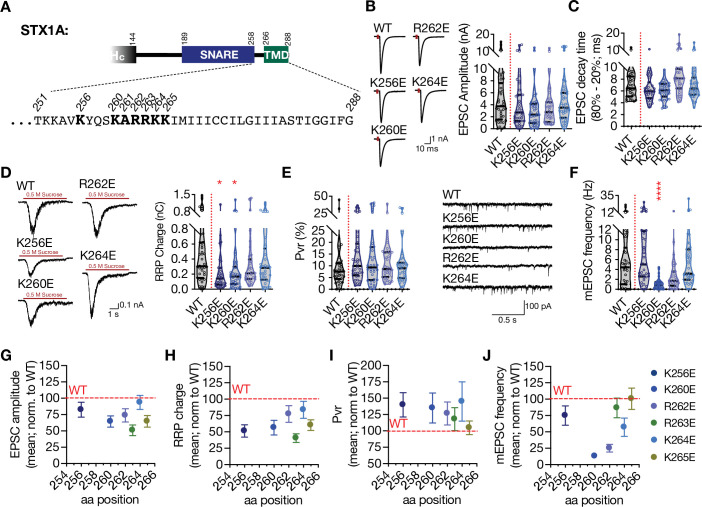
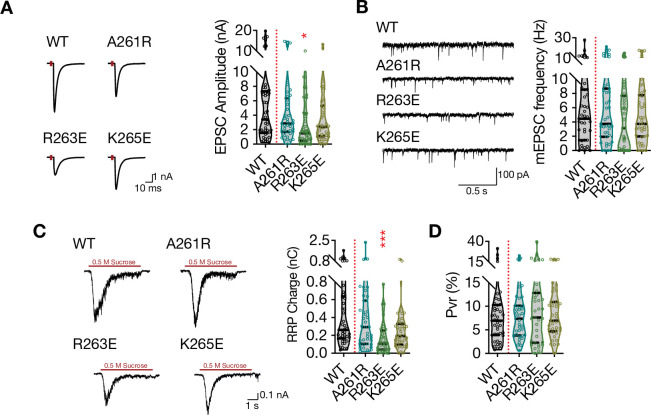
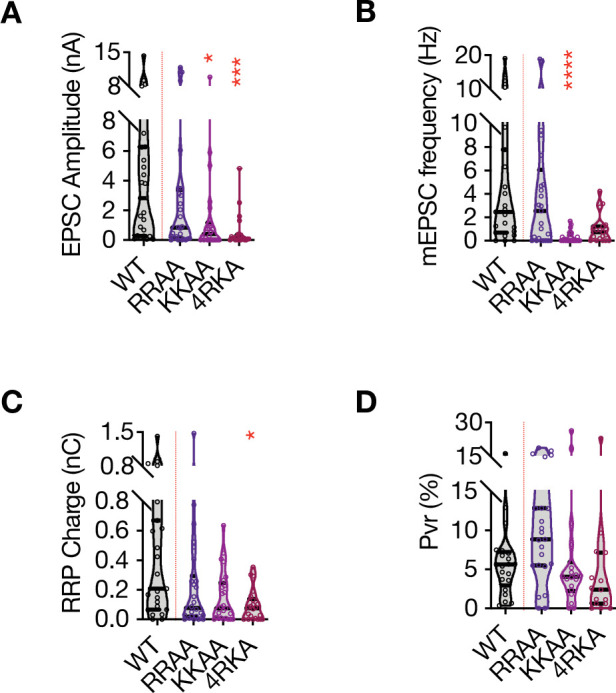
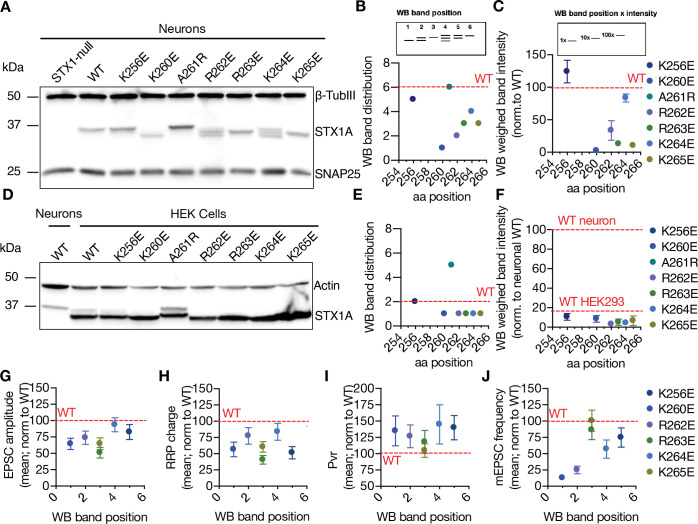
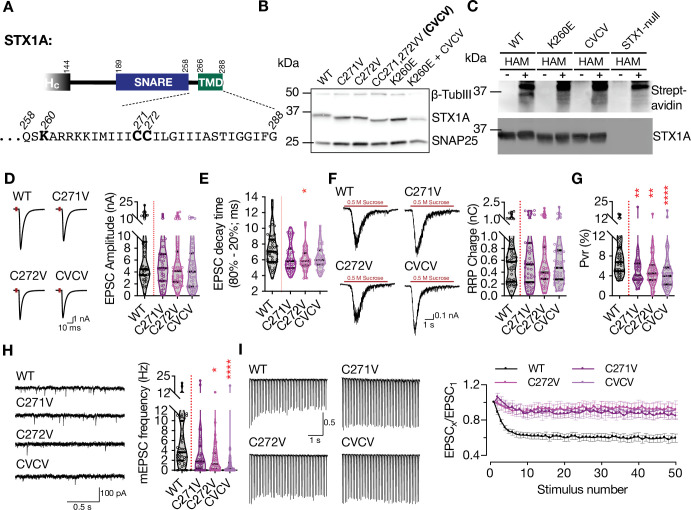
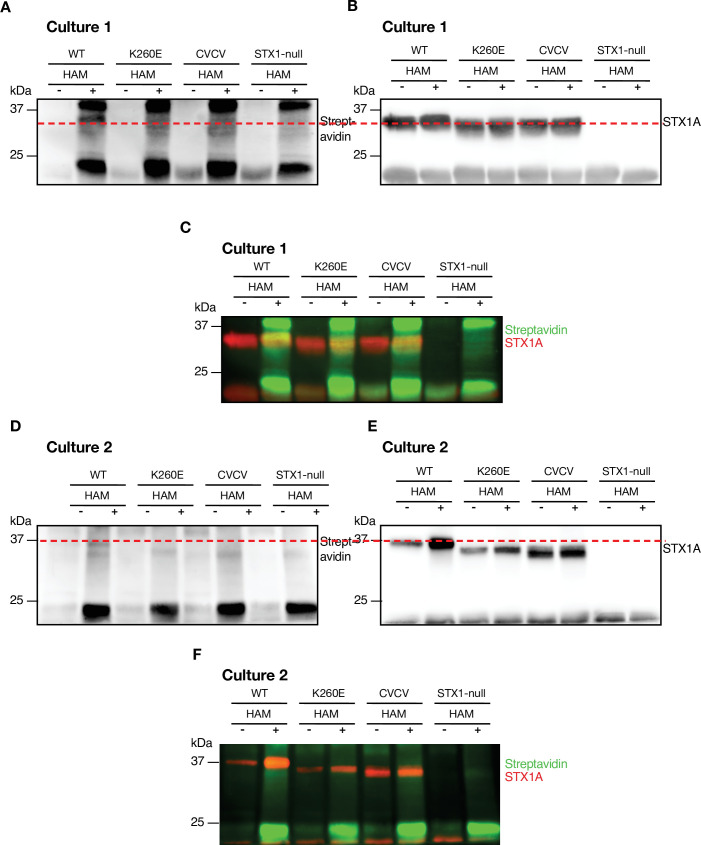
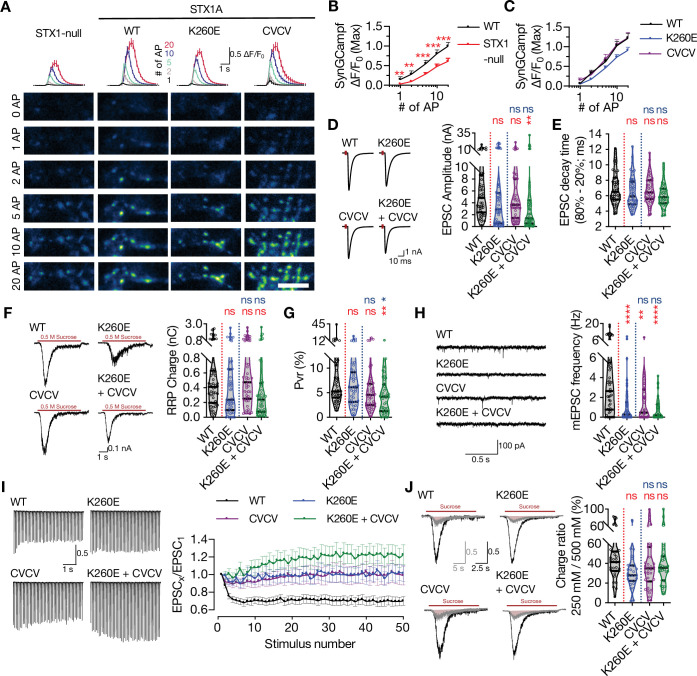
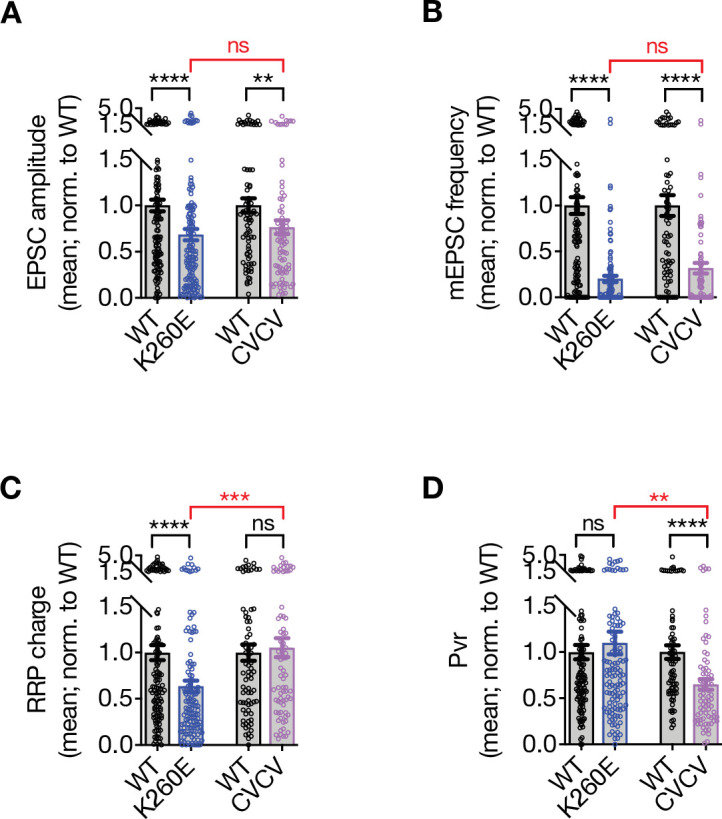
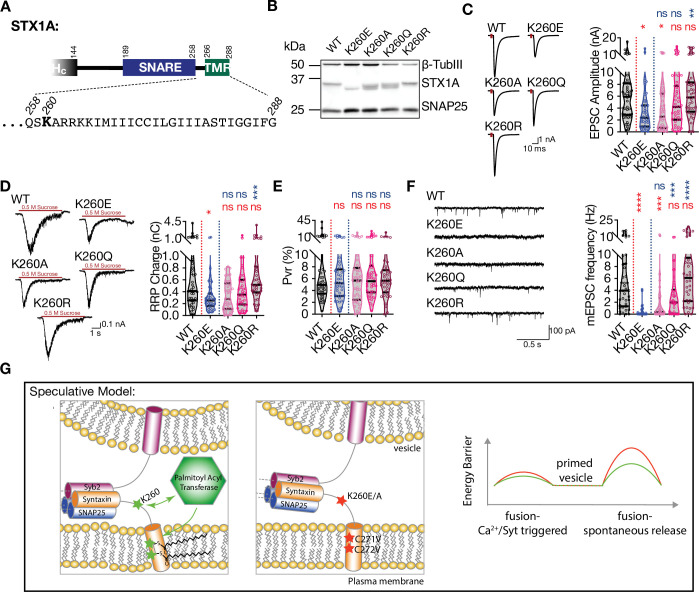
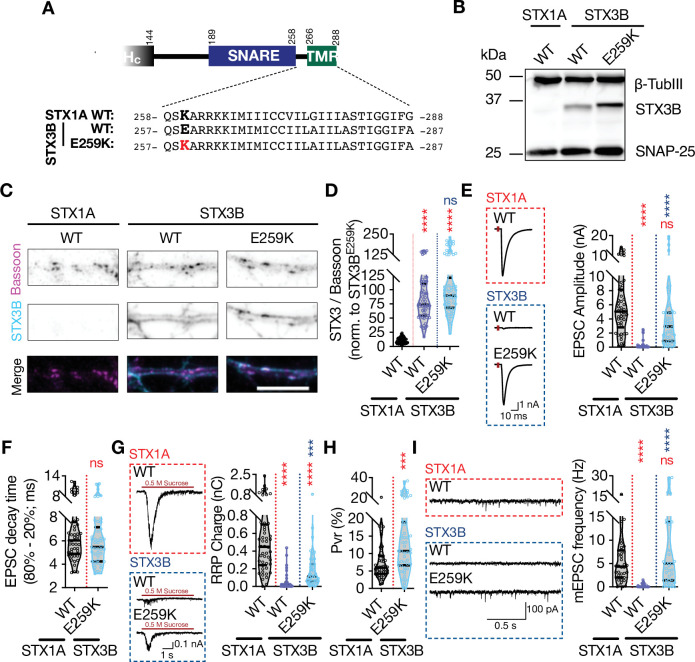
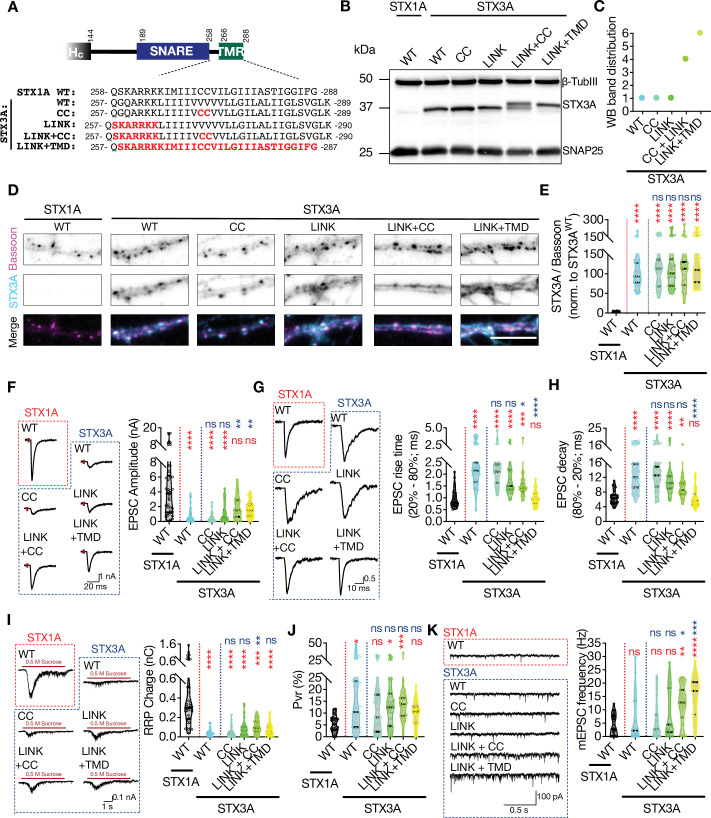
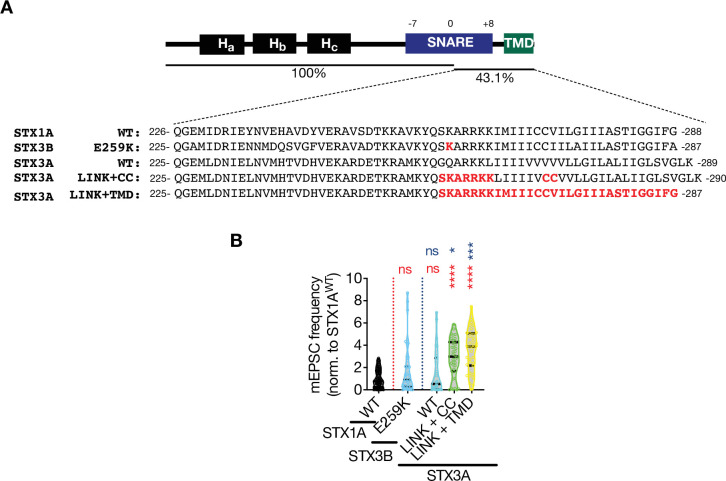
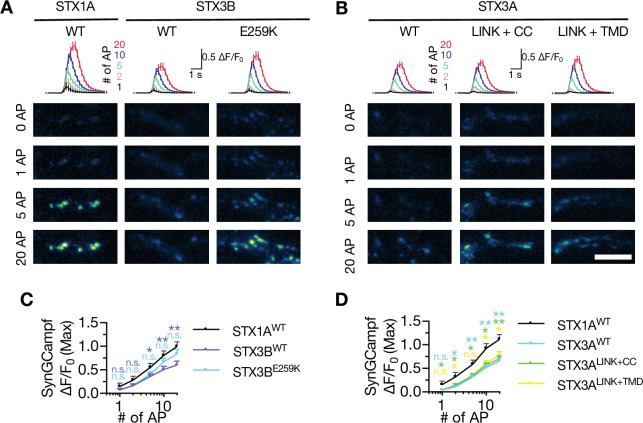
SNAREs are undoubtedly one of the core elements of synaptic transmission. Contrary to the well characterized function of their SNARE domains bringing the plasma and vesicular membranes together, the level of contribution of their juxtamembrane domain (JMD) and the transmembrane domain (TMD) to the vesicle fusion is still under debate. To elucidate this issue, we analyzed three groups of STX1A mutations in cultured mouse hippocampal neurons: (1) elongation of STX1A's JMD by three amino acid insertions in the junction of SNARE-JMD or JMD-TMD; (2) charge reversal mutations in STX1A's JMD; and (3) palmitoylation deficiency mutations in STX1A's TMD. We found that both JMD elongations and charge reversal mutations have position-dependent differential effects on Ca2+-evoked and spontaneous neurotransmitter release. Importantly, we show that STX1A's JMD regulates the palmitoylation of STX1A's TMD and loss of STX1A palmitoylation either through charge reversal mutation K260E or by loss of TMD cysteines inhibits spontaneous vesicle fusion. Interestingly, the retinal ribbon specific STX3B has a glutamate in the position corresponding to the K260E mutation in STX1A and mutating it with E259K acts as a molecular on-switch. Furthermore, palmitoylation of post-synaptic STX3A can be induced by the exchange of its JMD with STX1A's JMD together with the incorporation of two cysteines into its TMD. Forced palmitoylation of STX3A dramatically enhances spontaneous vesicle fusion suggesting that STX1A regulates spontaneous release through two distinct mechanisms: one through the C-terminal half of its SNARE domain and the other through the palmitoylation of its TMD.

Keywords: juxtamembrane domain; mouse; neuroscience; neurotransmitter release; palmitoylation; syntaxin-1; syntaxin-3; transmembrane domain.


Conflict of interest statement

GV, AS, SZ, TT, CR No competing interests declared

Figures

Figure 1.
Figure 1.. The level and mode of impairment of neurotransmitter release by the elongation of STX1A’s JMD depends the position of the GSG-insertion.
(A) STX1A domain structure and insertion of GSG into its JMD. The C-terminal TMD and SNARE motif are separated only by a short polybasic JMD.(B) Example traces (left) and quantification of the amplitude (right) of excitatory postsynaptic currents (EPSCs) obtained from hippocampal autaptic STX1-null neurons rescued either with STX1AWT, STX1AGSG259, or STX1AGSG265. (C) Quantification of the charge (right) of EPSCs obtained from the same neurons as in (B). (D) Example traces with the peak normalized to one (left) and quantification of the EPSC rise time measured from 20 to 80% of the EPSC recorded from STX1BWT or STX1AGSG265. (E) Quantification of the decay time measured from 80 to 20% of the EPSC recorded from the same neurons as in (D). (F) Example traces (left) and quantification of the charge transfer (right) of 500 mM sucrose-elicited readily releasable pool (RRPs) obtained from the same neurons as in (B). (G) Quantification of vesicular probability (Pvr) determined as the percentage of the RRP released upon one AP. (H) Example traces (left) and quantification of the frequency (right) of mEPSCs recorded at –70 mV. Data information: the artifacts are blanked in example traces in (B, D, and F). The example traces in (H) were filtered at 1 kHz. In (B–H), data points represent single observations, the violin bars represent the distribution of the data with lines showing the median and the quartiles. Red and black annotations (stars and ns) on the graphs show the significance comparisons to STX1AWT and STX1AGSG259, respectively. Non-parametric Kruskal-Wallis test followed by Dunn’s post hoc test was applied to data in (B, C, and F-H), Mann-Whitney test was applied in (D and E); ***p≤0.001, ****p≤0.0001. The numerical values are summarized in source data.
Figure 2.
Figure 2.. Charge reversal mutations in STX1A’s JMD manifest position specific effects on different modes of neurotransmitter release.
(A) Position of the charge reversal mutations on STX1A’s JMD. (B) Example traces (left) and quantification of the amplitude (right) of excitatory postsynaptic currents (EPSCs) obtained from hippocampal autaptic STX1-null neurons rescued either with STX1AWT, STX1AK256E, STX1AK260E, STX1AR262E, or STX1AK264E. (C) Quantification of the decay time (80–20%) of the EPSC recorded from the same neurons as in (B). (D) Example traces (left) and quantification of readily releasable pool (RRP) recorded from the same neurons as in (B). (E) Quantification of vesicular probability (Pvr) recorded from the same neurons as in (B). (F) Example traces (left) and quantification of the frequency (right) of miniature excitatory postsynaptic currents (mEPSCs) recorded from the same neurons as in (B). (G) Correlation of the EPSC amplitude normalized to that of STX1AWT to the position of the charge reversal mutation. (H) Correlation of the RRP charge normalized to that of STX1AWT to the position of the charge reversal mutation. (I) Correlation of Pvr normalized to that of STX1AWT to the position of the charge reversal mutation. Correlation of the mEPSC frequency normalized to that of STX1AWT to the position of the charge reversal mutation. Data information: the artifacts are blanked in example traces in (B) and (D). The example traces in (F) were filtered at 1 kHz. In (B–F), data points represent single observations, the violin bars represent the distribution of the data with lines showing the median and the quartiles. In (G–J), data points represent mean ± SEM. Red annotations (stars) on the graphs show the significance comparisons to STX1AWT. Non-parametric Kruskal-Wallis test followed by Dunn’s post hoc test was applied to data in (B–F); *p≤0.05, ***p≤0.001, ****p≤0.0001. The numerical values are summarized in source data.
Figure 2—figure supplement 1.
Figure 2—figure supplement 1.. Charge reversal mutations in STX1A’s JMD manifest position specific effects on different modes of neurotransmitter release.
(A) Example traces (left) and quantification of the amplitude (right) of excitatory postsynaptic currents (EPSCs) obtained from hippocampal autaptic STX1-null neurons rescued either with STX1AWT, STX1AA261R, STX1AR263E, or STX1AK264E. (B) Example traces (left) and quantification of the frequency (right) of miniature excitatory postsynaptic currents (mEPSCs) recorded from the same neurons as in (A). (C) Example traces (left) and quantification of readily releasable pool (RRP) recorded from the same neurons as in (A). (D) Quantification of vesicular probability (Pvr) recorded from the same neurons as in (A). Data information: the artifacts are blanked in example traces in (A) and (C). The example traces in (B) were filtered at 1 kHz. In (A–D), data points represent single observations, the violin bars represent the distribution of the data with lines showing the median and the quartiles. Red annotations (stars) on the graphs show the significance comparisons to STX1AWT. Non-parametric Kruskal-Wallis test followed by Dunn’s post hoc test was applied to data in (A–D); *p≤0.05, ***p≤0.001. The numerical values are summarized in source data.
Figure 2—figure supplement 2.
Figure 2—figure supplement 2.. Multiple charge neutralization mutations in STX1A’s JMD dramatically impairs neurotransmitter release.
(A) Quantification of the amplitude of excitatory postsynaptic currents (EPSCs) obtained from hippocampal autaptic STX1-null neurons rescued either with STX1AWT, STX1ARRAA (R262A,R263A), STX1AKKAA (K264A,K265A), or STX1A4RKA (R262A,R263A,K264A,K265A). (B) Quantification of the frequency of miniature excitatory postsynaptic currents (mEPSCs) recorded from the same neurons as in (A). (C) Quantification of readily releasable pool (RRP) recorded from the same neurons as in (A). (D) Quantification of vesicular probability (Pvr) recorded from the same neurons as in (A). Data information: the data points represent single observations, the violin bars represent the distribution of the data with lines showing the median and the quartiles. Red annotations (stars) on the graphs show the significance comparisons to STX1AWT. Non-parametric Kruskal-Wallis test followed by Dunn’s post hoc test was applied to data in (A–D); *p≤0.05, ***p≤0.001, ****p≤0.001. The numerical values are summarized in source data.
Figure 3.
Figure 3.. Charge reversal mutations in STX1A’s JMD manifest position-specific effects on the molecular weight of STX1A.
(A) Example image of SDS-PAGE of the electrophoretic analysis of lysates obtained from STX1-null neurons transduced with different STX1A JMD charge reversal mutations. (B) Quantification of the STX1A band pattern on SDS-PAGE of neuronal lysates through assignment of arbitrary hierarchical numbers from 1 to 6 based on the distance traveled, where number 1 represents the lowest single band as in STX1AK260E and number 6 represents the highest single band as in STX1AWT.(C) Quantification of the STX1A weighed band intensity of neuronal lysates for which the lowest band was arbitrarily assigned by 1 × and the highest band was assigned as 100 × and multiplied by the measured intensity of the STX1A bands. (D) Example image of SDS-PAGE of the electrophoretic analysis of lysates obtained from HEK293 cells transfected with different STX1A JMD charge reversal mutations. (E) Quantification of the STX1A band pattern on SDS-PAGE of HEK293 cell lysates as in (B). (F) Quantification of the STX1A weighed band intensity on SDS-PAGE of HEK293 cell lysates as in (C). (G) Correlation of the excitatory postsynaptic current (EPSC) amplitude normalized to that of STX1AWT to the western blot (WB) band position of STX1A charge reversal mutation. (H) Correlation of the readily releasable pool (RRP) charge normalized to that of STX1AWT to the WB band position of STX1A charge reversal mutation.(I) Correlation of vesicular probability (Pvr) normalized to that of STX1AWT to the WB band position of STX1A charge reversal mutation. (J) Correlation of the miniature excitatory postsynaptic current (mEPSC) frequency normalized to that of STX1AWT to the WB band position of STX1A charge reversal mutation. Data information: in (C, F, and G–J), data points represent mean ± SEM. Red lines in all graphs represent the STX1AWT level. The numerical values are summarized in source data.
Figure 4.
Figure 4.. Charge reversal mutations in STX1A’s JMD manifest position-specific effects on different modes of neurotransmitter release.
(A) Position of the palmitoylation deficiency mutations on STX1A’s TMD. (B) Example image of SDS-PAGE of the electrophoretic analysis of lysates obtained from STX1-null neurons transduced with STX1A with different palmitoylation deficiency mutations and with STX1AK260E and STX1AK260E+CVCV. (C) Example image of the SDS-PAGE of lysates of STX1-null neurons transduced with FLAG-tagged STX1AWT, STX1AK260E, or STX1ACVCV loaded onto the SDS-PAGE after Acyl-Biotin-Exchange (ABE) method and visualized by Horseradish peroxidase (HRP)-Streptavidin antibody (top panel). After stripping the Streptavidin antibody, the membrane was developed with STX1A antibody (bottom panel). (D) Example traces (left) and quantification of the amplitude (right) of excitatory postsynaptic currents (EPSCs) obtained from hippocampal autaptic STX1-null neurons rescued either with STX1AWT, STX1AC271V, STX1AC272V, or STX1ACVCV. (E) Quantification of the decay time (80–20%) of the EPSC recorded from the same neurons as in (D). (F) Example traces (left) and quantification of readily releasable pool (RRP) recorded from the same neurons as in (D). (G) Quantification of vesicular probability (Pvr) recorded from the same neurons as in (D). (H) Example traces (left) and quantification of the frequency (right) of miniature excitatory postsynaptic currents (mEPSCs) recorded from the same neurons as in (B). (I) Example traces (left) and quantification (right) of short-term plasticity (STP) measured by 50 stimulations at 10 Hz recorded from the same neurons as in (B). Data information: the artifacts are blanked in example traces in (D and F). The example traces in (H) were filtered at 1 kHz. In (D–H), data points represent single observations, the violin bars represent the distribution of the data with lines showing the median and the quartiles. In (I), data points represent mean ± SEM. Red annotations (stars) on the graphs show the significance comparisons to STX1AWT. Non-parametric Kruskal-Wallis test followed by Dunn’s post hoc test was applied to data in (D–H); *p≤0.05, **p≤0.01, ****p≤0.0001. The numerical values are summarized in source data.
Figure 4—figure supplement 1.
Figure 4—figure supplement 1.. K260E mutation in STX1A’s JMD leads to loss of palmitoylation of its TMD.
(A) Palmitoylation was assessed by Acyl-Biotin-Exchange (ABE) method. The samples were probed with Horseradish peroxidase (HRP)-streptavidin antibody (Culture 1). (B) The HRP-streptavidin antibody was stripped and the samples were further probed with anti-STX1A antibody. The red dashed line indicates that the biotin that covalently bound to the free thiols after hydroxylamine (HAM) cleavage in (A) is detected at the position of STX1A in (B) (Culture 1). (C) Superimposition of the biotin and STX1A detection (Culture 1).(D) The repetition of the ABE method. The samples were probed with HRP-streptavidin antibody (Culture 2). (E) The membranes were reprobed with anti-STX1A antibody (Culture 2). (F) Superimposition of the biotin and STX1A detection (Culture 2).
Figure 5.
Figure 5.. Combination of the K260E and CVCV mutations does not further change the phenotype of STX1AK260E.
(A) The average (top panel) of SynGCaMP6f fluorescence as (ΔF/F0) and example images thereof (bottom panels) in STX1-null neurons either not rescued or rescued with STX1AWT, STX1AK260E, or STX1ACVCV. The images were recorded at baseline, and at 1, 2, 5, 10, and 20 APs. Scale bar: 10 µm. (B) Quantification of the SynGCaMP6f fluorescence as (ΔF/F0) in STX1-null neurons either not rescued or rescued with STX1AWT. (C) Quantification of the SynGCaMP6f fluorescence as (ΔF/F0) in STX1-null neurons rescued with STX1AWT, STX1AK260E, or STX1ACVCV.(D) Example traces (left) and quantification of the amplitude (right) of excitatory postsynaptic currents (EPSCs) obtained from hippocampal autaptic STX1-null neurons rescued either with STX1AWT, STX1AK260E, STX1ACVCV, or STX1AK260E+CVCV. (E) Quantification of the decay time (80–20%) of the EPSC recorded from the same neurons as in (D). (F) Example traces (left) and quantification of readily releasable pool (RRP) recorded from the same neurons as in (D). (G) Quantification of vesicular probability (Pvr) recorded from the same neurons as in (D). (H) Example traces (left) and quantification of the frequency (right) of miniature excitatory postsynaptic currents (mEPSCs) recorded from the same neurons as in (D). (I) Example traces (left) and quantification (right) of short-term plasticity (STP) measured by 50 stimulations at 10 Hz recorded from same neurons as in (D). (J) Example traces (left) and quantification (right) of the ratio of the charge transfer triggered by 250 mM sucrose over that of 500 mM sucrose recorded from same neurons as in (D) as a read-out of fusogenicity of the SVs. Data information: The artifacts are blanked in example traces in (D, F, and J). The example traces in (H) were filtered at 1 kHz. In (B, C, and I), data points represent mean ± SEM. In (D–H and J), data points represent single observations, the violin bars represent the distribution of the data with lines showing the median and the quartiles. Red annotations (stars) on the graphs show the significance comparisons to STX1AWT. Non-parametric Kruskal-Wallis test followed by Dunn’s post hoc test was applied to data in (B–H and J); **p≤0.01, ***p≤0.001, ****p≤0.0001. The numerical values are summarized in source data.
Figure 5—figure supplement 1.
Figure 5—figure supplement 1.. Comparison of the STX1AK260E and STX1ACVCV phenotypes by the pooled data of the normalized values for each culture.
(A) The excitatory postsynaptic current (EPSC) amplitude values were normalized to STX1AWT in each individual culture and pooled together. (B) The miniature excitatory postsynaptic current (mEPSC) frequency values were normalized to STX1AWT in each individual culture and pooled together.(C) The readily releasable pool (RRP) values were normalized to STX1AWT in each individual culture and pooled together. (D) The vesicular probability (Pvr) values were normalized to STX1AWT in each individual culture and pooled together. Data information: data points represent single observations and bar graphs represent mean ± SEM. Black annotations (stars and ns) on the graphs show the significance comparisons to STX1AWT based on non-parametric Mann-Whitney test. Red annotations (stars and ns) on the graphs show the significance comparisons between STX1AK260E and STX1ACVCV based on non-parametric Kruskal-Wallis test followed by Dunn’s post hoc test; **p≤0.01, ***p≤0.001, ****p≤0.0001. The numerical values are summarized in source data.
Figure 6.
Figure 6.. Palmitoylation of STX1A’s TMD depends on the presence of a basic residue at position AA 260 on its JMD.
(A) Position of the AA 260 on STX1A’s JMD. (B) Example image of SDS-PAGE of the electrophoretic analysis of lysates obtained from STX1-null neurons transduced with STX1AWT, STX1AK260E, STX1AK260A, STX1AK260Q, or STX1AK260R. (C) Example traces (left) and quantification of the amplitude (right) of excitatory postsynaptic currents (EPSCs) obtained from hippocampal autaptic STX1-null neurons rescued either with STX1AWT, STX1AK260E, STX1AK260A, STX1AK260Q, or STX1AK260R. (D) Example traces (left) and quantification of readily releasable pool (RRP) recorded from the same neurons as in (C). (E) Quantification of vesicular probability (Pvr) recorded from the same neurons as in (C). (F) Example traces (left) and quantification of the frequency (right) of miniature excitatory postsynaptic currents (mEPSCs) recorded from the same neurons as in (C). (G) Speculative model of the role of K260 and C271/C272 residues of STX1A. Left panel: the TMD of STX1AWT potentially adopts a tilted conformation that reduces the energy barrier for membrane merger. Palmitoylation of the TMD regulated by K260 contributes to its tilted conformation and thus to the facilitation of vesicle fusion. Middle panel: Inhibition of the palmitoylation of STX1A’s TMD either by K260E or CVCV mutations encumbers the TMD tilting and thus increases the energy barrier required for membrane merger. Left panel: the energy barrier is lower when STX1A-TMD is palmitoylated (STX1AWT,green) compared to that when STX1A-TMD is not palmitoylated (STX1AK260E or STX1ACVCV, red). Data information: the artifacts are blanked in example traces in (C and D). The example traces in (F) were filtered at 1 kHz. In (C–F), data points represent single observations, the violin bars represent the distribution of the data with lines showing the median and the quartiles. Red and blue annotations (stars and ns) on the graphs show the significance comparisons to STX1AWT and STX1AK260E, respectively. Non-parametric Kruskal-Wallis test followed by Dunn’s post hoc test was applied to data in (C–F); *p≤0.05, **p≤0.01, ***p≤0.001, ****p≤0.0001. The numerical values are summarized in source data.
Figure 7.
Figure 7.. Retinal ribbon specific STX3B has a glutamate at position AA 259 rendering its JMD similar to that of STX1AK260E and E259K mutation on STX3B acts as a molecular on-switch.
(A) Position of the AA 259 on STX3B’s JMD. (B) Example image of SDS-PAGE of the electrophoretic analysis of lysates obtained from STX1-null neurons transduced with STX1AWT, STX3BWT, or STX3BE259K. (C) Example images of immunofluorescence labeling for Bassoon and STX3B, shown as magenta and cyan, respectively, in the corresponding composite pseudocolored images obtained from high-density cultures of STX1-null hippocampal neurons rescued with STX1AWT, STX3BWT, or STX3BE259K. Scale bar: 10 µm (F) Quantification of the immunofluorescence intensity of STX3B as normalized to the immunofluorescence intensity of Bassoon in the same ROIs as shown in (C). The values were then normalized to the values obtained from STX3BWT neurons. (E) Example traces (left) and quantification of the amplitude (right) of excitatory postsynaptic currents (EPSCs) obtained from hippocampal autaptic STX1-null neurons rescued with STX1AWT, STX3BWT, or STX3BE259K. (F) Quantification of the decay time (80–20%) of the EPSC recorded from the same neurons as in (E). (G) Example traces (left) and quantification of readily releasable pool (RRP) recorded from the same neurons as in (E). (H) Quantification of vesicular probability (Pvr) recorded from the same neurons as in (E). (I) Example traces (left) and quantification of the frequency (right) of miniature excitatory postsynaptic currents (mEPSCs) recorded from the same neurons as in (E). Data information: The artifacts are blanked in example traces in (E and G). The example traces in (I) were filtered at 1 kHz. In (D–I), data points represent single observations, the violin bars represent the distribution of the data with lines showing the median and the quartiles. Red and blue annotations (stars and ns) on the graphs show the significance comparisons to STX1AWT and STX3BWT, respectively. Non-parametric Kruskal-Wallis test followed by Dunn’s post hoc test was applied to data in (C–F); ***p≤0.001, ****p≤0.0001. The numerical values are summarized in source data.
Figure 8.
Figure 8.. The impacts of palitoylation of STX1A’s TMD on spontaneous release and can be emulated by using STX3A.
(A) Comparison of the JMD and TMD regions of STX1A and STX3A and the mutations introduced into STX3A. (B) Example image of SDS-PAGE of the electrophoretic analysis of lysates obtained from STX1-null neurons transduced with STX1AWT, STX3AWT, STX3ACC, STX3ALINK+CC, or STX3ALINK+TMR. (C) Quantification of the STX3A band pattern on SDS-PAGE of neuronal lysates through assignment of arbitrary hierarchical numbers from 1 to 6 based on the distance traveled as in Figure 3A. (D) Example images of immunofluorescence labeling for Bassoon and STX3A, shown as magenta and cyan, respectively, in the corresponding composite pseudocolored images obtained from high-density cultures of STX1-null hippocampal neurons rescued with STX1AWT, STX3AWT, STX3ACC, STX3ALINK+CC, or STX3ALINK+TMR. Scale bar: 10 µm. (E) Quantification of the immunofluorescence intensity of STX3A as normalized to the immunofluorescence intensity of Bassoon in the same ROIs as shown in (D). The values were then normalized to the values obtained from STX3AWT neurons. (F) Example traces (left) and quantification of the amplitude (right) of excitatory postsynaptic currents (EPSCs) obtained from hippocampal autaptic STX1-null neurons rescued with STX1AWT, STX3AWT, STX3ACC, STX3ALINK+CC, or STX3ALINK+TMR. (G) Example traces with the peak normalized to 1 (left) and quantification of the EPSC rise time measured from 20 to 80% of the EPSC recorded from STX1-null neurons as in (F). (H) Quantification of the decay time (80–20%) of the EPSC recorded from the same neurons as in (F). (I) Example traces (left) and quantification of readily releasable pool (RRP) recorded from the same neurons as in (F). (J) Quantification of vesicular probability (Pvr) recorded from the same neurons as in (F). (K) Example traces (left) and quantification of the frequency (right) of miniature excitatory postsynaptic currents (mEPSCs) recorded from the same neurons as in (F). Data information: the artifacts are blanked in example traces in (F, G, and I). The example traces in (K) were filtered at 1 kHz. In (E–K), data points represent single observations, the violin bars represent the distribution of the data with lines showing the median and the quartiles. Red and blue annotations (stars and ns) on the graphs show the significance comparisons to STX1AWT and STX3AWT, respectively. Non-parametric Kruskal-Wallis test followed by Dunn’s post hoc test was applied to data in (C–F); *p≤0.05, **p≤0.01, ***p≤0.001, ****p≤0.0001. The numerical values are summarized in source data.
Figure 8—figure supplement 1.
Figure 8—figure supplement 1.. C-terminal half of STX1A’s SNARE domain clamps spontaneous neurotransmitter release.
(A) Sequence alignment of the JMD and TMD regions of STX1AWT, STX3BE259K, STX3AWT, STX3ALINK+CC, and STX3ALINK+TMR. (B) The miniature excitatory postsynaptic current (mEPSC) frequency values were normalized to STX1AWT in each individual culture and pooled together. Data information: data points represent single observations and the violin bars represent the distribution of the data with lines showing the median and the quartiles. Red and blue annotations (stars and ns) on the graphs show the significance comparisons to STX1AWT and STX3BE259K, respectively. Non-parametric Kruskal-Wallis test followed by Dunn’s post hoc test was applied to data in (C–F); *p≤0.05, ***p≤0.001, ****p≤0.0001. The numerical values are summarized in source data.
Figure 9.
Figure 9.. Neither STX3A nor STX3B rescues the global Ca2+-influx back at WT-like level in STX1-null neurons.
(A) The average (top panel) of SynGCaMP6f fluorescence as (ΔF/F0) and example images thereof (bottom panels) in STX1-null neurons rescued with STX1AWT, STX3BWT, or STX3BE259K. The images were recorded at baseline, and at 1, 2, 5, 10, and 20 APs. Scale bar: 10 µm. (B) The average (top panel) of SynGCaMP6f fluorescence as (ΔF/F0) and example images thereof (bottom panels) in STX1-null neurons rescued with STX1AWT, STX3AWT, STX3ACC, STX3ALINK+CC, or STX3ALINK+TMR. The images were recorded at baseline, and at 1, 2, 5, 10, and 20 APs. Scale bar: 10 µm. (C) Quantification of the SynGCaMP6f fluorescence as (ΔF/F0) in STX1-null neurons rescued with STX1AWT, STX3BWT, or STX3BE259K. (D) Quantification of the SynGCaMP6f fluorescence as (ΔF/F0) in STX1-null neurons rescued with STX1AWT, STX3AWT, STX3ACC, STX3ALINK+CC, or STX3ALINK+TMR. Data information: in (C and D), data points represent mean ± SEM. All annotations (stars and ns) on the graphs show the significance comparisons to STX1AWT with the color of corresponding group. Non-parametric Kruskal-Wallis test followed by Dunn’s post hoc test was applied to data in (C and D); *p≤0.05, **p≤0.01. The numerical values are summarized in source data.

References

    1. Aoyagi K, Sugaya T, Umeda M, Yamamoto S, Terakawa S, Takahashi M. The activation of exocytotic sites by the formation of phosphatidylinositol 4,5-bisphosphate microdomains at syntaxin clusters. The Journal of Biological Chemistry. 2005;280:17346–17352. doi: 10.1074/jbc.M413307200. - DOI - PubMed
    1. Araç D, Chen X, Khant HA, Ubach J, Ludtke SJ, Kikkawa M, Johnson AE, Chiu W, Südhof TC, Rizo J. Close membrane-membrane proximity induced by Ca(2+)-dependent multivalent binding of synaptotagmin-1 to phospholipids. Nature Structural & Molecular Biology. 2006;13:209–217. doi: 10.1038/nsmb1056. - DOI - PubMed
    1. Bachnoff N, Cohen-Kutner M, Trus M, Atlas D. Intra-membrane signaling between the voltage-gated Ca2+-channel and cysteine residues of syntaxin 1A coordinates synchronous release. Scientific Reports. 2013;3:1620. doi: 10.1038/srep01620. - DOI - PMC - PubMed
    1. Blaskovic S, Blanc M, van der Goot FG. What does S-palmitoylation do to membrane proteins? The FEBS Journal. 2013;280:2766–2774. doi: 10.1111/febs.12263. - DOI - PubMed
    1. Brigidi GS, Bamji SX. Detection of protein palmitoylation in cultured hippocampal neurons by immunoprecipitation and acyl-biotin exchange (ABE. Journal of Visualized Experiments. 2013;1:50031. doi: 10.3791/50031. - DOI - PMC - PubMed

Publication types