

Relation of MRI Aortic Wall Area and Plaque to Incident Cardiovascular Events: The Framingham Heart Study
- PMID: 35638924
- PMCID: PMC9434818
- DOI: 10.1148/radiol.210830
Relation of MRI Aortic Wall Area and Plaque to Incident Cardiovascular Events: The Framingham Heart Study
Abstract
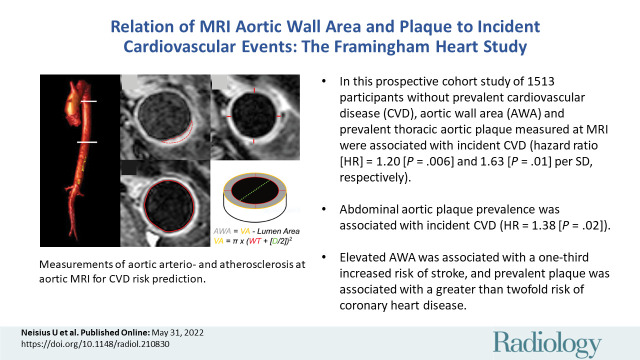
Background Arterial arteriosclerosis and atherosclerosis reflect vascular disease, the subclinical detection of which allows opportunity for cardiovascular disease (CVD) prevention. Larger cohort studies simultaneously quantifying anatomic thoracic and abdominal aortic pathologic abnormalities are lacking in the literature. Purpose To investigate the association of aortic wall area (AWA) and atherosclerotic plaque presence and burden as measured on MRI scans with incident CVD in a community sample. Materials and Methods In this prospective cohort study, participants in the Framingham Heart Study Offspring Cohort without prevalent CVD underwent 1.5-T MRI (between 2002-2005) of the descending thoracic and abdominal aorta with electrocardiogram-gated axial T2-weighted black-blood acquisitions. The wall thickness of the thoracic aorta was measured at the pulmonary bifurcation level and used to calculate the AWA as the difference between cross-sectional vessel area and lumen area. For primary or secondary analyses, multivariable Cox proportional hazards regression models were used to examine the association of aortic MRI measures with risk of first-incident CVD events or stroke and coronary heart disease, respectively. Results In 1513 study participants (mean age, 64 years ± 9 [SD]; 842 women [56%]), 223 CVD events occurred during follow-up (median, 13.1 years), of which 97 were major events (myocardial infarction, ischemic stroke, or CVD death). In multivariable analysis, thoracic AWA and prevalent thoracic plaque were associated with incident CVD (hazard ratio [HR], 1.20 per SD unit [95% CI: 1.05, 1.37] [P = .006] and HR, 1.63 [95% CI: 1.12, 2.35] [P = .01], respectively). AWA and prevalent thoracic plaque were associated with increased hazards: 1.32 (95% CI: 1.07, 1.62; P = .01) and 2.20 (95% CI: 1.28, 3.79; P = .005), for stroke and coronary heart disease, respectively. Conclusion In middle-aged community-dwelling adults, thoracic aortic wall area (AWA), plaque prevalence, and plaque volumes measured with MRI were independently associated with incident cardiovascular disease, with AWA associated in particular with stroke, and plaque associated with coronary heart disease. Clinical trial registration no. NCT00041418 © RSNA, 2022 Online supplemental material is available for this article. See also the editorial by Peshock in this issue.
Conflict of interest statement
Figures


![Risk of elevated aortic wall measures and plaque for incident cardiovascular disease (CVD). Forest plot shows the hazard ratios (HRs) of CVD events for each unit increase in aortic wall and plaque measures after age/sex or multivariable adjustments (age, sex, hypertension, hypercholesterolemia, diabetes mellitus, and smoking status). Continuous variables were calculated per 1 SD unit. CVD occurred in 223 of 1513 Framingham Heart Study Offspring Cohort participants free of disease at baseline (incidence rate, 12.4 [95% CI: 10.8, 14.1]). Ln = natural-logarithmic–transformed.](https://cdn.ncbi.nlm.nih.gov/pmc/blobs/26a0/9434818/145397726e88/radiol.210830.fig3.jpg)


Comment in
-
MRI of the Aortic Wall to Assess Cardiovascular Risk and Prognosis.Radiology. 2022 Sep;304(3):551-552. doi: 10.1148/radiol.221063. Epub 2022 May 31. Radiology. 2022. PMID: 35638931 No abstract available.
References
-
- Arnett DK , Blumenthal RS , Albert MA , et al. . 2019 ACC/AHA guideline on the primary prevention of cardiovascular disease: a report of the American College of Cardiology/American Heart Association Task Force on Clinical Practice Guidelines . Circulation 2019. ; 140 ( 11 ): e596 – e646 . - PMC - PubMed
-
- Litwin M , Wühl E , Jourdan C , et al. . Altered morphologic properties of large arteries in children with chronic renal failure and after renal transplantation . J Am Soc Nephrol 2005. ; 16 ( 5 ): 1494 – 1500 . - PubMed
-
- Laurent S , Boutouyrie P . The structural factor of hypertension: large and small artery alterations . Circ Res 2015. ; 116 ( 6 ): 1007 – 1021 . - PubMed
-
- Maroules CD , Rosero E , Ayers C , Peshock RM , Khera A . Abdominal aortic atherosclerosis at MR imaging is associated with cardiovascular events: the Dallas Heart Study . Radiology 2013. ; 269 ( 1 ): 84 – 91 . - PubMed
Publication types
MeSH terms
Associated data
Grants and funding
LinkOut - more resources
Full Text Sources
Medical
