. 2022 Aug 24;14(659):eabo7081.
doi: 10.1126/scitranslmed.abo7081. Epub 2022 Aug 24.

SARS-CoV-2 transmission, persistence of immunity, and estimates of Omicron's impact in South African population cohorts

Affiliations

SARS-CoV-2 transmission, persistence of immunity, and estimates of Omicron's impact in South African population cohorts

Kaiyuan Sun et al. Sci Transl Med. .

Abstract

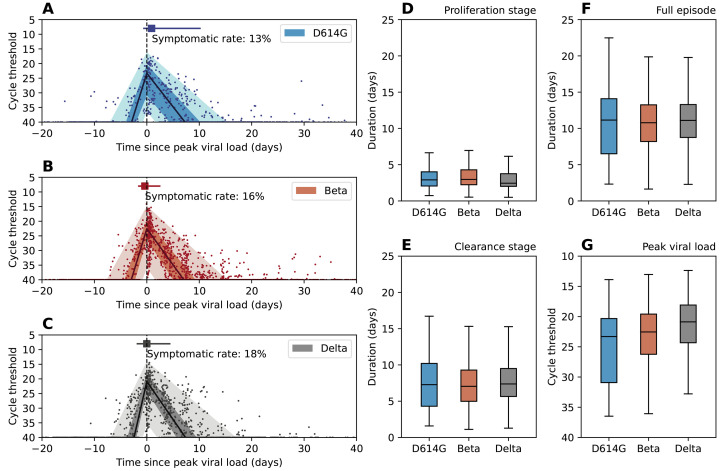
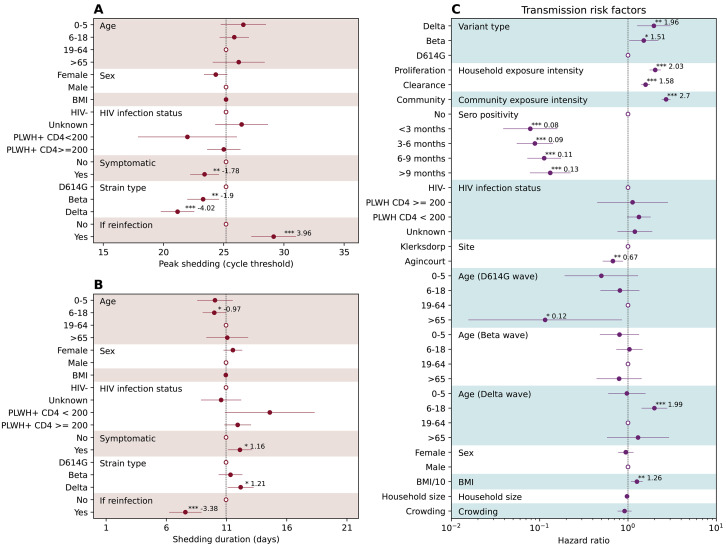
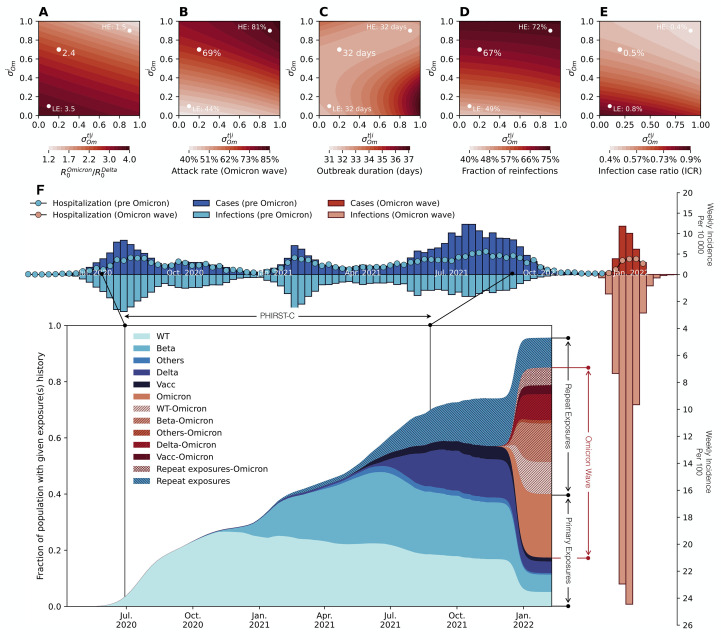
Understanding the build-up of immunity with successive severe acute respiratory syndrome coronavirus 2 (SARS-CoV-2) variants and the epidemiological conditions that favor rapidly expanding epidemics will help facilitate future pandemic control. We analyzed high-resolution infection and serology data from two longitudinal household cohorts in South Africa to reveal high cumulative infection rates and durable cross-protective immunity conferred by prior infection in the pre-Omicron era. Building on the history of past exposures to different SARS-CoV-2 variants and vaccination in the cohort most representative of South Africa's high urbanization rate, we used mathematical models to explore the fitness advantage of the Omicron variant and its epidemic trajectory. Modeling suggests that the Omicron wave likely infected a large fraction (44 to 81%) of the population, leaving a complex landscape of population immunity primed and boosted with antigenically distinct variants. We project that future SARS-CoV-2 resurgences are likely under a range of scenarios of viral characteristics, population contacts, and residual cross-protection.


Figures

Fig. 1.
Fig. 1.. PHIRST-C study June 2020 – September 2021, description of the epidemiology of SARS-CoV-2 in the two study sites, along with serology and rRT-PCR data.
(A-B) Dots in different colors represent the timing and the readouts (axis on the left) of Roche Elecsys Anti-SARS-CoV-2 assay of serum specimens collected from 4 different blood draws of the rural cohort. The dash line is the positive cutoff of the Roche Elecsys Anti-SARS-CoV-2 assay, above which a specimen is considered sero-positive. The red lines (from light to dark) are the cumulative SARS-CoV-2 variant exposures (axis on the right) over time, captured by positive rRT-PCR of mid-turbinate nasal swab samples only; by either positive serum antibody or positive mid-turbinate nasal swabs by rRT-PCR, and by either positive serum antibody or positive mid-turbinate nasal swabs by rRT-PCR or at least one dose of vaccine. The light and dark blue lines are the cumulative fraction of population receiving a 1st and 2nd dose of vaccine. The grey bars are the weekly SARS-CoV-2 incidence per 40,000 population (sharing the same axis on the right) captured by the surveillance system of Ehlanzeni District in Mpumalanga Province, where the rural site is located. (B) Same as (A) but for the urban site of Klerksdorp in the Dr Kenneth Kaunda District, North West Province. (C-D) rRT-PCR test results for all mid-turbinate nasal specimens collected from individuals in the rural (C) or urban (D) cohort over 80 visits during the 13-month study period. Color white indicates missing specimens; color red indicates the Ct value of the rRT-PCR test, the darker the red color, the lower the Ct value. (E-F) The bi-monthly relative prevalence of D614G mutation, Beta, Delta, and other variants over time at the rural (E) or urban (F) site.
Fig. 2.
Fig. 2.. SARS-CoV-2 shedding patterns by D614G, Beta, and Delta variants.
(A-C) Characterization of the RNA shedding kinetics for D614G (A), Beta (B), and Delta (C) infections. The solid dots are longitudinal Ct values observation for each infection episode, aligned based on the estimated timing of trough Ct. The solid line is the population median of all individual fits, the dark shade is the interquartile range, and the light shade is the 95% confidence interval. Dashed vertical line indicate the timing of peak viral load. The square marker and the horizontal line indicate the median time and interquartile range of symptom onset for symptomatic infections. We also reported the fraction of symptomatic infections among all infections (symptomatic rate) for each variant. (D-G) Distribution of the estimated duration of viral RNA proliferation (D), viral RNA clearance (E), full duration (proliferation stage + clearance stage) of rRT-PCR positivity (F), and distribution of the estimated trough Ct (G) for D614G, Beta, and Delta variants. Boxplots show median, interquartile range, minimum and maximum of the distribution.
Fig. 3.
Fig. 3.. Drivers of SARS-CoV-2 peak shedding, shedding duration, and risk factors associated with SASR-CoV-2 infection.
(A) The association between peak shedding (trough Ct) and age, sex BMI, HIV infection status, symptom presentation, variant type, and prior infection history, based on Gaussian multiple regression. Regression coefficients along with 95%CIs are reported as solid dots and horizontal lines relative to the value of the regression intercept. The hollow dots are reference class for each of the categorical variable. (B) Same as (A) but for shedding duration. (C) Piecewise exponential hazard model on risk factors associated with infection acquisition. Hazard ratios (HR) along with 95%CIs are reported as solid dots and horizontal lines. The hollow dots are reference class for each of the categorical variable. Protection is measured as 1HR . * p<0.05; ** p<0.01; *** p < 0.001 based on t test (A-B) and z-test (C). Abbreviations: HIV- (HIV-uninfected individuals), PLWH+ CD4 <200 (Persons living with HIV, CD4+ T cell count under 200 cells/ml), PLWH+ CD4 >=200 (Persons living with HIV, CD4+ T cell count equal or above 200 cells/ml).
Fig. 4.
Fig. 4.. Modelling the plausible epidemic trajectories of the SARS-CoV-2 Omicron wave in the urban site district.
(A) Phase diagram of estimated reproduction number ratio between Omicron and Delta ( R0Omicron/R0Delta ) as a function of immune escape parameters ( σOmi =escape on infection) and σOmt|i (escape on transmission reduction conditional on infection). Parameters shown are those that matched the observed growth advantage of Omicron over Delta and the timing of the Omicron peak in the urban district of the PHIRST-C study. (B-E) Phase diagram of the infection rate of the Omicron wave (B), epidemic duration (C), the fraction of reinfections (D), and the infection case ratio (ICR) (E) of the Omicron wave as a function of σOmi and σOmt|i and the corresponding R0Omicron/R0Delta in (A). In (A)-(E), white dots marks three specific scenarios including a reference scenario (RS) with σOmi=0.7 and σOmt|i=0.2 , a low immune escape scenario (LE) with σOmi=0.1 and σOmt|i=0.1 , and a high immune escape scenario (HE) with σOmi=0.9 and σOmt|i=0.9 . (F) For the reference scenario (dot in the middle), reconstruction of infection time series and exposure histories by variant are shown. Top panel y axis upwards: Weekly incidence per 10,000 individuals of SARS-CoV-2 cases reported to the District till January 2022, in the period before Omicron (dark blue bars) and during Omicron (dark red bars). Top panel y axis downwards: Weekly incidence per 100 individuals of SARS-CoV-2 infections reconstructed based on PHRIST-C data (prior to September 2021) and estimated using Delta/Omicron-specific transmission models from September 2021 to the end of the Omicron wave at the end of January 2022. Pre-Omicron infections are in light blue and Omicron infections are in light red. For the top panel, the y axis upwards and downwards have different scales (by a factor of 100). Insert panel: the prevalence of the population with specific SARS-CoV-2 antigen exposure histories. Legend abbreviations: D614G: individuals who only experienced one D614G infection; Beta: individuals who only experienced one Beta infection; Delta: individuals who only experienced one Delta infection; Omicron: individuals who only experienced one Omicron infection; Others: individuals who only experienced one SARS-CoV-2 infection with genotype other than the D614G, Beta, Delta and Omicron variants; Vacc: individuals who had received at least one dose of vaccines but had not yet been infected by SARS-CoV-2; Vacc-Omicron: individuals who were vaccinated first then infected by Omicron; D614G-Omicron: individuals who were first infected by D614G then infected by Omicron; Beta-Omicron: individuals who were infected by Beta first then infected by Omicron; Delta-Omicron: individuals who were infected by Delta first then infected by Omicron; Others-Omicron: individuals who were infected by a variant other than D614G, Beta, Delta and Omicron first then infected by Omicron; Repeat exposures: individuals who were exposed to SARS-CoV-2 antigens more than once (through vaccination or infection) without Omicron infection; Repeat exposures-Omicron: individuals who were exposed to SARS-CoV-2 antigens more than twice (through vaccination or infection) then infected by Omicron.

References

    1. Buss L. F., Prete C. A. Jr., Abrahim C. M. M., Mendrone A. Jr., Salomon T., de Almeida-Neto C., França R. F. O., Belotti M. C., Carvalho M. P. S. S., Costa A. G., Crispim M. A. E., Ferreira S. C., Fraiji N. A., Gurzenda S., Whittaker C., Kamaura L. T., Takecian P. L., da Silva Peixoto P., Oikawa M. K., Nishiya A. S., Rocha V., Salles N. A., de Souza Santos A. A., da Silva M. A., Custer B., Parag K. V., Barral-Netto M., Kraemer M. U. G., Pereira R. H. M., Pybus O. G., Busch M. P., Castro M. C., Dye C., Nascimento V. H., Faria N. R., Sabino E. C., Three-quarters attack rate of SARS-CoV-2 in the Brazilian Amazon during a largely unmitigated epidemic. Science 371, 288–292 (2021). 10.1126/science.abe9728 - DOI - PMC - PubMed
    1. Bhuiyan T. R., Hulse J. D., Hegde S. T., Akhtar M., Islam T., Khan Z. H., Khan I. I., Ahmed S., Rashid M., Rashid R., Gurley E. S., Shirin T., Khan A. I., Azman A. S., Qadri F., SARS-CoV-2 Seroprevalence before Delta Variant Surge, Chattogram, Bangladesh, March-June 2021. Emerg. Infect. Dis. 28, 429–431 (2022). 10.3201/eid2802.211689 - DOI - PMC - PubMed
    1. Huete-Pérez J. A., Ernst K. C., Cabezas-Robelo C., Páiz-Medina L., Silva S., Huete A., Prevalence and risk factors for SARS-CoV-2 infection in children with and without symptoms seeking care in Managua, Nicaragua: Results of a cross-sectional survey. BMJ Open 11, e051836 (2021). 10.1136/bmjopen-2021-051836 - DOI - PMC - PubMed
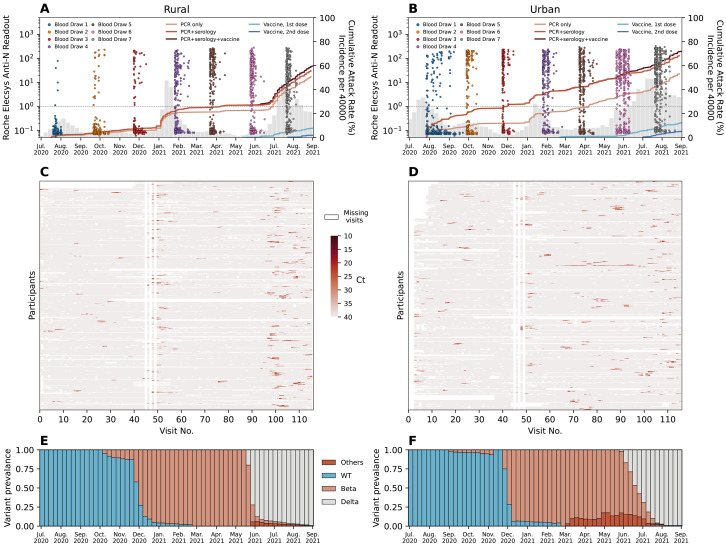
    1. Cohen C., Kleynhans J., von Gottberg A., McMorrow M. L., Wolter N., Bhiman J. N., Moyes J., du Plessis M., Carrim M., Buys A., Martinson N. A., Kahn K., Tollman S., Lebina L., Wafawanaka F., du Toit J. D., Gómez-Olivé F. X., Dawood F. S., Mkhencele T., Sun K., Viboud C., Tempia S.; PHIRST-C Group , SARS-CoV-2 incidence, transmission, and reinfection in a rural and an urban setting: Results of the PHIRST-C cohort study, South Africa, 2020-21. Lancet Infect. Dis. 22, 821–834 (2022). 10.1016/S1473-3099(22)00069-X - DOI - PMC - PubMed
    1. Tegally H., Wilkinson E., Lessells R. J., Giandhari J., Pillay S., Msomi N., Mlisana K., Bhiman J. N., von Gottberg A., Walaza S., Fonseca V., Allam M., Ismail A., Glass A. J., Engelbrecht S., Van Zyl G., Preiser W., Williamson C., Petruccione F., Sigal A., Gazy I., Hardie D., Hsiao N.-Y., Martin D., York D., Goedhals D., San E. J., Giovanetti M., Lourenço J., Alcantara L. C. J., de Oliveira T., Sixteen novel lineages of SARS-CoV-2 in South Africa. Nat. Med. 27, 440–446 (2021). 10.1038/s41591-021-01255-3 - DOI - PubMed

Publication types

Supplementary concepts