. 2022 Jul 8;7(13):e152738.
doi: 10.1172/jci.insight.152738.

Type I interferons and TGF-β cooperate to induce liver fibrosis during HIV-1 infection under antiretroviral therapy

Affiliations

Type I interferons and TGF-β cooperate to induce liver fibrosis during HIV-1 infection under antiretroviral therapy

James Ahodantin et al. JCI Insight. .

Abstract

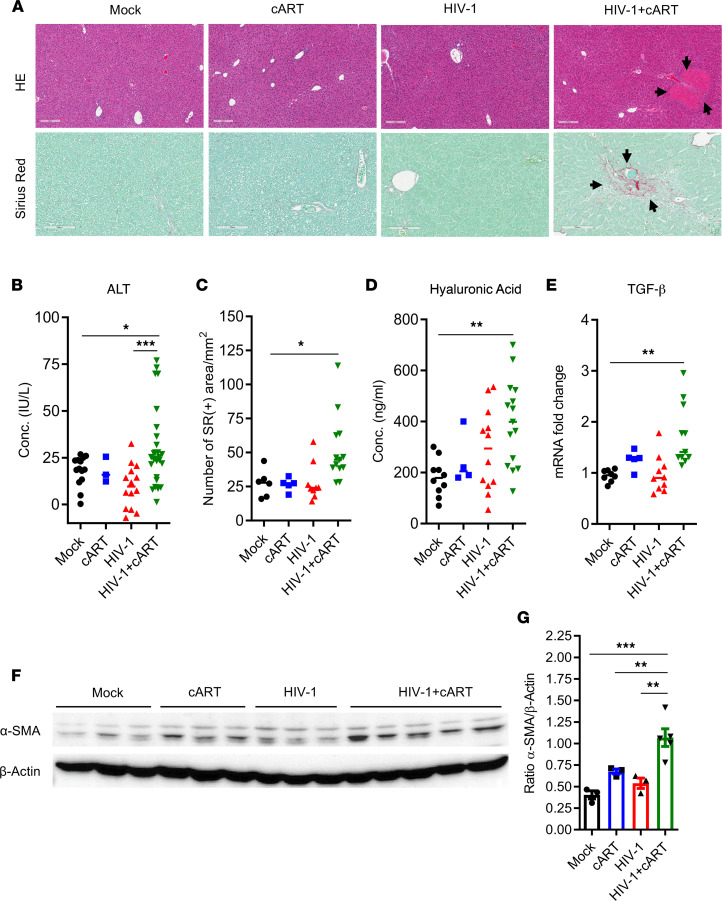
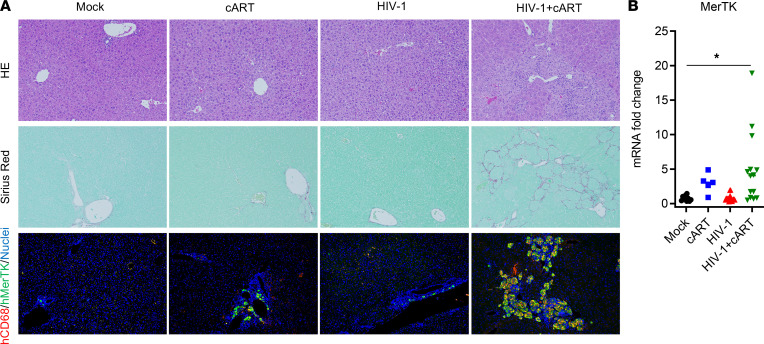
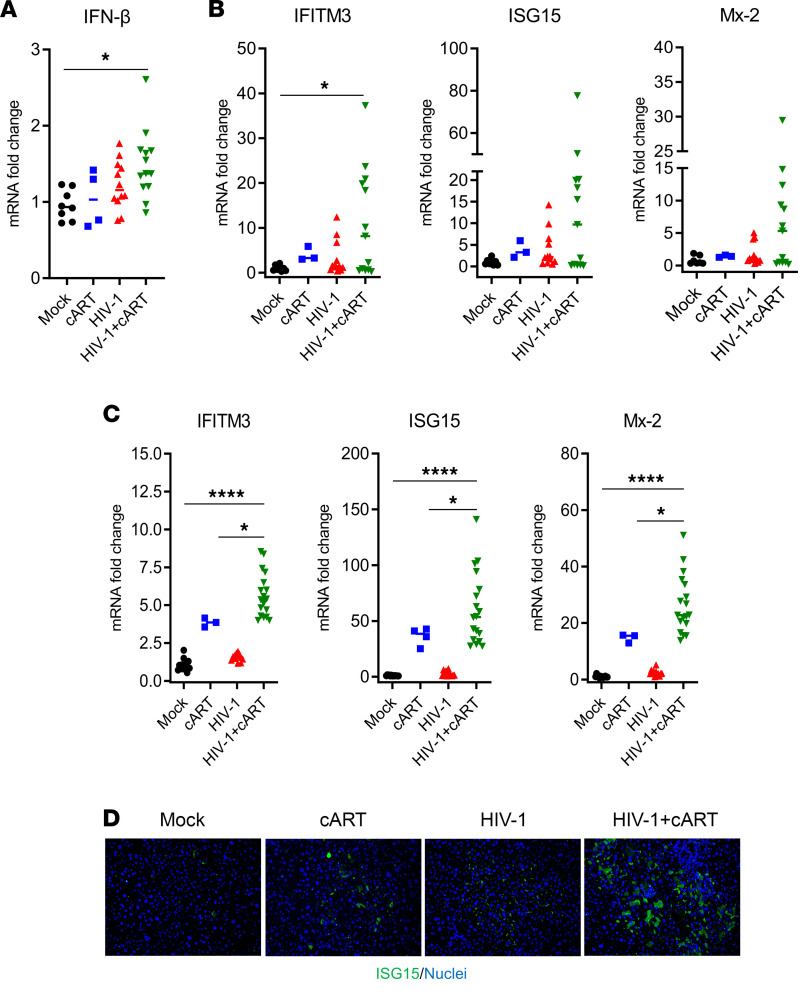
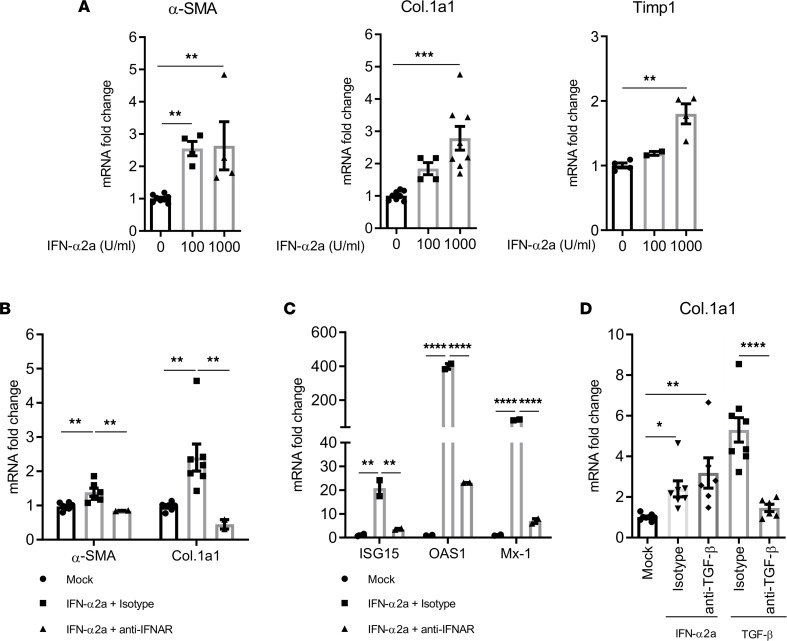
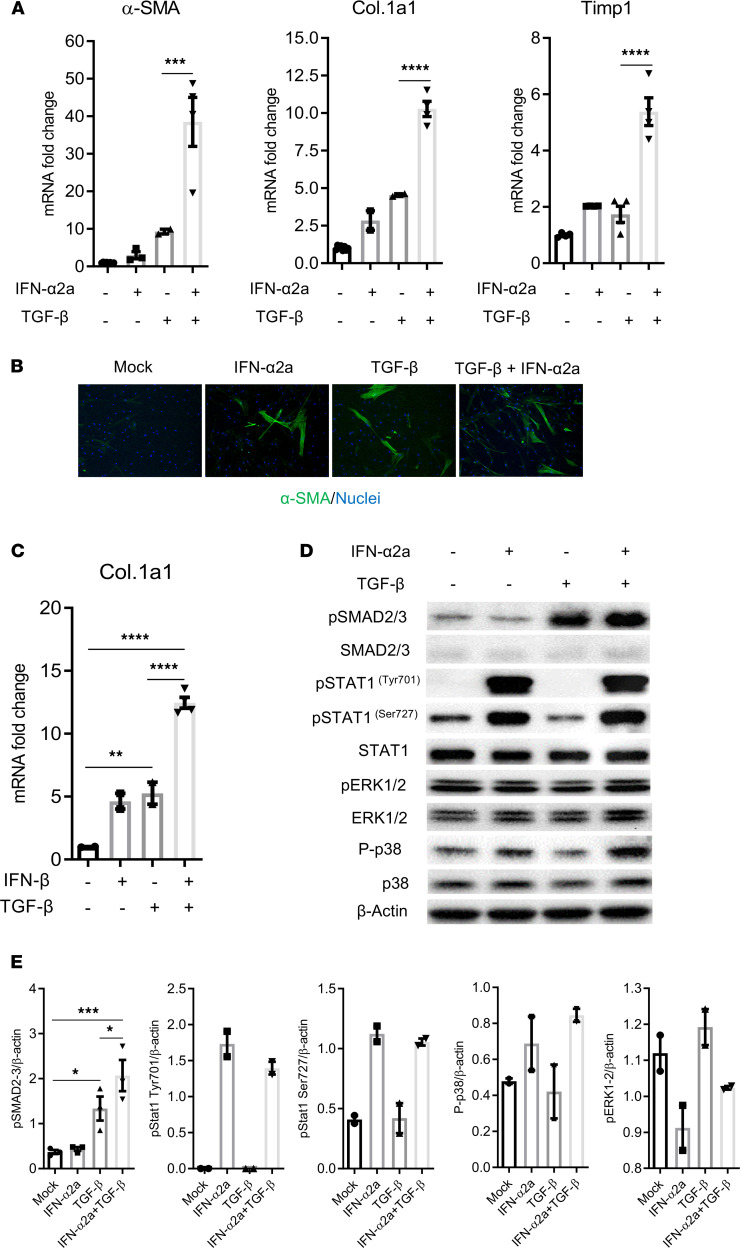
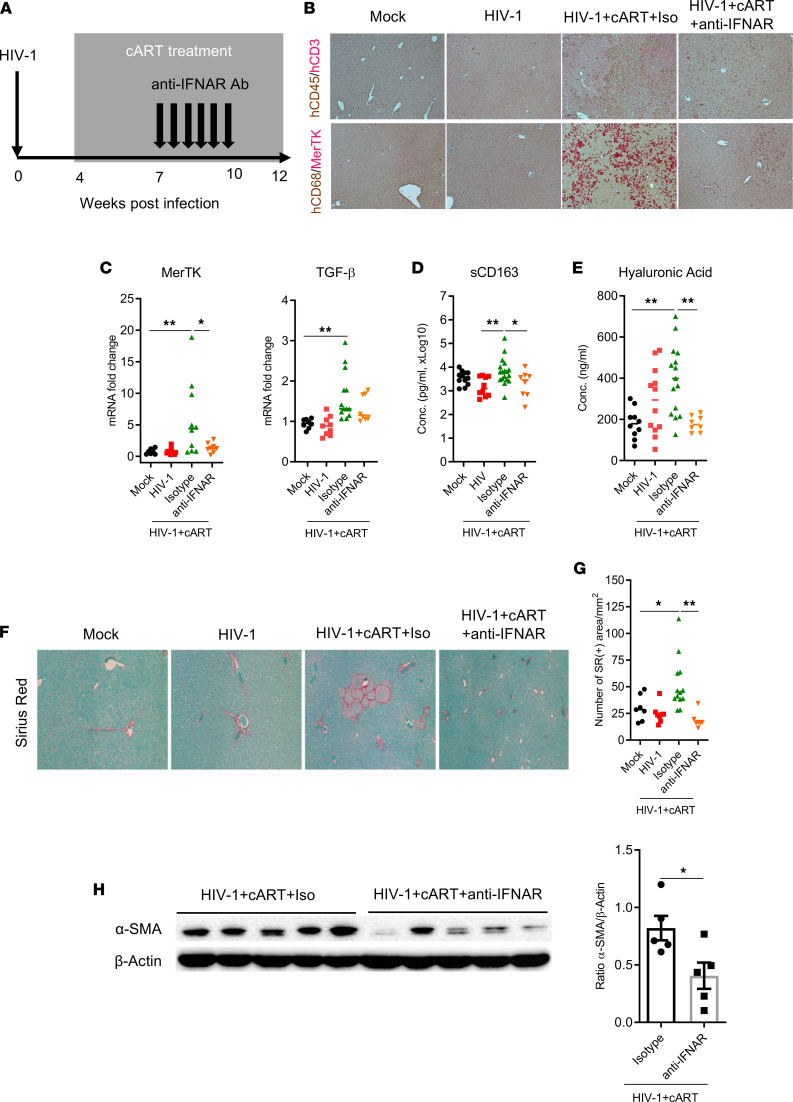
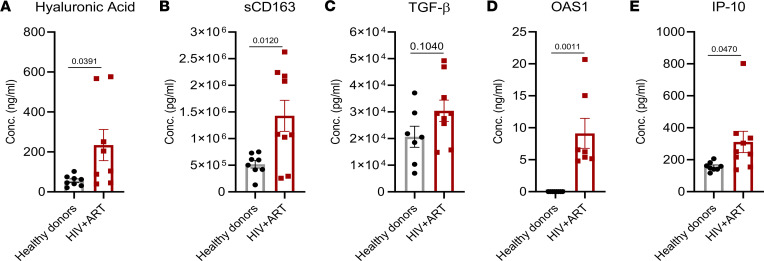
Liver diseases have become a major comorbidity health concern for people living with HIV-1 (PLWH) treated with combination antiretroviral therapy (cART). To investigate if HIV-1 infection and cART interact to lead to liver diseases, humanized mice reconstituted with progenitor cells from human fetal livers were infected with HIV-1 and treated with cART. We report here that chronic HIV-1 infection with cART induced hepatitis and liver fibrosis in humanized mice, associated with accumulation of M2-like macrophages (M2LMs), elevated TGF-β, and IFN signaling in the liver. Interestingly, IFN-I and TGF-β cooperatively activated human hepatic stellate cells (HepSCs) in vitro. Mechanistically, IFN-I enhanced TGF-β-induced SMAD2/3 activation in HepSCs. Finally, blockade of IFN-I signaling reversed HIV/cART-induced liver diseases in humanized mice. Consistent with the findings in humanized mice with HIV-1 and cART, we detected elevated markers of liver injury, M2LMs, and of IFN signaling in blood specimens from PLWH compared with those of healthy individuals. These findings identify the IFN-I/M2LM/HepSC axis in HIV/cART-induced liver diseases and suggest that inhibiting IFN-I signaling or M2LM may provide a novel therapeutic strategy for treating HIV/cART-associated liver diseases in PLWH treated with antiretroviral therapy.

Keywords: AIDS/HIV; Fibrosis; Inflammation; Macrophages; Mouse models.


Conflict of interest statement

Conflict of interest: The authors have declared that no conflict of interest exists.

Figures

Figure 1
Figure 1. HIV-1 and cART cooperatively induce liver fibrosis in hu-mice.
NRG-hu HSC mice were inoculated with PBS or HIV-1 and received cART treatment from 4 through 12 or 13 wpi. Liver tissues from mice were analyzed at 12–13 wpi. (A) H&E and SR staining (the latter for fibrosis) of liver sections. Scale bars: 200 μm (top); 100 μm (bottom). (B) ALT assessment by ELISA in blood. (C) SR/fibrosis quantification by deconvolution algorithm analysis and data are expressed as the number of SR-positive areas per square millimeter. (D) Hyaluronic acid detection in the serum. (E) Human TGF-β detection in the liver by RT-qPCR and normalized with mouse Gapdh. (F and G) Analysis of α-SMA expression by (F) immunoblot and (G) quantification, in the livers of hu-mice infected with HIV-1 and treated with cART and their littermate mock controls. Histograms represent SEM and bars in the scatter plots represent the median value. Statistical analysis was performed with 1-way ANOVA and Turkey’s or Fisher’s LSD post hoc test. *P < 0.05; **P < 0.005; ***P < 0.0005. Conc., concentration.
Figure 2
Figure 2. HIV-1 and cART induce M2-like macrophages in the liver of hu-mice.
Assessment of human immune cells infiltrated in livers of treated NRG-hu mice collected at 12–13 wpi. (A) H&E, SR, and immunofluorescence staining for human CD68 (red), MerTK (green), and nuclei (blue) in the livers of hu-mice (original magnification, ×20). (B) RT-qPCR analysis of human MerTK mRNA in the liver. Data were normalized with mouse Gapdh. Bars in the scatter plots represent the median value. Statistical analysis was performed with 1-way ANOVA and Turkey’s post hoc test. *P < 0.05.
Figure 3
Figure 3. HIV-1 and cART induce IFN-I signaling pathways in the liver of hu-mice.
Expression of ISGs in the livers of NRG-hu mice collected at 12–13 wpi. (AC) RT-qPCR analysis in the liver of (A and B) human genes (IFN-β, IFITM3, ISG15, and Mx-2) and (C) mouse genes (IFITM3, ISG15, and Mx-2), normalized with mouse Gapdh. (D) Immunofluorescence staining for human ISG15 (green) and nuclei (blue) in the liver of hu-mice (original magnification, ×20). Bars in the scatter plots represent the median value. Statistical analysis was performed with 1-way ANOVA and Turkey’s post hoc test; *P < 0.05; ****P < 0.00005.
Figure 4
Figure 4. IFN-I can directly activate primary human HepSCs.
(A) Rested primary human HepSCs were treated with different doses of IFN-α2a. RT-qPCR was performed to measure HepSC-activation genes α-SMA, Col.1a1, and Timp1. (B and C) Rested HepSCs were treated with IFN-α2a after exposure to anti-IFNAR1 Ab or isotype control. Expression of α-SMA, Col.1a1, ISG15, OAS1, and Mx-1 was detected by RT-qPCR. (D) TGF-β is not involved in IFN-α2a–induced HepSC activation. Rested HepSCs were treated with IFN-α2a or TGF-β in the presence of isotype or anti-TGF-β Ab. Expression of Col.1a1 was detected by RT-qPCR. Data were normalized with Gapdh and represent the average of 3 independent experiments; error bars indicate the SEM. Statistical analysis was performed with 1-way ANOVA and Fisher’s LSD test. *P < 0.05; **P < 0.005; ***P < 0.0005; ****P < 0.00005.
Figure 5
Figure 5. IFN-I and TGF-β synergistically activate primary human HepSCs.
(A and B) Rested HepSCs were treated with IFN-α2a (1000 U/mL) and/or TGF-β (1 ng/mL). (A) Expression of α-SMA, Col.1a1, and Timp1 was detected by RT-PCR. (B) Immunofluorescence of α-SMA (green) and nuclei (blue) in HepSCs exposed to TGF-β, IFN-α2a, and both (original magnification, ×20). (C) Rested HepSCs were treated with IFN-β (100 U/mL) and TGF-β (1 ng/mL). Expression of Col.1a1 was detected by RT-PCR. Data were normalized with Gapdh. (D and E) IFN-I increase TGF-β–induced activation of phosphorylation of SMAD2/3 in HepSCs treated with IFN-α2a and TGF-β. Rested HepSCs were treated with IFN-I and/or TGF-β for 60 minutes. (D and E) Immunoblot analysis (D) and quantification (E) of phosphorylation levels of SMAD2/3, STAT1 (Tyr701 and Ser727), p38 and ERK1/2, and of total SMAD2/3, STAT1, p38, ERK1/2, and β-actin in HepSCs. Histograms represent the average of 2–3 independent experiments; error bars indicate the SEM. Statistical analysis was performed with 1-way ANOVA and Fisher’s LSD test. *P < 0.05; **P < 0.005; ***P < 0.0005; ****P < 0.00005.
Figure 6
Figure 6. Blockade of IFN-I signaling prevents HIV/cART-induced hepatic accumulation of M2-like macrophages and liver fibrosis or diseases in hu-mice.
(A) Diagram of experimental design. Blood and liver tissues from mock- and HIV-infected NRG-hu HSC mice treated with cART were analyzed at 12–13 wpi. (B–D) Assessment of the anti–IFNAR1 Ab treatment on liver immune infiltration. (B) Liver sections were costained for human CD45/CD3 (brown/red), CD68/MerTK (brown/red) by IHC (original magnification, ×20). (C) Expression of human MerTK and TGF-β was detected in the liver by RT-qPCR; data were normalized with mouse Gapdh. (D) Soluble CD163 levels were measured in the blood of hu-mice by ELISA. (E) Quantification of hyaluronic acid in the serum by ELISA. (F–H) Decrease of liver fibrosis in animals treated with anti-IFNAR1. (F) Liver sections were stained for SR and (G) collagen deposition automatically was quantified by deconvolution algorithm analysis. (H) Immunoblot and quantification of α-SMA expression in the liver. Histograms represent the SEM; bars in the scatter plots represent the median. Statistical analysis was performed with 1-way ANOVA and Turkey’s post hoc test. *P < 0.05; **P < 0.005. Conc., concentration.
Figure 7
Figure 7. Increase in liver injury, M2-like macrophages, and ISG markers in the blood of PLWH with cART.
Liver injury and fibrosis marker (A) hyaluronic acid, M2 macrophage markers (B) soluble CD163 (sCD163) and (C) TGF-β, and IFN-stimulated genes (D) OAS1 and (E) IP-10 were assessed in plasma samples from HIV-positive individuals with stable cART and healthy individuals, by ELISA. Bars in histogram represent the SEM value. Statistical analysis was performed with an 2-tailed unpaired t test. P < 0.05 is considered significant. Conc., concentration.

Similar articles

Cited by

References

    1. Autran B, et al. Positive effects of combined antiretroviral therapy on CD4+ T cell homeostasis and function in advanced HIV disease. Science. 1997;277(5322):112–116. doi: 10.1126/science.277.5322.112. - DOI - PubMed
    1. Deeks SG. HIV infection, inflammation, immunosenescence, and aging. Annu Rev Med. 2011;62:141–155. doi: 10.1146/annurev-med-042909-093756. - DOI - PMC - PubMed
    1. Chase AJ, et al. Severe depletion of CD4+ CD25+ regulatory T cells from the intestinal lamina propria but not peripheral blood or lymph nodes during acute simian immunodeficiency virus infection. J Virol. 2007;81(23):12748–12757. doi: 10.1128/JVI.00841-07. - DOI - PMC - PubMed
    1. Wada NI, et al. The effect of HAART-induced HIV suppression on circulating markers of inflammation and immune activation. AIDS. 2015;29(4):463–471. doi: 10.1097/QAD.0000000000000545. - DOI - PMC - PubMed
    1. Pol S, et al. The negative impact of HBV/HCV coinfection on cirrhosis and its consequences. Aliment Pharmacol Ther. 2017;46(11–12):1054–1060. doi: 10.1111/apt.14352. - DOI - PubMed

Publication types

Substances