. 2022 May 31;20(5):e3001643.
doi: 10.1371/journal.pbio.3001643. eCollection 2022 May.

Adverse effects following anti-COVID-19 vaccination with mRNA-based BNT162b2 are alleviated by altering the route of administration and correlate with baseline enrichment of T and NK cell genes

Affiliations

Adverse effects following anti-COVID-19 vaccination with mRNA-based BNT162b2 are alleviated by altering the route of administration and correlate with baseline enrichment of T and NK cell genes

Ayesa Syenina et al. PLoS Biol. .

Abstract

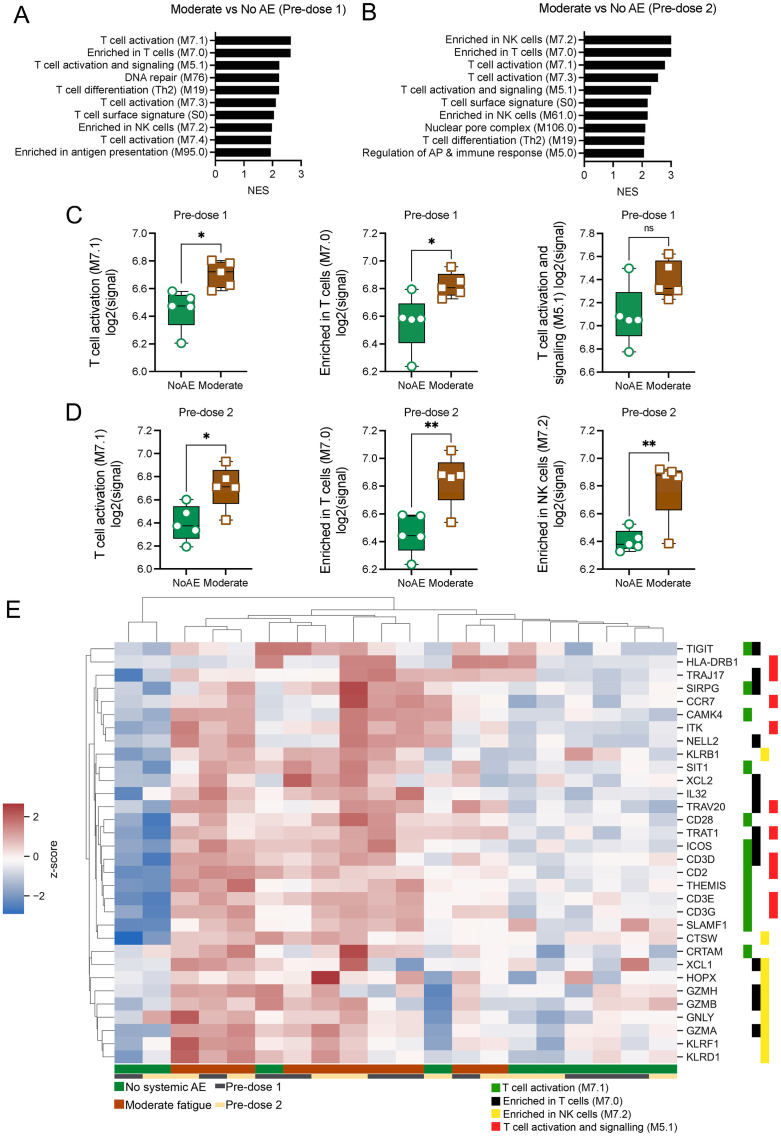
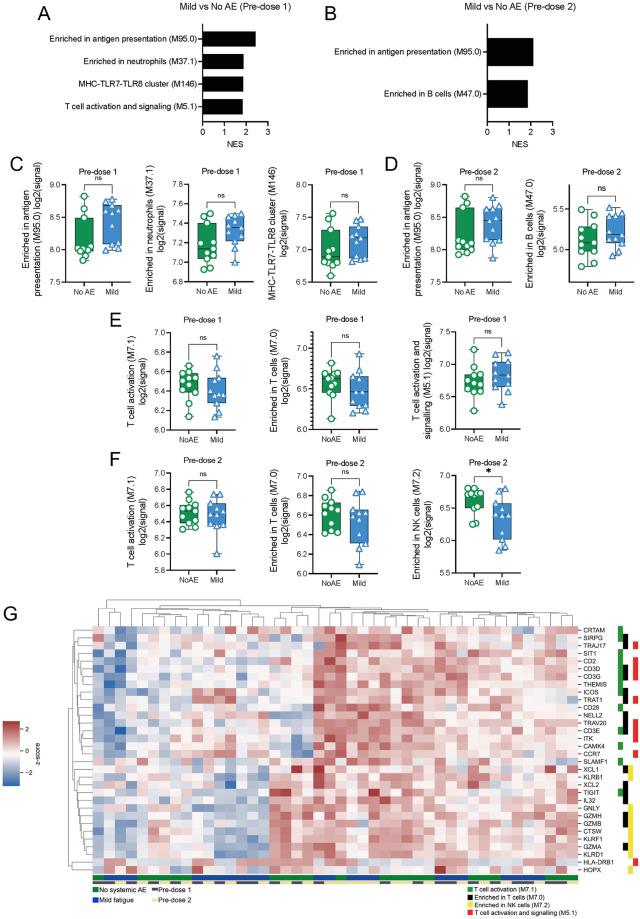
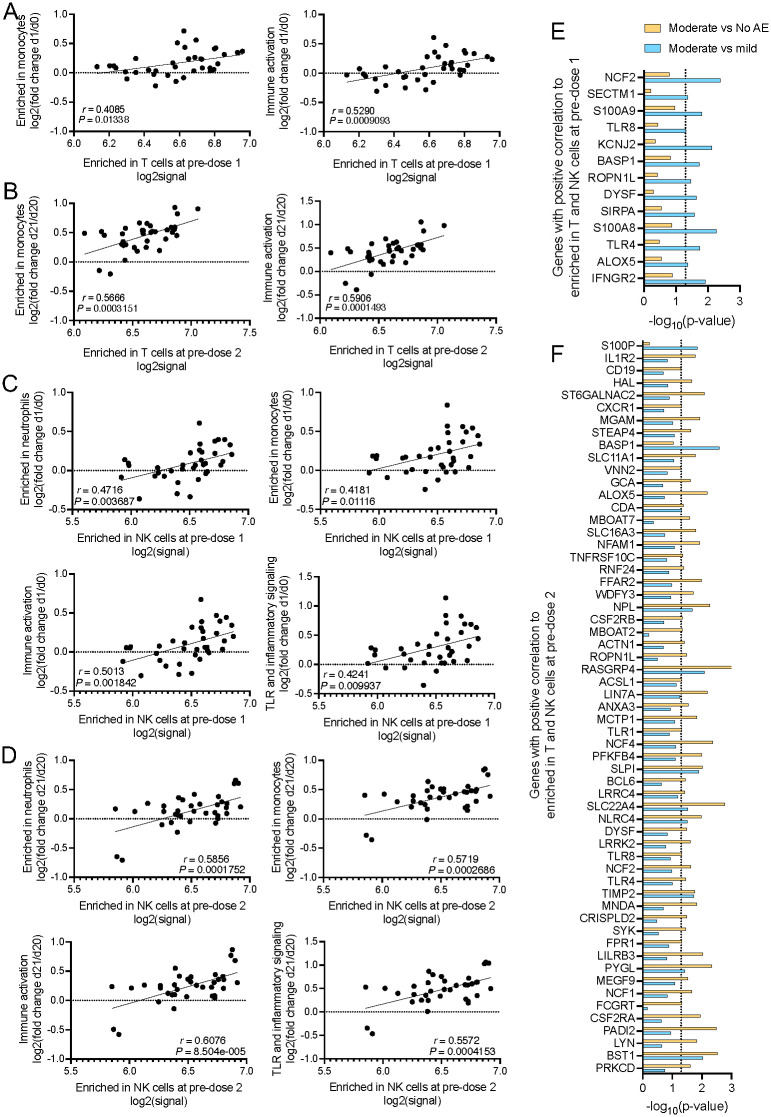
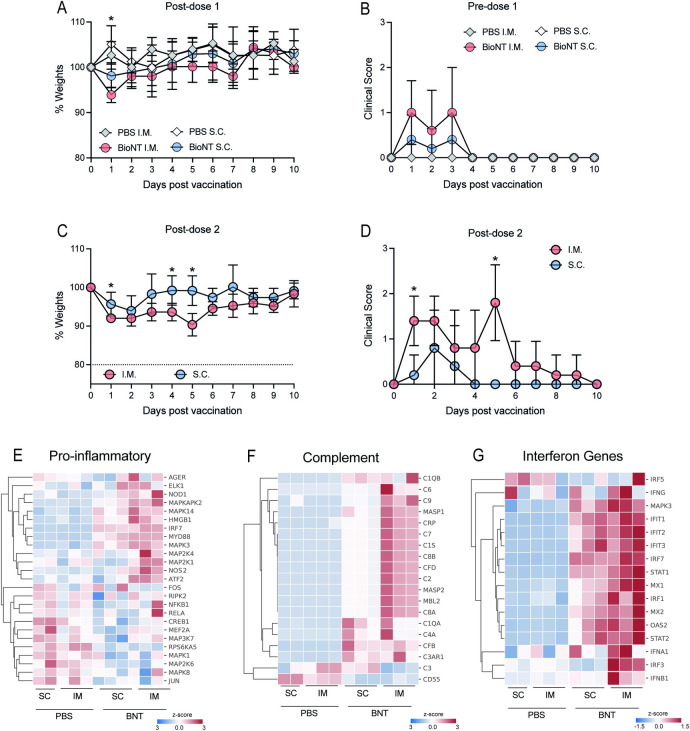
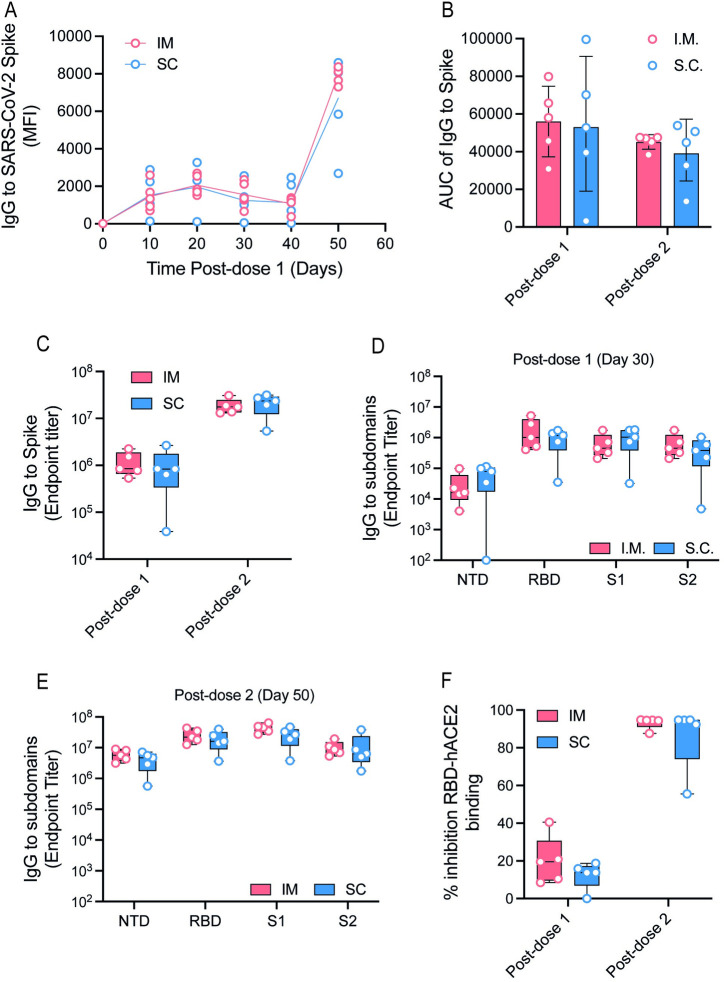
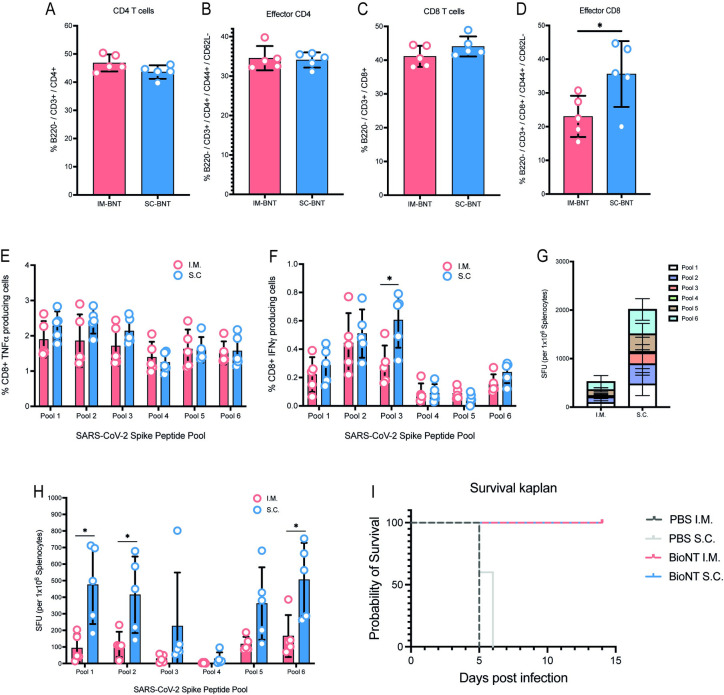
Ensuring high vaccination and even booster vaccination coverage is critical in preventing severe Coronavirus Disease 2019 (COVID-19). Among the various COVID-19 vaccines currently in use, the mRNA vaccines have shown remarkable effectiveness. However, systemic adverse events (AEs), such as postvaccination fatigue, are prevalent following mRNA vaccination, and the underpinnings of which are not understood. Herein, we found that higher baseline expression of genes related to T and NK cell exhaustion and suppression were positively correlated with the development of moderately severe fatigue after Pfizer-BioNTech BNT162b2 vaccination; increased expression of genes associated with T and NK cell exhaustion and suppression reacted to vaccination were associated with greater levels of innate immune activation at 1 day postvaccination. We further found, in a mouse model, that altering the route of vaccination from intramuscular (i.m.) to subcutaneous (s.c.) could lessen the pro-inflammatory response and correspondingly the extent of systemic AEs; the humoral immune response to BNT162b2 vaccination was not compromised. Instead, it is possible that the s.c. route could improve cytotoxic CD8 T-cell responses to BNT162b2 vaccination. Our findings thus provide a glimpse of the molecular basis of postvaccination fatigue from mRNA vaccination and suggest a readily translatable solution to minimize systemic AEs.


Conflict of interest statement

The authors have declared no competing interests exists.

Figures

Fig 1
Fig 1. Overview of study design.
Timeline of dose 1 and dose 2 vaccination and sample collection for gene expression studies, T-cell, and antibody response analysis. sVNT, surrogate virus neutralization test.
Fig 2
Fig 2. Reported local and systemic AEs following vaccination with the Pfizer-BioNTech (BNT162b2) vaccine (n = 175).
(A) Percentage of participants reporting local AEs at site of injection following dose 1 and 2 of vaccination. (B) Percentage of participants reporting systemic AEs following dose 1 and 2 of vaccination. (C) Percentage of participants reporting AEs associated with respiratory, gastrointestinal, musculoskeletal and other reported AEs that does not fall under any categories. (D) Percentage of participants reporting fatigue categorized by severity (mild and moderately severe) following dose 1 and 2 of vaccination. (E) Demographics of participants selected in the nested case control study. (F) Age of participants categorized based on fatigue severity. Data underlying this figure can be found in S1 Data. AE, adverse event.
Fig 3
Fig 3. GSEA on whole genome transcripts from participants with moderately severe fatigue and their age- and gender-matched controls reveal differences in baseline expression of genes in T and NK cell–related pathways.
Direct comparisons between moderately severe fatigue versus no systemic AE were made. Genes were preranked according to their log2FC for GSEA analysis using the BTM. (A, B) Top 10 positively enriched pathways in participants with moderately severe fatigue compared to no systemic AE at predose 1 (A) and predose 2 (B). NES values are displayed. FDR <0.05 cutoff values were imposed. (C, D) Mean log2 signal of all genes in the top enriched pathways at predose 1 (C) and predose 2 (D), categorized by participants with either moderately severe fatigue or no systemic AE. (E) Gene expression of the top 10 LEGs in the top enriched pathways at predose 1 and 2. Z scores of raw log2 signal are displayed. Data presented as means ± SD. Unpaired Student t test were used for experiments comparing 2 groups. *P < 0.05, **P < 0.01, ****P < 0.0001. n = 5 for each group. Data underlying this figure can be found in S1 Data. AE, adverse event; BTM, blood transcription module; FDR, false discovery rate; GSEA, gene set enrichment analysis; LEG, leading edge gene; NES, normalized enrichment score.
Fig 4
Fig 4. GSEA on whole genome transcripts from participants with mild fatigue showed few differences at baseline compared to their age- and gender-matched controls.
Direct comparisons between mild fatigue versus no systemic AEs were made. Genes were preranked according to their log2FC for GSEA analysis using the BTM. (A, B) Top positively enriched pathways in participants with mild fatigue compared to no systemic AE at predose 1 (A) and predose 2 (B). NES values are displayed. FDR <0.05 cutoff values were imposed. (C, D) Mean log2 signal of all genes in the top enriched pathways at predose 1 (C) and predose 2 (D), categorized by participants with either mild fatigue or no systemic AE. (E, F) Mean log2 signal of all genes in the top enriched pathways previously identified in moderately severe participants at predose 1 (E) and predose 2 (F), categorized by participants with either mild fatigue or no systemic AE. (G) Gene expression of the top 10 LEGs in the top enriched pathways at predose 1 and 2. Z scores of raw log2 signal are displayed. Data presented as means ± SD. Unpaired Student t test were used for experiments comparing 2 groups. *P < 0.05, **P < 0.01, ****P < 0.0001. n = 11 for each group. Data underlying this figure can be found in S1 Data. AE, adverse event; BTM, blood transcription module; FDR, false discovery rate; GSEA, gene set enrichment analysis; LEG, leading edge gene; NES, normalized enrichment score.
Fig 5
Fig 5. Baseline expression of T and NK cell associated genes were positively correlated with induction of immune genes at day 1 postvaccination.
GSEA (FDR < 0.05) was performed to identify enriched gene sets in gene lists where genes were ranked according to their correlation between baseline expression of positively enriched pathways and baseline-normalized log2 FC of genes at 1 day postvaccination. Total n = 32 participants. (A, B) Correlation for baseline expression of genes from the enriched in T-cells gene set and LEGs from the enriched in monocytes or immune activation gene sets at 1 day postdose 1 (A) or postdose 2 (B). (C, D) Correlation for baseline expression of genes from the enriched in NK cells gene set and LEGs from the enriched in neutrophils, enriched in monocytes, immune activation, and TLR and inflammatory signaling gene sets at 1 day postdose 1 (C) or postdose 2 (D). (E, F) P values from unpaired Student t test for LEGs in genes in all enriched pathways at 1 day postdose 1 (E) or postdose 2 (F). Only genes that are expressed at higher levels in moderately severe fatigue participants relative to those with mild fatigue and no systemic AEs are shown. Data underlying this figure can be found in S1 Data. AE, adverse event; FC, fold change; FDR, false discovery rate; GSEA, gene set enrichment analysis; LEG, leading edge gene; TLR, Toll-like receptor.
Fig 6
Fig 6. BNT162b2 vaccination via the s.c. route resulted in reduced weight loss, clinical scores and inflammation compared to vaccination via the conventional i.m. route.
(A) Weights of animals assessed for the first 10 days postdose 1. (B) Clinical scores of animals assessed for the first 10 days postdose 1. (C) Weights of animals assessed for the first 10 days postdose 2. (D) Clinical scores of animals assessed for the first 10 days postdose 2. (E–G) Expression of pro-inflammatory (E), complement (F) and IFN response (G) genes in whole blood presented as heatmap of z-scores. Data presented as means ± SD. In vivo experiments were conducted with a minimum of n = 5 per group, except for gene expression study with n = 3 per group. Unpaired Student t test was used for experiments comparing 2 groups. *P < 0.05. Data underlying this figure can be found in S1 Data. IFN, interferon; i.m., intramuscular; s.c., subcutaneous.
Fig 7
Fig 7. Vaccination induced antibody response was comparable in animals vaccinated via the s.c. as compared to i.m. routes.
(A, B) IgG against the SARS-CoV-2 Spike protein over time (A) and total AUC (B), assessed with a whole spike protein in a Luminex immune-assay (readout as MFI). (C) IgG endpoint titers to SARS-CoV-2 whole spike 30 days postdose 1 and 10 days postdose 2. (D, E) IgG endpoint titer to SARS-CoV-2 NTD, S1, S2, and RBD proteins at 30 days postdose 1 (D) and 10 days postdose 2 (E). (F) Inhibition of RBD binding to hACE2 receptor 30 days postdose 1 and 10 days postdose 2 of vaccination represented as a percentage. Data presented as means ± SD. In vivo experiments were conducted with a minimum of n = 5 per group. Unpaired Student t test was used for experiments comparing 2 groups. *P < 0.05. Data underlying this figure can be found in S1 Data. AUC, area under the curve; i.m., intramuscular; MFI, mean fluorescence intensity; NTD, N-terminal domain; RBD, receptor binding domain; SARS-CoV-2, Severe Acute Respiratory Syndrome Coronavirus 2; s.c., subcutaneous.
Fig 8
Fig 8. Superior T-cell responses generated after 2 doses of s.c. and i.m. BNT162b2 vaccination.
(A–D) CD4+ (A), effector CD4+ (B), CD8+ (C) and effector CD8+ (D) cells were assessed in spleens of vaccinated animals with surface staining for T-cell markers via flow cytometry. (E, F) TNFα CD8+ T cells (E) and IFNγ+ CD8+ T cells (F) in spleens of immunized mice 10 days postdose 2 were assessed after ex vivo stimulation with pooled Spike protein peptides and subsequent intracellular staining. (G, H) SARS-CoV-2 spike protein-specific responses to pooled Spike protein peptides were assessed with IFNγ ELISpot assay 10 days postboost. (I) Kaplan–Meier survival curve of animal challenged with live SARS-CoV-2 12 days following second dose of vaccination. Data presented as means ± SD. In vivo experiments were conducted with a minimum of n = 5 per group. Unpaired Student t test was used for experiments comparing 2 groups. *P < 0.05. Data underlying this figure can be found in S1 Data. IFNγ, interferon gamma; i.m., intramuscular; SARS-CoV-2, Severe Acute Respiratory Syndrome Coronavirus 2; s.c., subcutaneous; TNFα, tumor necrosis factor alpha.

References

    1. Huang C, Wang Y, Li X, Ren L, Zhao J, Hu Y, et al.. Clinical features of patients infected with 2019 novel coronavirus in Wuhan, China. Lancet. 2020. - PMC - PubMed
    1. Zhu N, Zhang D, Wang W, Li X, Yang B, Song J, et al.. A Novel Coronavirus from Patients with Pneumonia in China, 2019. N Engl J Med. 2020. doi: 10.1056/NEJMoa2001017 - DOI - PMC - PubMed
    1. Polack FP, Thomas SJ, Kitchin N, Absalon J, Gurtman A, Lockhart S, et al.. Safety and Efficacy of the BNT162b2 mRNA Covid-19 Vaccine. N Engl J Med. 2020;383(27):2603–15. doi: 10.1056/NEJMoa2034577 - DOI - PMC - PubMed
    1. Thomas SJ, Moreira ED Jr, Kitchin N, Absalon J, Gurtman A, Lockhart S, et al.. Safety and Efficacy of the BNT162b2 mRNA Covid-19 Vaccine through 6 Months. N Engl J Med. 2021. doi: 10.1056/NEJMoa2110345 - DOI - PMC - PubMed
    1. Chapin-Bardales J, Gee J, Myers T. Reactogenicity Following Receipt of mRNA-Based COVID-19 Vaccines. JAMA. 2021;325(21):2201–2. doi: 10.1001/jama.2021.5374 - DOI - PubMed

Publication types