. 2022 Jun 7;119(23):e2115714119.
doi: 10.1073/pnas.2115714119. Epub 2022 May 31.

Modeling the evolution of the US opioid crisis for national policy development

Affiliations

Modeling the evolution of the US opioid crisis for national policy development

Tse Yang Lim et al. Proc Natl Acad Sci U S A. .

Abstract

The opioid crisis is a major public health challenge in the United States, killing about 70,000 people in 2020 alone. Long delays and feedbacks between policy actions and their effects on drug-use behavior create dynamic complexity, complicating policy decision-making. In 2017, the National Academies of Sciences, Engineering, and Medicine called for a quantitative systems model to help understand and address this complexity and guide policy decisions. Here, we present SOURCE (Simulation of Opioid Use, Response, Consequences, and Effects), a dynamic simulation model developed in response to that charge. SOURCE tracks the US population aged ≥12 y through the stages of prescription and illicit opioid (e.g., heroin, illicit fentanyl) misuse and use disorder, addiction treatment, remission, and overdose death. Using data spanning from 1999 to 2020, we highlight how risks of drug use initiation and overdose have evolved in response to essential endogenous feedback mechanisms, including: 1) social influence on drug use initiation and escalation among people who use opioids; 2) risk perception and response based on overdose mortality, influencing potential new initiates; and 3) capacity limits on treatment engagement; as well as other drivers, such as 4) supply-side changes in prescription opioid and heroin availability; and 5) the competing influences of illicit fentanyl and overdose death prevention efforts. Our estimates yield a more nuanced understanding of the historical trajectory of the crisis, providing a basis for projecting future scenarios and informing policy planning.

Keywords: fentanyl; heroin; overdose mortality; prescription opioids; simulation modeling.


Conflict of interest statement

The authors declare no competing interest.

Figures

Fig. 1.
Fig. 1.
Overview of key transitions and feedback effects in the model. See SI Appendix, section S2 for full structure.
Fig. 2.
Fig. 2.
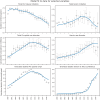
Comparison of simulated model output (blue) to historical data (gray, 95% CIs where available) for selected time-series variables. Note that “heroin” implicitly includes IMF (SI Appendix, section S2). Rx overdose deaths exclude heroin and IMF. Note the different y axis scales in the Left and Right panels. CIs for 2020 are disproportionately wide due to smaller NSDUH sample sizes during the COVID-19 pandemic. Historical data sources: NSDUH (initiation, use disorder prevalence), NVSS (overdose deaths). Full results are in SI Appendix, section S5.
Fig. 3.
Fig. 3.
(A–E) Changes in key transitions (flows) over time (Top, blue), distinguishing effects of changes in transition hazard rates (Middle, red), and source populations (Bottom, green). Bands are 95% CrIs. Source populations and hazard rates are normalized to their initial values. HUD, heroin use disorder; Rx, prescription opioid; Rx OUD, prescription opioid use disorder.
Fig. 4.
Fig. 4.
Comparison of impact of naloxone distribution and IMF on opioid overdose mortality, showing total deaths averted due to layperson naloxone (green shading), and excess deaths due to IMF (red shading). Dashed lines are observed data. Simulated deaths absent IMF (red, solid) are higher than reported deaths not involving synthetic opioids (red, dashed): in earlier years, due to prescription fentanyl, and in later years, due to attenuated risk response in the counterfactual absence of IMF.
Fig. 5.
Fig. 5.
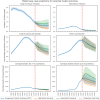
Simulated historical and projected trajectories for selected variables, under three sets of assumptions: ETC (blue), optimistic (orange), and pessimistic (green). Bands are 95% CrIs for estimated underlying values (historical portion, before 2020) and for projected reported data (after 2020); CrIs for projected reported values account for measurement noise, and hence are wider. Full results are in SI Appendix, section S5.

References

    1. Hedegaard H., Miniño A. M., Warner M., “Drug overdose deaths in the United States, 1999-2018” NCHS Data Brief No. 394 (National Center for Health Statistics, Hyattsville, MD, 2020). - PubMed
    1. Ciccarone D., Editorial for “US heroin in transition: Supply changes, fentanyl adulteration and consequences” IJDP special section. Int. J. Drug Policy 46, 107–111 (2017). - PMC - PubMed
    1. Jalal H., et al. , Changing dynamics of the drug overdose epidemic in the United States from 1979 through 2016. Science 361, eaau1184 (2018). - PMC - PubMed
    1. National Academies of Sciences Engineering and Medicine, Pain Management and the Opioid Epidemic: Balancing Societal and Individual Benefits and Risks of Prescription Opioid Use (The National Academies Press, 2017). - PubMed
    1. Jalali M. S., Botticelli M., Hwang R. C., Koh H. K., McHugh R. K., The opioid crisis: Need for systems science research. Health Res. Policy Syst. 18, 88 (2020). - PMC - PubMed

Publication types