. 2022 May 31;18(5):e1010515.
doi: 10.1371/journal.ppat.1010515. eCollection 2022 May.

Evolution, geographic spreading, and demographic distribution of Enterovirus D68

Affiliations

Evolution, geographic spreading, and demographic distribution of Enterovirus D68

Emma B Hodcroft et al. PLoS Pathog. .

Abstract

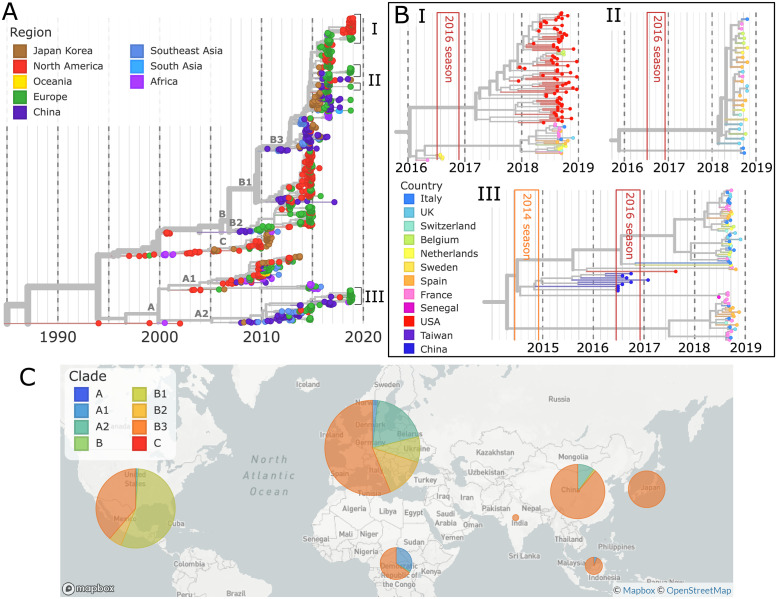
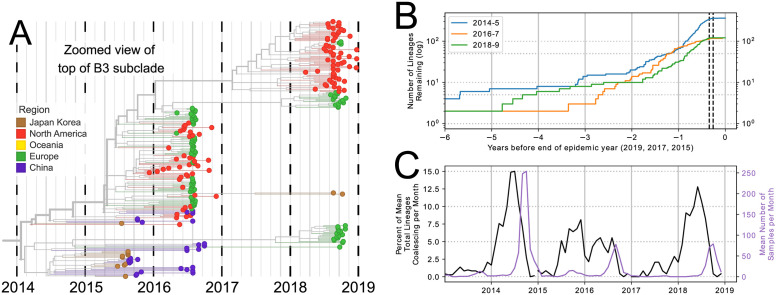
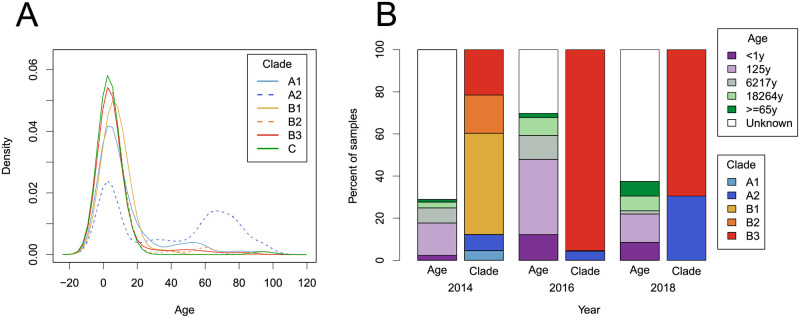
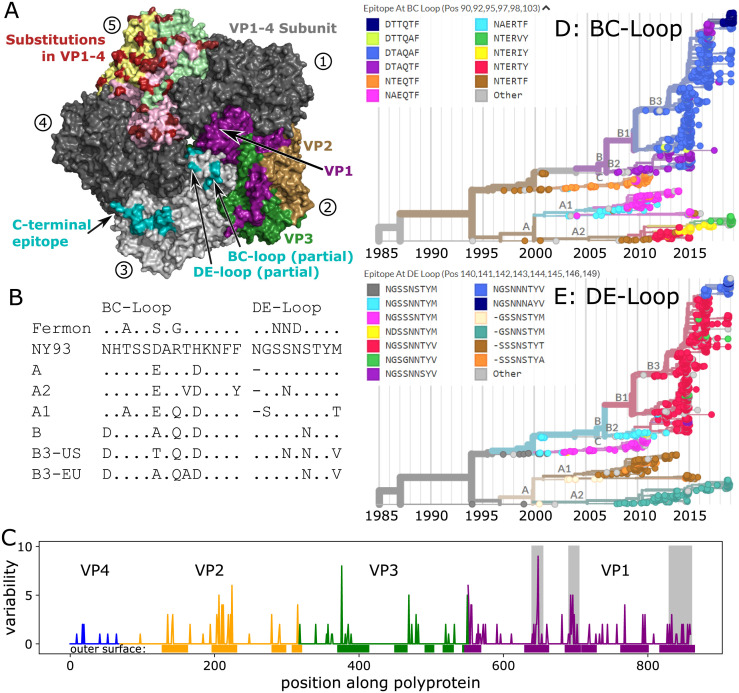
Worldwide outbreaks of enterovirus D68 (EV-D68) in 2014 and 2016 have caused serious respiratory and neurological disease. We collected samples from several European countries during the 2018 outbreak and determined 53 near full-length genome ('whole genome') sequences. These sequences were combined with 718 whole genome and 1,987 VP1-gene publicly available sequences. In 2018, circulating strains clustered into multiple subgroups in the B3 and A2 subclades, with different phylogenetic origins. Clusters in subclade B3 emerged from strains circulating primarily in the US and Europe in 2016, though some had deeper roots linking to Asian strains, while clusters in A2 traced back to strains detected in East Asia in 2015-2016. In 2018, all sequences from the USA formed a distinct subgroup, containing only three non-US samples. Alongside the varied origins of seasonal strains, we found that diversification of these variants begins up to 18 months prior to the first diagnostic detection during a EV-D68 season. EV-D68 displays strong signs of continuous antigenic evolution and all 2018 A2 strains had novel patterns in the putative neutralizing epitopes in the BC- and DE-loops. The pattern in the BC-loop of the USA B3 subgroup had not been detected on that continent before. Patients with EV-D68 in subclade A2 were significantly older than patients with a B3 subclade virus. In contrast to other subclades, the age distribution of A2 is distinctly bimodal and was found primarily among children and in the elderly. We hypothesize that EV-D68's rapid evolution of surface proteins, extensive diversity, and high rate of geographic mixing could be explained by substantial reinfection of adults. Better understanding of evolution and immunity across diverse viral pathogens, including EV-D68 and SARS-CoV-2, is critical to pandemic preparedness in the future.


Conflict of interest statement

The authors have declared that no competing interests exist.

Figures

Fig 1
Fig 1. Time-scaled phylogeny of Enterovirus D68.
A) A time-scaled phylogeny of VP1 segments, colored by region, is shown top-left. B) Key clusters (I, II, III), the largest from the 2018 season, are highlighted, colored by country. To display these clusters at a high resolution, the whole genome phylogenies are used. The 2014 and 2016 EV-D68 seasons are shown in orange and red boxes. C) A map shows the distribution of subclades by region from 2014–2018. Map from Mapbox and OpenStreetMap.
Fig 2
Fig 2. Persistence and diversification of EV-D68 since 2014.
Multiple EV-D68 lineages persist from one biennial outbreak to another. (A) Zoomed-in view of the whole genome EV-D68 tree (for better time-resolution), showing 2018 subgroups in the B3 subclade. (B) Lineages which are ancestral to all of the samples in the 2014, 2016, and 2018 seasons diversify over time. The dotted black lines show the IQR of all samples taken during 2014, 2016, and 2018. (C) The change in number of lineages (as % of total lineages) per month for each season (left y-axis) and the mean number of samples per month (right y-axis).
Fig 3
Fig 3. Age distribution of EV-D68 samples.
(A) The cumulative distribution over age separated by subclade; A2 being significantly more often detected in older persons. (B) The age of patients and subclade of their sample, for samples taken during 2014, 2016, and 2018 for which ‘age range 1’ (see section D of S1 Text) was available.
Fig 4
Fig 4. Molecular evolution of the EV-D68 capsid.
Panel A) Rendering of 5-fold symmetric arrangement of the crystal structure of the capsid protomer consisting of VP1, VP2, VP3 and VP4 [41], using different copies of the protomer to highlight different aspects of the capsid organization, evolution, and immunogenicity. The five subunits are labelled 1–5 (circled numbers). Subunits 1 and 4 are present in dark grey to complete the structure. Subunit 2 shows the surface exposed proteins in purple (VP1), sand (VP2), and green (VP3), subunit 3 displays the different putative epitopes [42] (note that the most variable parts of the BC- and DE-loops are not shown, as their structure is not resolved), and subunit 5 highlights variable positions in red, with the different proteins forming the surface indicated by pale colors. Panel B) The hypervariable BC- and DE-loops (partly missing from the structure in Panel A) in clusters and subclusters accumulated multiple changes since the root of the tree (the inferred root sequence patterns match those of the NY93 strain shown here). (BC-loop is AA positions 90–103; DE-loop is AA positions 140–148). Patterns for the C-terminus and a region of VP2 are shown in S2 Table. Panel C) Variable positions often fall into surface exposed parts of the protein (Fisher exact test, OR = 6, p < 10−16). Genes are highlighted by blue (VP4), orange (VP2), green (VP3), and purple (VP1). Grey boxes show, from left to right, the BC- and DE-loops, and C-terminus regions. Panels D&E) Phylogenetic VP1 trees are colored by the most common epitope patterns of the 6 and 8 most variable amino-acid positions in the BC- and DE-loops, respectively. Particularly note-worthy is the rapid turnover of BC-loop variants in the recent evolution of the A2 subclade. Patterns for the C-terminus region are shown in S6 Fig. See S8 Fig for a zoomed version of panels D & E with cumulative AA changes.

References

    1. Holm-Hansen CC, Midgley SE, Fischer TK. Global emergence of enterovirus D68: a systematic review. The Lancet Infectious Diseases. 2016;16(5):e64–e75. doi: 10.1016/S1473-3099(15)00543-5 - DOI - PubMed
    1. Hixon AM, Frost J, Rudy MJ, Messacar K, Clarke P, Tyler KL. Understanding Enterovirus D68-Induced Neurologic Disease: A Basic Science Review. Viruses. 2019;11(9). doi: 10.3390/v11090821 - DOI - PMC - PubMed
    1. Schieble JH, Fox VL, Lennette EH. A probable new human picornavirus associated with respiratory disease. American journal of epidemiology. 1967;85(2):297–310. doi: 10.1093/oxfordjournals.aje.a120693 - DOI - PubMed
    1. Centers for Disease Control and Prevention (CDC). Clusters of acute respiratory illness associated with human enterovirus 68–Asia, Europe, and United States, 2008-2010. MMWR Morbidity and mortality weekly report. 2011;60(38):1301–1304. - PubMed
    1. Khetsuriani N, Lamonte-Fowlkes A, Oberst S, Pallansch MA, Centers for Disease Control and Prevention. Enterovirus surveillance–United States, 1970-2005. Morbidity and Mortality Weekly Report Surveillance Summaries (Washington, DC: 2002). 2006;55(8):1–20. - PubMed

Publication types