. 2022 Dec 1;24(12):2133-2145.
doi: 10.1093/neuonc/noac143.

Comparative single-cell RNA-sequencing profiling of BMP4-treated primary glioma cultures reveals therapeutic markers

Affiliations

Comparative single-cell RNA-sequencing profiling of BMP4-treated primary glioma cultures reveals therapeutic markers

Iris S C Verploegh et al. Neuro Oncol. .

Abstract

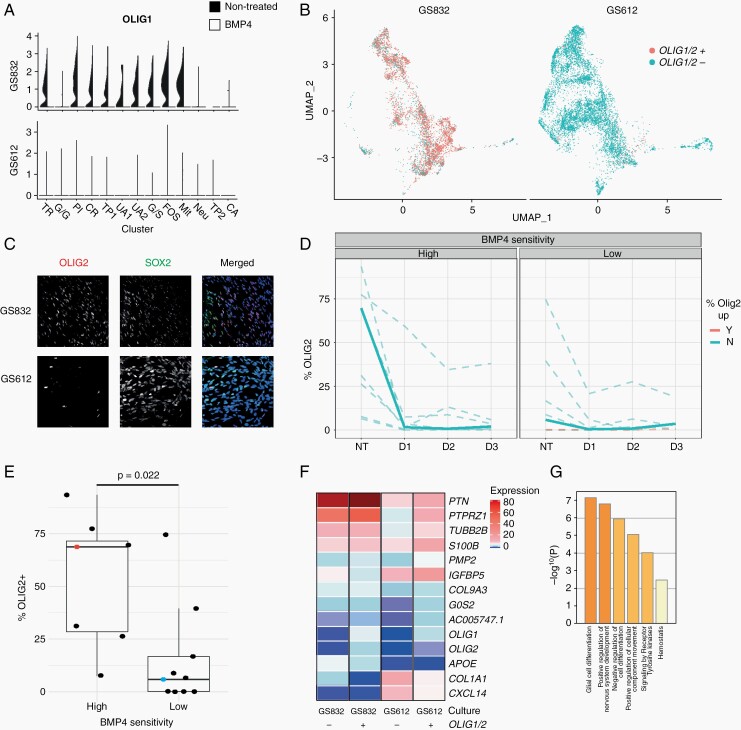
Background: Glioblastoma (GBM) is the most aggressive primary brain tumor. Its cellular composition is very heterogeneous, with cells exhibiting stem-cell characteristics (GSCs) that co-determine therapy resistance and tumor recurrence. Bone Morphogenetic Protein (BMP)-4 promotes astroglial and suppresses oligodendrocyte differentiation in GSCs, processes associated with superior patient prognosis. We characterized variability in cell viability of patient-derived GBM cultures in response to BMP4 and, based on single-cell transcriptome profiling, propose predictive positive and early-response markers for sensitivity to BMP4.

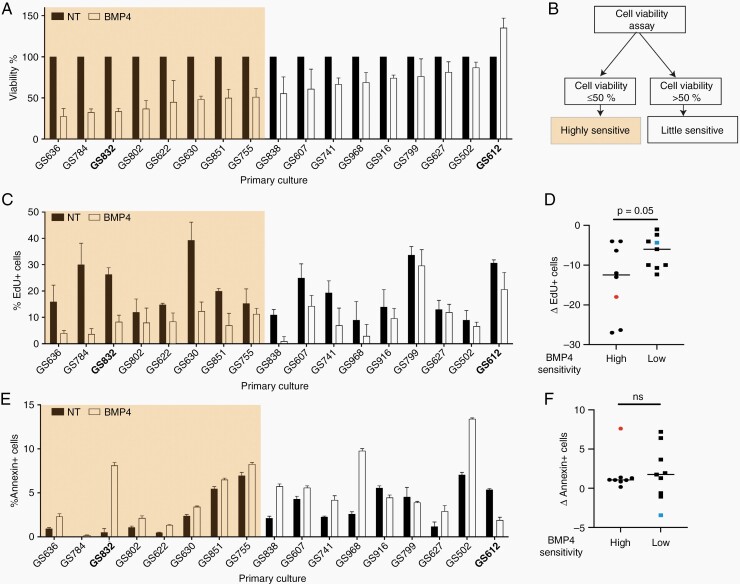
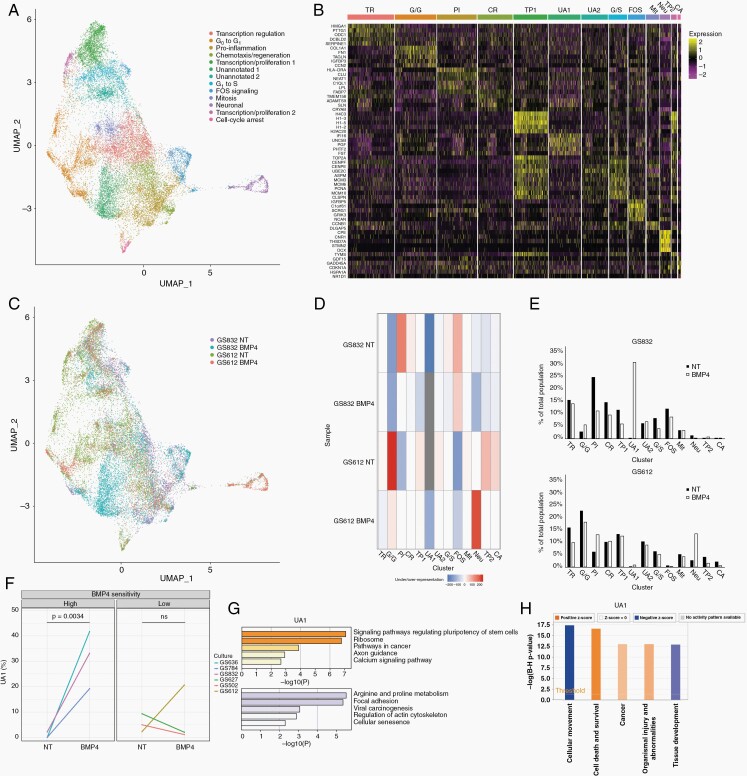
Methods: Cell viability was assessed in 17 BMP4-treated patient-derived GBM cultures. In two cultures, one highly-sensitive to BMP4 (high therapeutic efficacy) and one with low-sensitivity, response to treatment with BMP4 was characterized. We applied single-cell RNA-sequencing, analyzed the relative abundance of cell clusters, searched for and identified the aforementioned two marker types, and validated these results in all 17 cultures.

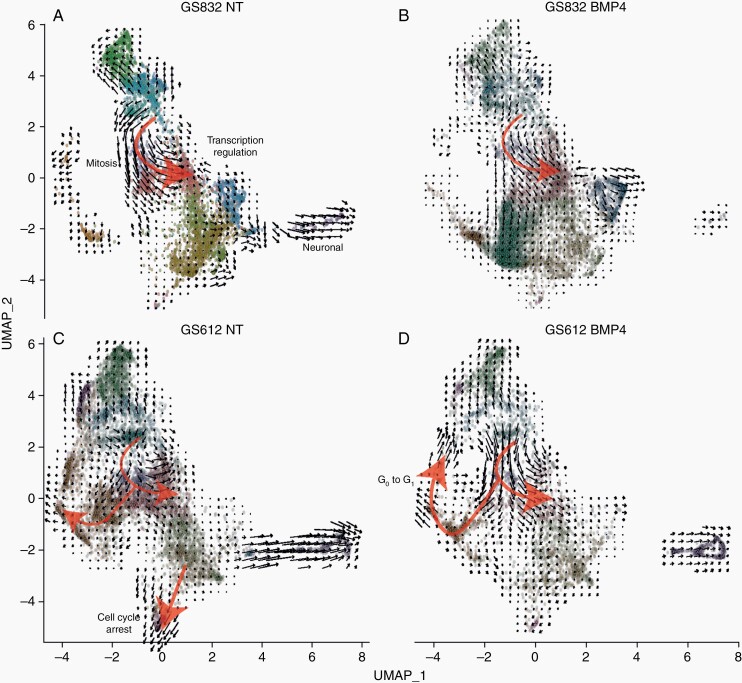
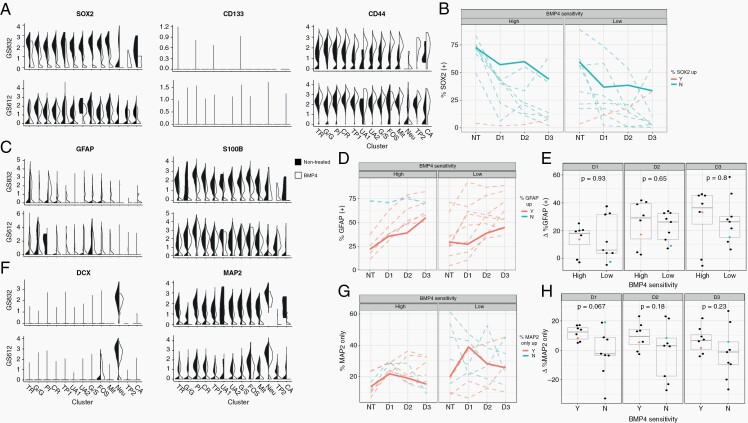
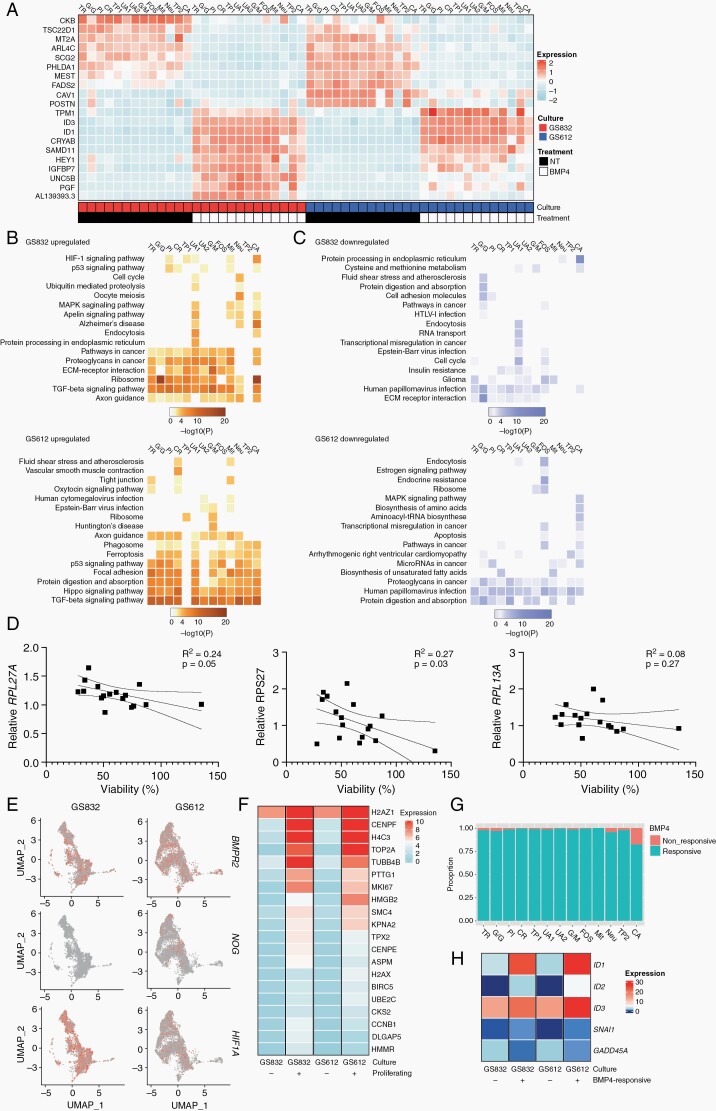
Results: High variation in cell viability was observed after treatment with BMP4. In three cultures with highest sensitivity for BMP4, a substantial new cell subpopulation formed. These cells displayed decreased cell proliferation and increased apoptosis. Neuronal differentiation was reduced most in cultures with little sensitivity for BMP4. OLIG1/2 levels were found predictive for high sensitivity to BMP4. Activation of ribosomal translation (RPL27A, RPS27) was up-regulated within one day in cultures that were very sensitive to BMP4.

Conclusion: The changes in composition of patient-derived GBM cultures obtained after treatment with BMP4 correlate with treatment efficacy. OLIG1/2 expression can predict this efficacy, and upregulation of RPL27A and RPS27 are useful early-response markers.

Keywords: BMP; drug therapy; glioblastoma; single-cell RNA-sequencing; tumor heterogeneity.


Figures

Fig. 1.
Fig. 1.
Cell viability after treatment with BMP4. (A) Average cell viability with standard deviation 7 days post-treatment with 60 ng BMP4/ml normalized to untreated (NT) cells (n = 3). Cultures used for single-cell analysis are in bold. (B) Flow-chart of stratification into the ‘highly sensitive or the “little sensitive” cultures. (C) Mean percentage with standard deviation of EdU-positive (EdU+) cells after 2 days of 60 ng BMP/ml (n = 3). (D) Mean difference in EdU+ cells after treatment with BMP4. (F) Mean percentage with standard deviation of Annexin-V+ cells after 4 days of 60 ng BMP4/ml (n = 3). (G) Mean difference of Annexin+ cells after treatment. ns = Not-significant. In E and F, the orange and blue square indicate single-cell sequenced tumors GS832 and GS612.
Fig. 2.
Fig. 2.
Single-cell transcriptomes of BMP4 treated patient-derived cultures. (A) UMAP embedding of single cells from two (un)treated GBM cultures. Clusters of transcriptionally similar cells are colored and labeled by ontology. (B) Heatmap of top-5 uniquely expressed genes per cluster. TR = Transcription regulation, G/G = G0 to G1, PI = Pro-inflammation, CR = Chemotaxis/regeneration, TP = Transcription/proliferation, UA = Unannotated, G/S = G1 to S, FOS = FOS signaling, Mit = Mitosis, Neu = Neuronal, CA = Cell-cycle arrest. (C) UMAP colored by sample. (D) Heatmap of the representation of each sample per cluster as determined by hypergeometric testing. (E) Proportion of each subpopulation per sample before and after treatment with BMP4 in GS832 (top panel) and GS612 (bottom panel). (F) Percentage of cells belonging to UA1 in the RNA-scope analysis before (NT) and after treatment with BMP4. ns = Not-significant (G) Enriched KEGG pathways of upregulated (orange) and downregulated genes (purple) in UA1. (H) Ingenuity Pathway Analysis of enriched biological functions ordered by adjusted P-value and filled according to z-score (activation) of UA1.
Fig. 3.
Fig. 3.
UMAP embedding of (un)treated GBM cells with the black arrows showing RNA velocities and red arrows highlighting the main trajectories in untreated (A) treated (B) BMP4 highly-sensitive GS832 and of untreated (C) and treated (D) little-sensitive GS612.
Fig. 4.
Fig. 4.
Lineages of GSC differentiation. (A) Violin plots depicting normalized mean and variance of glioma stemness-associated genes SOX2, CD133 and CD44 in the culture with high (GS832, left) and low (GS612, right) BMP4-sensitivity. The black side of the violin plots represents the non-treated cultures, and the white side the BMP4-treated cultures. The subsequent panels display the mean percentage of SOX2+ (B), GFAP+ (D) and MAP2+ (G) cells, as determined by indirect immunofluorescence staining (n = 5) of untreated cultures (NT), or after 1 day (D1), 2 days (D2) or 3 days (D3) of treatment with BMP4. The bold unbroken lines indicate the highly BMP4-sensitive GS832 and the little-sensitive GS612. Upregulation after 3 days of treatment is shown in red, while downregulation is depicted in blue. (C) Violin plots depicting normalized mean and variance of astrocyte markers GFAP and S100B. Boxplots of the difference in percentage GFAP+ (E) and MAP2+ cells (H). The orange and blue dot represent GS832 and GS612. (F) Violin plots depicting normalized mean and variance of neuronal lineage markers DCX and MAP2.
Fig. 5.
Fig. 5.
OLIG1/2 predicts in vitro therapeutic efficacy of BMP4. (A) Violin plots depicting mean and variance of oligodendroglial lineage markers in highly BMP4-sensitive GS832 (top) and little-sensitive GS612 (bottom). The black side represents the non-treated, and the white side the BMP4-treated cultures. (B) UMAP of untreated cells discriminated based on scaled OLIG1 or OLIG2 (≥0.75 red; <0.75 blue) expression of cultures GS832 (left) and GS612 (right). (C) Representative images of untreated cultures stained for OLIG2 (red), SOX2 (green) and DAPI (blue). (D) Percentage of SOX2+ cells. NT (untreated), D1 (day 1), D2 (day 2), D3 (day 3). The bold lines represent GS832 (high-sensitivity) and GS612 (low-sensitivity). Loss of OLIG2+ cells after 3 days of BMP4 is colored blue, and gain red. (E) Percentage of OLIG2+ cells expressing related to dichotomized (viability <50% after 7 days of BMP4) sensitivity. (F) Scaled expression of differentially expressed genes between OLIG1/2+ and OLIG1/2- cells. (G) Overrepresented gene ontologies in differentially expressed genes mentioned in (F).
Fig. 6.
Fig. 6.
Subpopulation-specific responses to treatment with BMP4. (A) Expression of the 10 most differentially expressed genes after treatment with BMP4 in GS832 (red) and GS612 (blue). NT = untreated. Heatmap of enriched KEGG pathways for upregulated (B) and downregulated (C) genes after treatment with BMP4 in GS832 (top panel) and GS612 (bottom panel). (D) Correlation with standard deviation of mean relative expression of ribosomal translation genes after 24 h treatment with BMP4 normalized to GAPDH and relative to untreated cells, compared to viability after 7 days of treatment with BMP4 (n = 3). (E) Top-20 differentially expressed genes in proliferating vs non-proliferating cells after BMP4. (F) Proportion of cells per cluster that do not upregulate ID1 and ID2 (non-responsive) vs those that do (responsive) after BMP4. (G) Heatmap illustrating the anti-correlation of GADD45A with ID1 and ID2. (H) Expression of BMPR2, NOG and HIG1A in untreated cultures GS832 and GS612.

References

    1. Ostrom QT, Gittleman H, Fulop J, et al. . CBTRUS statistical report: primary brain and central nervous system tumors diagnosed in the United States in 2008–2012. Neuro-oncology. 2015;17(Suppl 4):iv1–iv62. - PMC - PubMed
    1. Di Carlo DT, Cagnazzo F, Benedetto N, Morganti R, Perrini P. Multiple high-grade gliomas: epidemiology, management, and outcome. A systematic review and meta-analysis. Neurosurg Rev. 2019;42(2):263–275. - PubMed
    1. Dirkse A, Golebiewska A, Buder T, et al. . Stem cell-associated heterogeneity in Glioblastoma results from intrinsic tumor plasticity shaped by the microenvironment. Nat Commun. 2019;10(1):1787. - PMC - PubMed
    1. Lathia JD, Mack SC, Mulkearns-Hubert EE, Valentim CL, Rich JN. Cancer stem cells in glioblastoma. Genes Dev. 2015;29(12):1203–1217. - PMC - PubMed
    1. Galli R, Binda E, Orfanelli U, et al. . Isolation and characterization of tumorigenic, stem-like neural precursors from human glioblastoma. Cancer Res. 2004;64(19):7011–7021. - PubMed

Publication types

MeSH terms