. 2022 Jun 10;50(10):5652-5671.
doi: 10.1093/nar/gkac408.

The topoisomerase 3 zinc finger domain cooperates with the RMI1 scaffold to promote stable association of the BTR complex to recombination intermediates in the Caenorhabditis elegans germline

Affiliations

The topoisomerase 3 zinc finger domain cooperates with the RMI1 scaffold to promote stable association of the BTR complex to recombination intermediates in the Caenorhabditis elegans germline

Maria Rosaria Dello Stritto et al. Nucleic Acids Res. .

Abstract

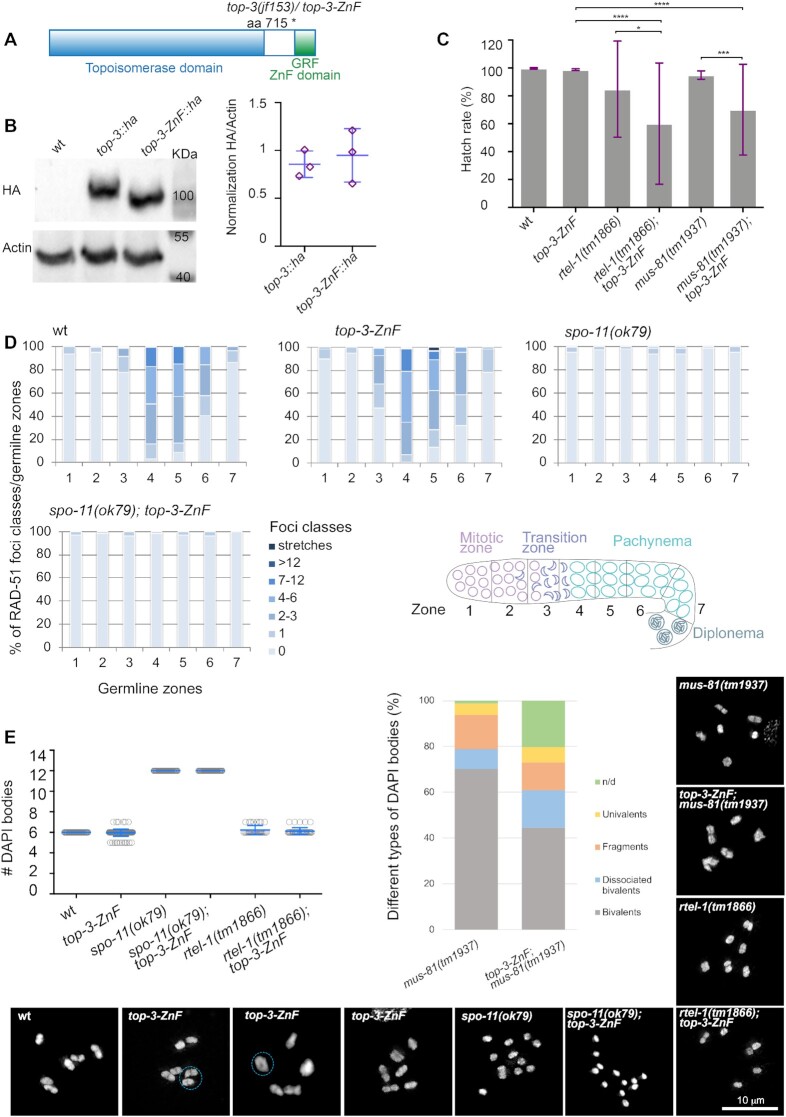
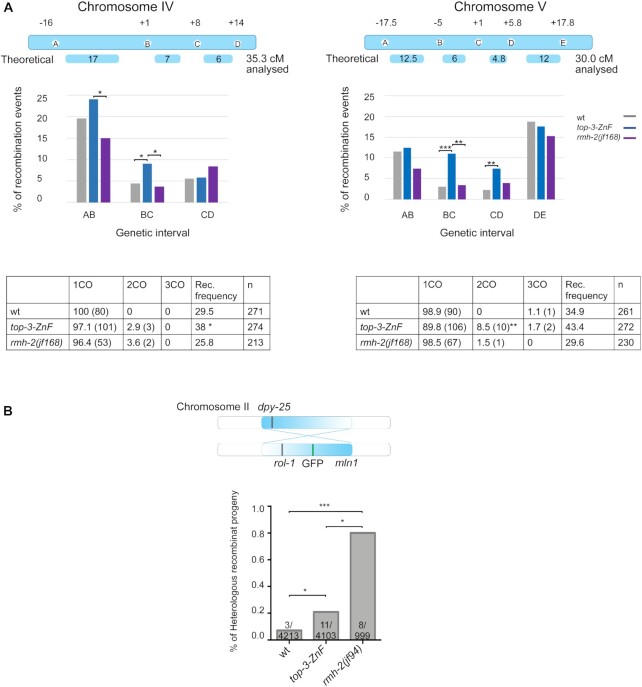
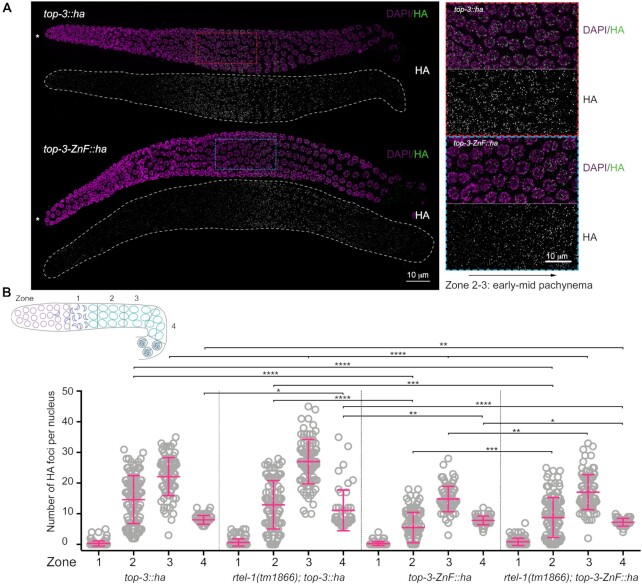
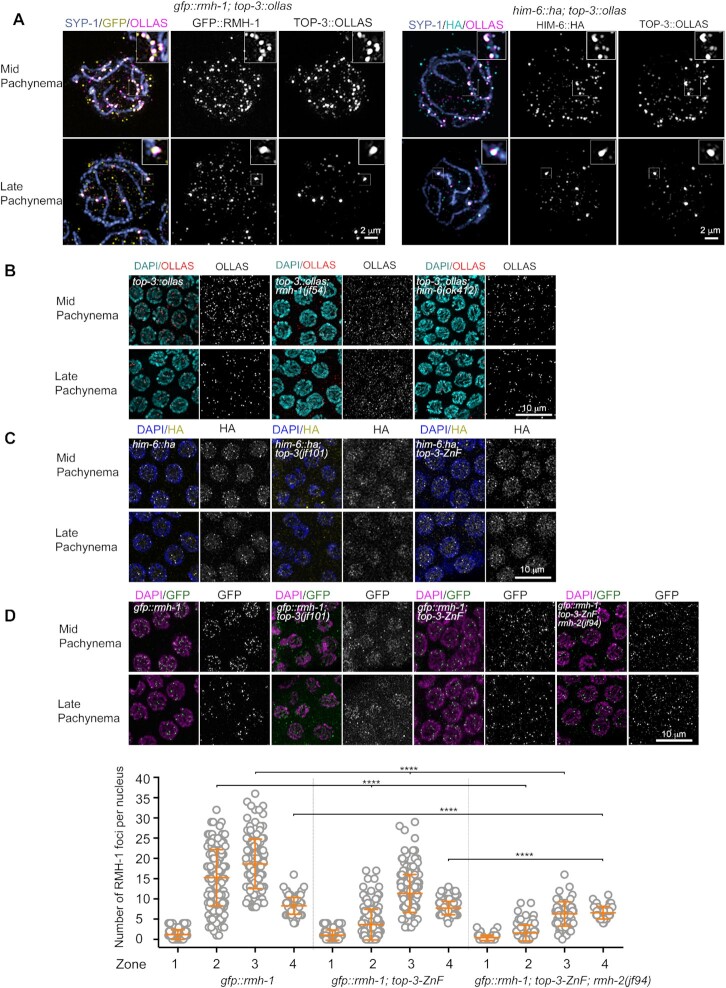
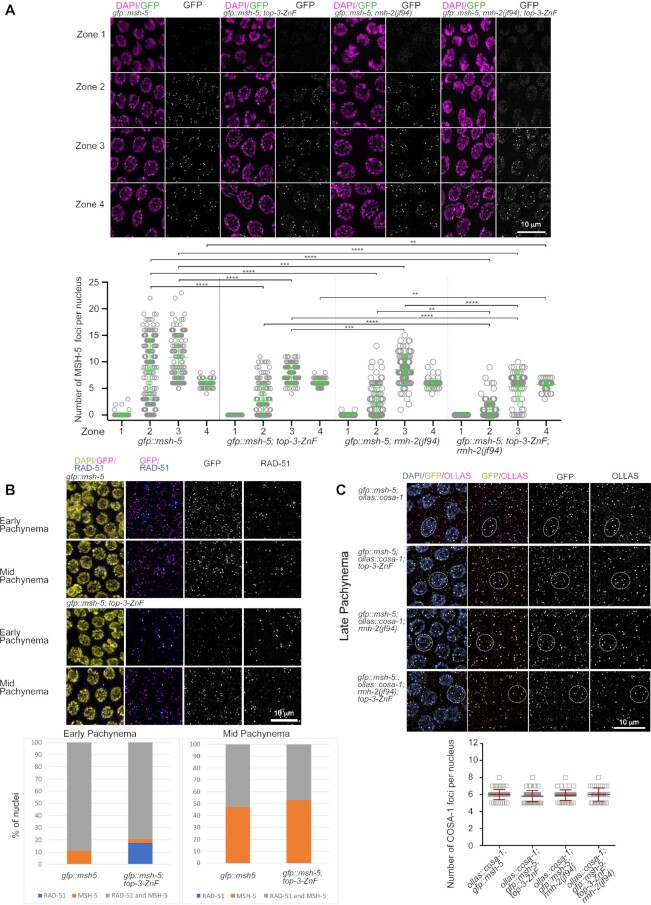
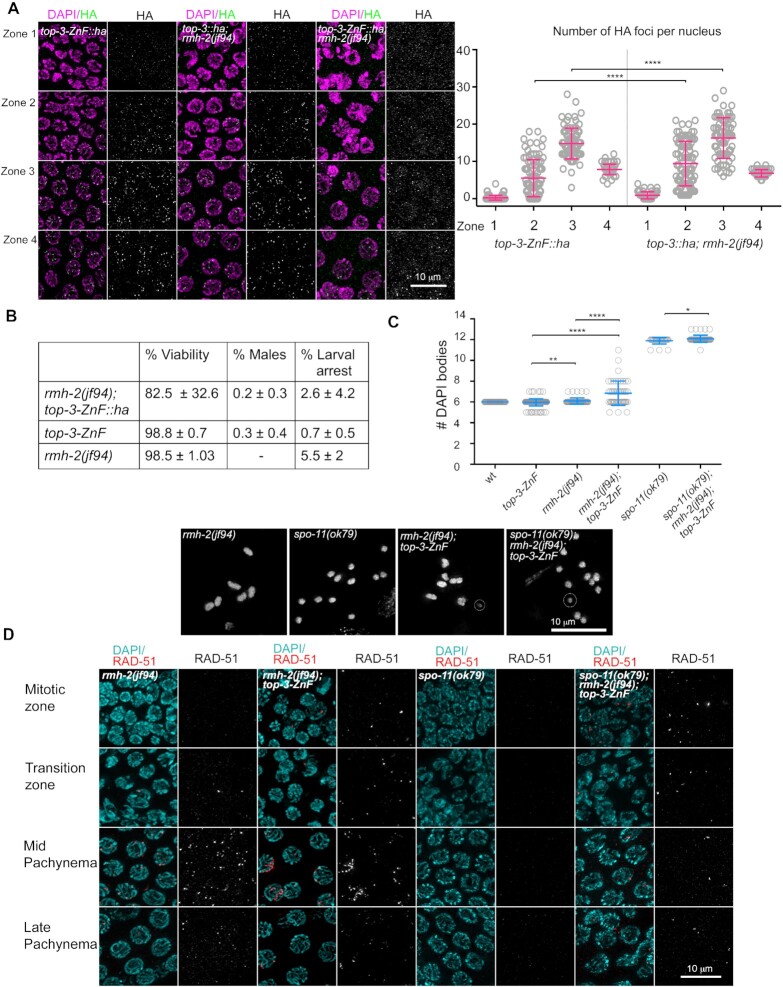
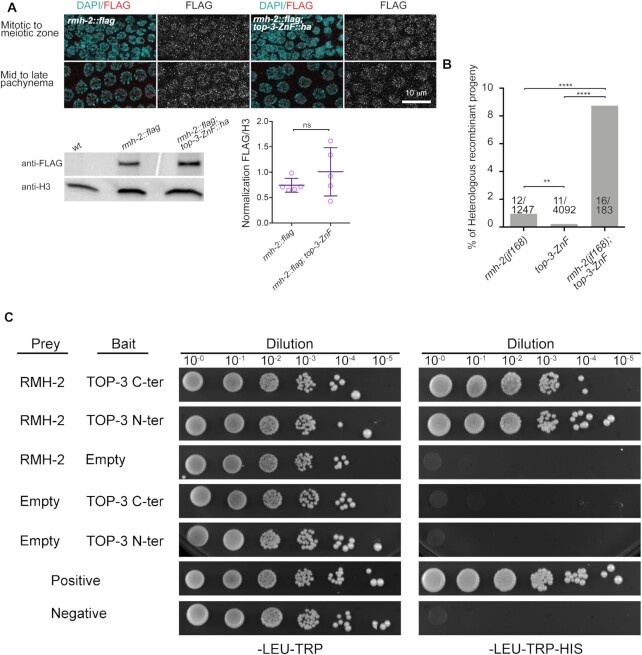
Homologous recombination is the predominant DNA repair pathway used in the gonad. Of the excess DNA double-strand breaks formed in meiosis, only a subset matures into crossovers, with the remainder repaired as non-crossovers. The conserved BTR complex (comprising Bloom helicase, topoisomerase 3 and RMI1/2 scaffold proteins) acts at multiple steps during recombination to dismantle joint DNA molecules, thereby mediating the non-crossover outcome and chromosome integrity. Furthermore, the complex displays a role at the crossover site that is less well understood. Besides catalytic and TOPRIM domains, topoisomerase 3 enzymes contain a variable number of carboxy terminal zinc finger (ZnF) domains. Here, we studied the Caenorhabditis elegans mutant, in which the single ZnF domain is deleted. In contrast to the gene disruption allele, the top-3-ZnF mutant is viable, with no replication defects; the allele appears to be a hypomorph. The TOP-3-ZnF protein is recruited into foci but the mutant has increased numbers of crossovers along its chromosomes, with minor defects in repressing heterologous recombination, and a marked delay in the maturation/processing of recombination intermediates after loading of the RAD-51 recombinase. The ZnF domain cooperates with the RMI1 homolog RMH-2 to stabilize association of the BTR complex with recombination intermediates and to prevent recombination between heterologous DNA sequences.


Figures

Figure 1.
Figure 1.
t op-3-ZnF is a hypomorph allele. (A) Schematic representation of the top-3 gene, depicting the conserved topoisomerase domain (light blue) and the GRF zinc finger (ZnF) motif (green). The jf153 (top-3-ZnF) allele encodes a truncated protein that lacks the ZnF motif. (B) Western blot analysis of TOP-3::HA and TOP-3-ZnF::HA in whole worm extracts. wild-type (wt) worms were used to control for the specificity of the antibody. The TOP-3::HA protein is 100 KDa in size and the TOP-3-ZnF::HA protein lacks 45 amino acids. Actin was used as the loading control. Right panel: western blot quantification of three biological replicates per sample. Error bars indicate the mean and SD. (C) Hatch rates for the indicated genotypes: wt, 99.8% ± 0.3%, n = 18; top-3-ZnF, 98.8% ± 0.7%, n = 17; rtel-1(tm1866), 84.7% ± 34.3%, n = 8; rtel-1(tm1866); top-3-ZnF, 60.1% ± 43.4%, n = 9; mus-81(tm1937), 95.0% ± 3.0%, n = 8; mus-81(tm1937); top-3-ZnF, 70.1% ± 32.5%, n = 7. n = number of hermaphrodites. The histogram indicates the mean ± (SD). * P = 0.02, *** P = 0.0003, **** P < 0.0001, as determined using the Mann–Whitney test; non-significant differences are not shown. (D) The percentage of RAD-51 foci classes in each of the seven zones of the gonad in the indicated genotypes. For each zone, the average number of RAD-51 foci/nucleus was calculated from three gonads per genotype. Bottom right panel: schematic representation of the C. elegans gonad divided into seven equal zones. (E) Quantification of DAPI bodies in the −1 diakinesis oocyte in the indicated genotypes. Mean ± SD and number (n) of DAPI bodies per genotype: wt, 6 ± 0, n = 50; top-3-ZnF, 5.96 ± 0.3, n = 154; spo-11(ok79), 12 ± 0, n = 50; spo-11(ok79); top-3-ZnF, 12 ± 0, n = 50; rtel-1(tm1866), 6.2 ± 0.4, n = 34; and rtel-1(tm1866); top-3-ZnF, 6.1 ± 0.3, n = 41. Right panel: qualitative analysis of the −1 diakinesis oocyte of the indicated genotypes. n = number of DAPI bodies and the percentage of the different types of DAPI bodies observed per genotype: mus-81(tm1937), n = 90, bivalents = 70.2%, dissociated bivalents = 8.5%, DNA fragments = 14.9%, univalents = 5.3%, n/d (not defined) = 1.1%; mus-81(tm1937); top-3-ZnF, n = 50, bivalents = 44.6%, dissociated bivalents = 16.2%, fragments = 12.2%, univalents = 6.8%, n/d (not defined) = 20.3%. Insets show representative images of DAPI-stained diakinesis nuclei of the indicated genotypes. For top-3-ZnF, the dashed light blue circles indicate the presence of bridges and a doughnut-shaped bivalent.
Figure 2.
Figure 2.
Thetop-3-ZnF mutant displays extra COs and low levels of heterologous recombination. (A) Top: schemes of chromosomes IV and V and the corresponding SNP locations used in the PCR-based recombination assay for wt, top-3-ZnF and rmh-2(jf168) worms. The scheme indicates the theoretical genetic distance (in cM) and the experimentally determined distance for each chromosome. The graph represents the percentage of recombination events in each genetic interval for Chromosome IV (left) and V (right). The statistical significance of differences between top-3-ZnF and wt (Chromosome IV, BC interval * P = 0.04; and Chromosome V, BC interval *** P = 0.0009, CD interval ** P = 0.0099) and between rmh-2(jf168) and top-3-ZnF (Chromosome IV, AB interval * P = 0.042, BC interval * P = 0.028; and Chromosome V, BC interval ** P = 0.003) was calculated using the χ2 test. Bottom: tables show the percentage of single (1CO), double (2CO) and triple (3CO) crossover, with the numbers in parenthesis, the recombination (Rec.) frequency as a percentage and the number of worms analyzed per genotype. The statistical significance of differences in recombination frequency between strains were calculated using Fisher's exact test (Chromosome IV: top-3-ZnF vs wt * P = 0.046, top-3-ZnF vs rmh-2(jf168) ** P = 0.0048; wt vs rmh-2(jf168) not significant (ns); Chromosome V: top-3-ZnF vs wt ns; top-3-ZnF vs rmh-2(jf168) ** P = 0.0016; wt vs rmh-2(jf168) ns). In Chromosome V, the percentage of crossovers that were double crossovers was significantly increased in top-3-ZnF compared with wt (** P = 0.0063), as calculated using the χ2 test. (B) Top: schematic representation of Chromosome II, showing the mln1 inversion and phenotypic markers used for the recombination assay (recessive rol-1 and semi-dominant GFP and dpy-25). Bottom: Percentage of recombinant progeny and the number of recombination events/total number of worms tested are shown for each genotype. Statistical analysis was done using Fisher's exact test (top-3-ZnF compared with wt * P = 0.033; top-3-ZnF compared with rmh-2(jf94) * P = 0.028; rmh-2(jf94) compared with wt *** P = 0.0002).
Figure 3.
Figure 3.
top-3-ZnF localizes to foci. (A) Representative images of top-3::ha (top) and top-3-ZnF::ha (bottom) gonads stained with HA (green) and DAPI (magenta). * Indicates the distal tip of the progenitor zone. Red and blue squares (dashed lines) indicate the enlarged regions on the right. (B) Schematic representation of the C. elegans gonad divided into four equal zones from the transition zone to late pachynema. Scatter plots show the number of HA foci per nucleus in the meiotic region of the gonad: zone 1 = transition zone; zone 2 = early pachynema; zone 3 = mid pachynema; and zone 4 = late pachynema. For each genotype, the mean ± SD number of foci in each zone are indicated, with n = the number of nuclei assessed. top-3::ha: zone 1, 0.3 ± 0.8, n = 141; zone 2, 14.7 ± 7.8, n = 110; zone 3, 22.1 ± 6.2, n = 89; and zone 4, 8 ± 1.4, n = 71. rtel-1(tm1866); top-3::ha zone 1, 0.7 ± 1.2, n = 141; zone 2, 12.9 ± 7.9, n = 98; zone 3, 27.1 ± 7.3, n = 88; and zone 4, 11.1 ± 6.6, n = 49. top-3-ZnF::ha: zone 1, 0.3 ± 0.6, n = 121; zone 2, 5.5 ± 5, n = 92; zone 3, 14.8 ± 4.1, n = 83; and zone 4, 7.8 ± 1.4, n = 63. rtel-1(tm1866); top-3-ZnF::ha: zone 1, 0.9 ± 1.2, n = 132; zone 2, 8.8 ± 6.5, n = 117; zone 3, 17.1 ± 5.7, n = 94; and zone 4, 7.2 ± 1.2, n = 45. Error bars indicate the mean and SD. Statistical significance was determined using the Mann–Whitney test (see Supplementary table 1 for more details of the statistical analysis).
Figure 4.
Figure 4.
The TOP-3-ZnF domain influences localization of the BTR complex. (A) Super-resolution images of gfp::rmh-1; top-3::ollas (left) and him-6::ha; top-3::ollas (right) nuclei in mid pachynema (top) and late pachynema (bottom). Nuclei were stained with anti-SYP-1 (blue), anti-GFP (yellow) and anti-OLLAS (magenta) antibodies (left) and with anti-SYP-1 (blue), anti-HA (cyan) and anti-OLLAS (magenta) antibodies (right). Half part of the nucleus was projected. Insets (top, right) show magnified boxed regions, highlighting co-localization of the proteins. (B) TOP-3::OLLAS localization in mid pachynema (top) and late pachynema (bottom) in the indicated genotypes. Gonads were stained with DAPI (cyan) and anti-OLLAS antibody (red). (C) HIM-6::HA localization in mid pachynema (top) and late pachynema (bottom) in the indicated genotypes. Gonads were stained with DAPI (blue) and anti-HA antibody (yellow). (D) Upper panel: GFP::RMH-1 localization in mid pachynema (top) and late pachynema (bottom) in the indicated genotypes. Gonads were stained with DAPI (magenta) and anti-GFP antibody (green). Lower panel: quantification of GFP::RMH-1 foci in the meiotic region of the C. elegans gonad. The scatter plot indicates the number of foci per nucleus: zone 1 = transition zone; zone 2 = early pachynema; zone 3 = mid pachynema; zone 4 = late pachynema. For each genotype, the mean ± SD number of foci in each zone are indicated, with n = the number of nuclei assessed. gfp::rmh-1: zone 1, 1.2 ± 1.2, n = 111; zone 2, 15.22 ± 6.9, n = 155; zone 3, 18.64 ± 6.1, n = 44; and zone 4, 8.3 ± 2.1, n = 92. gfp::rmh-1; top-3-ZnF: zone 1, 1.1 ± 1.3, n = 103; zone 2, 3.6 ± 3.8, n = 167; zone 3, 11.4 ± 4.7, n = 186; and zone 4, 7.7 ± 1.7, n = 114. gfp::rmh-1; top-3-ZnF; rmh-2: zone 1, 0.4 ± 0.7, n = 83; zone 2, 1.6 ± 3, n = 89; zone 3, 6.3 ± 3, n = 62; and zone 4, 6.6 ± 1.6, n = 47. **** P < 0.0001, as determined using the Mann–Whitney test; non-significant differences are not shown. (See Supplementary table 1 for more details of the statistical analysis).
Figure 5.
Figure 5.
Reduced loading of MSH-5 into recombination foci in top-3-ZnF and rmh-2. (A) Upper panel: representative images of GFP::MSH-5 foci localization at different stages of meiotic prophase I in C. elegans gonads of the indicated genotypes. Zone 1 = transition zone; zone 2 = early pachynema; zone 3 = mid pachynema; zone 4 = late pachynema. Images of gonads show DAPI staining (magenta) and endogenous GFP (green). Bottom: Quantification of GFP::MSH-5 foci in the meiotic part of the gonad. Scatter plots indicate the number of foci per nucleus. For each genotype, the mean ± SD number of foci in each zone are indicated, with n = number of nuclei assessed. gfp::msh-5: zone 1, 0.05 ± 0.3, n = 157; zone 2, 8.6 ± 5.8, n = 149; zone 3, 10.82 ± 4.2, n = 122; and zone 4, 6.1 ± 0.7, n = 92. gfp::msh-5; top-3-ZnF: zone 1, 0.0 ± 0.0, n = 151; zone 2, 2.7 ± 3.2, n = 135; zone 3, 7.3 ± 1.6, n = 133; and zone 4, 6.1 ± 0.7, n = 72. gfp::msh-5; rmh-2(jf94): zone 1, 0.02 ± 0.1, n = 125; zone 2, 2.2 ± 2.9, n = 107; zone 3, 8.5 ± 2.8, n = 93; and zone 4, 6 ± 0.8, n = 84. gfp::msh-5; top-3-ZnF; rmh-2(jf94): zone 1, 0 ± 0, n = 120; zone 2, 1 ± 1.7, n = 110; zone 3, 5.3 ± 2.7, n = 70; and zone 4, 5.7 ± 0.8, n = 58. Statistical significance was determined using the Mann–Whitney test (see Supplementary table 1 for more details of the statistical analysis). (B) Upper panel: representative images of nuclei in early and mid pachynema in the indicated genotypes after staining for RAD-51 (blue), GFP (magenta) and DAPI (yellow). Lower panel: the percentage of nuclei in early and mid pachynema that were positive for the indicated meiotic markers (RAD-51 only, blue; MSH-5 only, orange; and both RAD-51 and MSH-5, gray). (C) Upper panel: representative images of GFP::MSH-5 and OLLAS::COSA-1 co-localization in recombination foci in late pachynema in the indicated genotypes. Gonads were stained with DAPI (blue), anti-GFP (yellow) and anti-OLLAS (magenta) antibodies. Dashed circles highlight nuclei with clear co-localization. Lower panel: quantification of OLLAS::COSA-1 foci in late pachynema in the indicated genotypes. The scatter plot indicates the number of foci per nucleus. Mean ± SD are indicated, n = number of nuclei assessed. ollas::cosa-1; gfp::msh-5, 6 ± 0.6, n = 63; ollas::cosa-1; gfp::msh-5; top-3-ZnF, 5.8 ± 0.7, n = 67; ollas::cosa-1; gfp::msh-5; rmh-2, 5.9 ± 0.6, n = 52; ollas::cosa-1; gfp::msh-5; top-3-ZnF; rmh-2, 6 ± 0.8, n = 41. There is no significant difference between the indicated genotypes. Statistical significance was determined using the Mann–Whitney test.
Figure 6.
Figure 6.
top-3-ZnF and rmh-2 double mutants display a synthetic phenotype. (A) Representative images of gonads stained with HA (green) and DAPI (magenta) in the indicated genotypes. Zone 1 = transition zone; zone 2 = early pachynema; zone 3 = mid pachynema; zone 4 = late pachynema. Right panel: HA foci quantification in the indicated genotypes. The scatter plot indicates the number of foci per nucleus. Mean ± SD are indicated, n = number of nuclei assessed. top-3-ZnF::ha (same quantification as in Figure 3A): zone 1, 0.3 ± 0.6, n = 121; zone 2, 5.5 ± 5, n = 92; zone 3, 14.8 ± 4.1, n = 83; and zone 4, 7.8 ± 1.4, n = 63. top-3::ha; rmh-2: zone 1, 0.9 ± 0.9, n = 89; zone 2, 9.4 ± 6, n = 88; zone 3, 16.3 ± 5.4, n = 70; and zone 4, 7.4 ± 1.4, n = 48. **** P < 0.0001, as determined using the Mann–Whitney test; non-significant differences are not shown. top-3-Zn; rmh-2: no quantification owing to a lack of foci. (B) Percentage viability and rates of larval arrest and males in the indicated genotypes, with n = number of worms quantified per genotype: rmh-2(jf94); top-3-ZnF::han = 10; and top-3-ZnF = 17 (same as in Figure 1C); rmh-2(jf94)n = 9. (C) Quantification of DAPI bodies in the −1 diakinesis oocyte in the indicated genotypes: wt (same quantification as in Figure 1E) 6 ± 0, n = 50; top-3-ZnF, 5.96 ± 0.3, n = 154 (same quantification as in Figure 1E); rmh-2, 6.1 ± 0.3, n = 50; rmh-2; top-3-ZnF, 6.8 ± 1.2, n = 51; spo-11, 11.9 ± 0.3, n = 28; and spo-11; rmh-2; top-3-ZnF, 12.1 ± 0.3, n = 49. ** P = 0.0099, * P = 0.028, **** P < 0.0001, as determined using the Mann–Whitney test; non-significant differences are not shown. Insets show representative images of DAPI-stained diakinesis nuclei of the indicated genotypes. The dashed circles highlight fragments of DNA. (D) Representative images of RAD-51 foci localization at different stages of meiotic prophase I in the indicated genotypes. Gonads were stained with DAPI (cyan) and anti-RAD-51 antibodies (red).
Figure 7.
Figure 7.
TOP-3 and RMH-2 interact physically and at the genetic level. (A) Upper panel: representative images of RMH-2::FLAG in the indicated germline stages, in the absence or presence of top-3-ZnF. Lower panel: western blot analysis using anti-FLAG antibodies to detect RMH-2::FLAG in wt and top-3-ZnF whole worm extracts. wt worms were used to control for antibody specificity. RMH-2::FLAG is around 100 kDa in size. Histone H3 was the loading control. The scatter plot shows normalized RMH-2::FLAG expression. Five biological replicates were measured for each sample. Error bars indicate the mean and SD. Statistical significance was determined using the Mann–Whitney test. (B) Percentage of progeny with heterologous recombination in the mln1 inversion interval on chromosome 2; the number of recombination events/total number of worms assessed are shown for each genotype. ** P = 0.003; **** P < 0.0001 as determined using Fisher's exact test. (C) Yeast two-hybrid analysis of interactions between TOP-3 and RMH-2 proteins. As indicated, each spot corresponds to a single dilution. Control plates (SC-Leu-Trp) are on the left and selection plates (SC-Leu-Trp-His) are on the right. Auto-activation of both bait and prey vectors was tested. C-ter: C-terminus; N-ter: N-terminus.

References

    1. Hunter N. Meiotic recombination: the essence of heredity. Cold Spring Harb. Perspect. Biol. 2015; 7:a016618. - PMC - PubMed
    1. Hillers K.J., Jantsch V., Martinez-Perez E., Yanowitz J.L.. Meiosis. WormBook. 2017; 2017:1–43. - PMC - PubMed
    1. Gerton J.L., Hawley R.S.. Homologous chromosome interactions in meiosis: diversity amidst conservation. Nat. Rev. Genet. 2005; 6:477–487. - PubMed
    1. Bizard A.H., Hickson I.D.. The dissolution of double Holliday junctions. Cold Spring Harb. Perspect. Biol. 2014; 6:a016477. - PMC - PubMed
    1. Haber J.E. TOPping off meiosis. Mol. Cell. 2015; 57:1142. - PubMed

Publication types

MeSH terms