. 2022 Sep 1;140(9):992-1008.
doi: 10.1182/blood.2021014698.

PLAG1 dampens protein synthesis to promote human hematopoietic stem cell self-renewal

Affiliations

PLAG1 dampens protein synthesis to promote human hematopoietic stem cell self-renewal

Ava Keyvani Chahi et al. Blood. .

Abstract

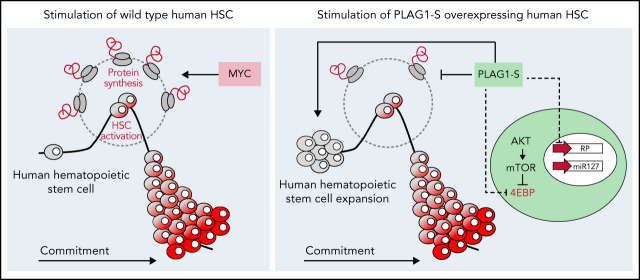
Hematopoietic stem cell (HSC) dormancy is understood as supportive of HSC function and its long-term integrity. Although regulation of stress responses incurred as a result of HSC activation is recognized as important in maintaining stem cell function, little is understood of the preventive machinery present in human HSCs that may serve to resist their activation and promote HSC self-renewal. We demonstrate that the transcription factor PLAG1 is essential for long-term HSC function and, when overexpressed, endows a 15.6-fold enhancement in the frequency of functional HSCs in stimulatory conditions. Genome-wide measures of chromatin occupancy and PLAG1-directed gene expression changes combined with functional measures reveal that PLAG1 dampens protein synthesis, restrains cell growth and division, and enhances survival, with the primitive cell advantages it imparts being attenuated by addition of the potent translation activator, c-MYC. We find PLAG1 capitalizes on multiple regulatory factors to ensure protective diminished protein synthesis including 4EBP1 and translation-targeting miR-127 and does so independently of stress response signaling. Overall, our study identifies PLAG1 as an enforcer of human HSC dormancy and self-renewal through its highly context-specific regulation of protein biosynthesis and classifies PLAG1 among a rare set of bona fide regulators of messenger RNA translation in these cells. Our findings showcase the importance of regulated translation control underlying human HSC physiology, its dysregulation under activating demands, and the potential if its targeting for therapeutic benefit.


Figures

None
Graphical abstract
Figure 1.
Figure 1.
PLAG1 is enriched and essential in human HSCs. (A) Schematic of LinCD34+ CB HSPC in vitro and in vivo functional assay timelines and lentivectors used for PLAG1 knockdown. (B) Primary CFU output by LinCD34+ HSPCs expressing control or (1sh) PLAG1-targeting hairpins. (C) Cumulative in vitro CD34+ cell fold change of cultured of LinCD34+ HSPCs expressing 1shPLAG1 or control hairpins. (D) GFP+ engraftment in the uninjected femur of primary NSG mice 6 weeks after xenotransplantation of LinCD34+ cells expressing either 1shPLAG1 (n = 4) or control (n = 6) hairpins normalized to input % GFP+ levels. (E) GFP+ engraftment in the injected femur and bone marrow of primary NSG mice 16 weeks after xenotransplantation of LinCD34+ cells expressing either 1shPLAG1 (n = 4) or control (n = 5) hairpins normalized to input % GFP+ levels. (F) Primary CFU output by LinCD34+ HSPCs expressing control or a second (2sh) PLAG1-targeting hairpin. (G) GFP+ engraftment in the injected femur and bone marrow of primary NSG mice 16 weeks after xenotransplantation of LinCD34+ cells expressing either 2shPLAG1 (n = 3) or control (n = 6) hairpins normalized to input % GFP+ levels. Data are presented as average ± SEM unless otherwise indicated. Each point represents one mouse or an individual CB unit. ***P < .005, **P < .01, *P < .05. n.s., not significant. See also supplemental Figure 1.
Figure 2.
Figure 2.
PLAG1-S is a positive regulator of human HSPC fitness. (A) PLAG1 and MSI2 transcript expression in human bone marrow cell populations determined by single-cell RNA-seq. (B) MSI2 protein expression measured by immunofluorescence microscopy in PLAG1-S overexpressing LinCD34+ cells. (C) Change in variance-stabilizing transformed (vst) PLAG1 transcript expression in Lin cord blood cells cultured for 2 or 4 days showing the P value from 1-tailed Student t-test and in 72-hour cultured long-term (LinCD34+CD38CD45RACD90+CD49f+) CB HSCs showing the P value from 1-tailed Student t-test and differential expression from DEseq analysis. (D) Schematic of LinCD34+ CB HSPC in vitro and in vivo functional assay timelines and lentivectors used for overexpression of PLAG1 protein isoforms. (E) Primary CFU output by BFP+ LinCD34+ cells overexpressing PLAG1-A, B, or S, or Luciferase control (n = 3 per experiment). (F) Secondary CFU replating efficiency (for each condition, 12 GEMMs from 3 distinct CB units were replated into new wells. Negative indicates no secondary colonies were derived from the primary GEMM, Positive indicates at least 1 secondary colony was derived from the primary GEMM) and the total number of secondary colonies on positive plates with images of representative primary GEMM colonies used. (Square data points are from experiment 1 and circle data points are from experiment 2, n=3 per experiment.) (G) Cumulative in vitro total nucleated cell (TNC) and (H) CD34+ cell fold change of cultured of LinCD34+ cells overexpressing PLAG1-A (n = 3), B, or S, or Luciferase control (n = 6). (I) Frequency of CD34 positivity in PLAG1-A (n = 3), B, or S, or Luciferase control (n = 6) overexpressing cultures after 4 and 7 days ex vivo. (J) Representative flow plots and quantification relative to input proportions of BFP representation in CD45+ human grafts in bone marrow of primary NSG mice 16 weeks after receiving LinCD34+ cells overexpressing either PLAG1-S or Luciferase control (n = 6). (K) Representative flow plots of input and output BFP fluorescence intensity and quantification of output/input BFP median fluorescence intensity in bone marrow of primary NSG mice 16 weeks after receiving LinCD34+ cells overexpressing either PLAG1-S or Luciferase control (n = 6). Data are presented as average ± SEM unless otherwise indicated. Each point represents 1 mouse or an individual CB unit. ***P < .005, **P < .01, *P < .05. n.s., not significant. See also supplemental Figure 2.
Figure 3.
Figure 3.
PLAG1-S overexpression promotes self-renewal of long-term human HSCs. (A) Schematic of primary and secondary xenotransplantation in limiting dilution format. (B) Representative flow plots of human CD45+BFP+ multilineage (CD33+, CD19+) engraftment of primary recipient mice in injected femur. Percent human CD45+BFP+ engraftment in injected femur of primary recipient mice across multiple cell input doses. Dashed line indicates cutoff for calling engraftment, which was >0.5% human chimerism including both myeloid (CD45+BFP+CD33+) and lymphoid (CD45+BFP+CD19+) lineages. (C-D) Quantification of HSC frequency by ELDA of injected femur of primary recipient mice. Shaded area under the curve represents 95% confidence interval of HSC frequency. (E) Percent human CD45+BFP+ engraftment in injected femur of secondary recipient mice across multiple cell input doses. Dashed line indicates cutoff for calling engraftment, which was the same as for primary mice. (F-G) Quantification of HSC frequency by ELDA of injected femur or uninjected bone marrow of secondary recipient mice and of in vivo expansion. Shaded area under the curve represents 95% confidence interval of HSC frequency. Total BFP+ cells within whole-body BM of primary mice were extrapolated, as previously, based on femur and hind limb counts and proportional accounting from Colvin et al, and in vivo expansion is measured as the fold difference of total BFP+ HSCs in donor mice relative to total day 0 HSCs initially transplanted into the 6 donor mice. Data are presented as average ± SEM unless otherwise indicated. Each point represents 1 mouse. See also supplemental Figure 3.
Figure 4.
Figure 4.
PLAG1-S enforces a pro-HSC transcriptional state. (A) Loci annotations and distribution of PLAG1-S binding sites in the Lin-CD34+ genome identified by CUT&RUN. (B) Enriched motifs among PLAG1-S genomic binding sites determined by HOMER indicating the % of PLAG1-S targets bound to the consensus and P value of the enrichment relative to genome-wide background occurrence of the consensus. (C) Volcano plot of differential gene expression in PLAG1-S overexpressing LinCD34+ cells. Red- or blue-colored genes are significantly changed by adjusted P value < .05 and green- and purple-colored genes are directly bound by PLAG1-S. (D) PLAG1-S overexpression and shPLAG1 transcriptomic alignment to DMAP signatures of hematopoietic compartments. Numbers above or below the bars indicate the empirical P value determined based on the percentage of times for which the observed value (set of up- or downregulated genes) was as large or larger in that population than random values (equal number of randomly selected genes) based on 1000 trials. (E) Enrichment map of significantly enriched gene sets (FDR < 0.1) in PLAG1-SOE LinCD34+ cells compared with control. Genes bound by PLAG1-S in Lin-CD34+ cells (CUT&RUN q-value cutoff of 0.05) are intersected to gene sets by Mann-Whitney U test (P < .05) and the width of green edges correlates with increasing statistical significance of the overlap. Node size reflects the number of genes in the gene set. (F) Forty-one of 46 gene sets from the “Establishment Protein Localization Translation” cluster that are overrepresented among PLAG1-S genomic binding sites (g:Profiler FDR < 0.1) and the list of bound leading-edge genes driving negative enrichments in this cluster. See also supplemental Figure 4. FDR, false discovery rate.
Figure 5.
Figure 5.
PLAG1-S dampens protein synthesis and promotes dormancy in stimulated human HSPCs. (A) OP-Puro incorporation dynamics measured as median fluorescence intensity (MFI) in cultured LinCD34+ cells with representative flow cytometry plots (n = 5 for 0 and 24 hours; n = 3 for 4, 48, and 72 hours). Red and blue asterisks denote statistical significance relative to previous timepoint or T0, respectively. (B) Fold difference of OP-Puro MFI relative to T0 in cultured LinCD34+ compared with LinCD34 CB fractions (n = 4 for 24 hours, n = 2 for 48 hours). Blue statistics are relative to 1× levels at T0 and red statistics are between cell types at matched time points. (C) OP-Puro incorporation by PLAG1-SOE and control LinCD34+ cells on day 4 of ex vivo culture (n = 8). Data from 3 experiments normalized to the average MFI in control cells per experiment. (D) Reduced size of PLAG1-SOE LinCD34+ cells on day 4 of ex vivo culture determined by flow cytometric MFI of FSC-H profiles (n = 7, left, each point is from a culture of an individual CB unit) and immunofluorescence microscopy (right, each point is a single cell; scale bar = 25 μm). (E) Cell-cycle analysis by Hoechst and Ki67 staining of PLAG1-SOE and control LinCD34+ cells on days 4 and 7 of ex vivo culture (n = 3). (F) Representative flow plots for PLAG1-SOE and control LinCD34+ cells stained for 7-AAD and Annexin V with apoptosis measurements of surface positivity of Annexin V on day 4 (n = 5) and day 7 (n = 4) of ex vivo culture. (G) Heatmap of log2FC of transcripts coding EIF2 subunits (bottom) and intracellular flow cytometric measures of EIF2S1 protein expression (n = 4) in PLAG1-SOE relative to control LinCD34+ cells on day 4 of ex vivo culture (top). (H) GSEA of the PLAG1-SOE transcriptome to curated targets of ATF4 generated by Han et al and used by van Galen et al and FPKM heatmap of ATF4 targets differentially expressed in PLAG1-SOE HSPCs (p.adj < .1). (I) Negative enrichment of gene sets related to unfolded protein response (P < .05). Data are presented as average ± SEM unless otherwise indicated. Each point represents an individual CB unit otherwise indicated. ***P < .005, **P < .01, *P < .05. See also supplemental Figure 5. FSC-H, Forward Scatter Height; n.s., not significant; p.adj, adjusted P value.
Figure 6.
Figure 6.
PLAG1-S activates imprinted loci to support human HSPCs. (A) Heatmap of top 10 differentially expressed transcripts in the transcriptome of PLAG1-SOE LinCD34+ HSPCs. (B) Intracellular flow cytometry of components of the PI3K signaling pathway, including phospho-S473 AKT, phospho-S2448 mTOR, and phospho-Thr37/46 4EBP1, in PLAG1-SOE LinCD34+ cells on day 4 of culture. Numbers above PLAG1-SOE bars show the paired Student t-test P value relative to control (n = 3, ph-4EBP1 n = 5). (C) Total nucleated cell (top) and CD34+ cell (bottom) fold change in LinCD34+BFP+ cultures overexpressing either PLAG1-S or Luciferase control and treated with 50 nM rapamycin (RAPA), 1 μM AKT inhibitor (AKTi), or vehicle (DMSO) (n = 4). Student t-test P values in red are relative to Cntrl-DMSO and in black are relative to PLAG1-SOE-DMSO. (D) CD34 positivity in PLAG1-SOE or control HSPCs following 4 and 8 days of ex vivo culture with RAPA, AKTi, or vehicle (n = 4). Student t-test P values in red are relative to Cntrl-DMSO and in black are relative to PLAG1-SOE-DMSO. (E) OP-Puro incorporation by PLAG1-SOE HSPCs cultured in the presence of RAPA, AKTi, or vehicle on day 4 of culture (n = 4). (F) Schematic of the imprinted human DLK1/MEG3 locus, which encodes miRNA mega-clusters miR127/136 (7 miRNAs) and miR-379/410 (39 miRNAs). (G) RNA-seq read tracks for miRNA transcripts from this locus detected in PLAG1-SOE HSPCs. (H) Overlap of the PLAG1-S overexpression gene set enrichment map (P < .025) to signatures of miR-127-5p and miR-127-3p validated targets (Mann-Whitney U test, P < .05). (I-J) Schematic of lentivectors used for dual PLAG1-S overexpression and miR127-5p inhibition via a sponge consisting of multiple bulged 26-mer target sequences (miR127TB) or miR127 overexpression. (I) CD34+ cell fold change ex vivo when PLAG1-S and the miR127-5p inhibitor are coexpressed in LinCD34+ cells (n = 3). (J) CD34+ cell fold change ex vivo when miR127 is overexpressed in LinCD34+ cells (n = 3); and OP-Puro incorporation LinCD34+ cells overexpressing miR127 (n = 3). Data are presented as average ± SEM unless otherwise indicated. Each point represents an individual CB unit. ***P < .005, **P < .01, *P < .05. n.s., not significant. See also supplemental Figure 6.
Figure 7.
Figure 7.
MYC-induced translation impairs PLAG1-S-mediated stemness in human HSPCs. (A) Up- (red) or down- (blue) regulation of MYC ribosome biogenesis targets in PLAG1-SOE HSPCs. (B) Schematic of PLAG1-S and c-MYC overexpression lentivectors. (C) Representative sorting gates for dual-overexpression of PLAG1-S and c-MYC or controls in LinCD34+ cells. (D) CD34 (n = 4) and (E) CD33 (n = 3) positivity in BFP+GFP+ HSPCs over 4 and 7 days of ex vivo culture. (F) Cell size determined by flow cytometric MFI of FSC-H (n = 3-4) in BFP+GFP+ HSPC cultures on day 4 and 7. (G) OP-Puro incorporation by BFP+GFP+ HSPCs on day 4 of ex vivo culture (n = 4). Data are presented as average ± SEM unless otherwise indicated. Each point represents an individual CB unit. ***P < .005, **P < .01, *P < .05. n.s., not significant. See also supplemental Figure 7.

Comment in

  • HSCs: slow me down with PLAG1.
    Zhang YW, Cabezas-Wallscheid N. Zhang YW, et al. Blood. 2022 Sep 1;140(9):935-936. doi: 10.1182/blood.2022017069. Blood. 2022. PMID: 36048477 No abstract available.

References

    1. Orkin SH, Zon LI. Hematopoiesis: an evolving paradigm for stem cell biology. Cell. 2008;132(4):631-644. - PMC - PubMed
    1. Doulatov S, Notta F, Laurenti E, Dick JE. Hematopoiesis: a human perspective. Cell Stem Cell. 2012;10(2):120-136. - PubMed
    1. Chabannon C, Kuball J, Bondanza A, et al. Hematopoietic stem cell transplantation in its 60s: a platform for cellular therapies. Sci Transl Med. 2018;10(436):eaap9630. - PubMed
    1. Smith AR, Wagner JE. Alternative haematopoietic stem cell sources for transplantation: place of umbilical cord blood. Br J Haematol. 2009;147(2): 246-261. - PMC - PubMed
    1. Gragert L, Eapen M, Williams E, et al. HLA match likelihoods for hematopoietic stem-cell grafts in the U.S. registry. N Engl J Med. 2014;371(4):339-348. - PMC - PubMed

MeSH terms