. 2022 Sep 15;140(11):1278-1290.
doi: 10.1182/blood.2021015019.

DNMT3A mutations define a unique biological and prognostic subgroup associated with cytotoxic T cells in PTCL-NOS

Affiliations

DNMT3A mutations define a unique biological and prognostic subgroup associated with cytotoxic T cells in PTCL-NOS

Tyler A Herek et al. Blood. .

Abstract

Peripheral T-cell lymphomas (PTCLs) are heterogenous T-cell neoplasms often associated with epigenetic dysregulation. We investigated de novo DNA methyltransferase 3A (DNMT3A) mutations in common PTCL entities, including angioimmunoblastic T-cell lymphoma and novel molecular subtypes identified within PTCL-not otherwise specified (PTCL-NOS) designated as PTCL-GATA3 and PTCL-TBX21. DNMT3A-mutated PTCL-TBX21 cases showed inferior overall survival (OS), with DNMT3A-mutated residues skewed toward the methyltransferase domain and dimerization motif (S881-R887). Transcriptional profiling demonstrated significant enrichment of activated CD8+ T-cell cytotoxic gene signatures in the DNMT3A-mutant PTCL-TBX21 cases, which was further validated using immunohistochemistry. Genomewide methylation analysis of DNMT3A-mutant vs wild-type (WT) PTCL-TBX21 cases demonstrated hypomethylation in target genes regulating interferon-γ (IFN-γ), T-cell receptor signaling, and EOMES (eomesodermin), a master transcriptional regulator of cytotoxic effector cells. Similar findings were observed in a murine model of PTCL with Dnmt3a loss (in vivo) and further validated in vitro by ectopic expression of DNMT3A mutants (DNMT3A-R882, -Q886, and -V716, vs WT) in CD8+ T-cell line, resulting in T-cell activation and EOMES upregulation. Furthermore, stable, ectopic expression of the DNMT3A mutants in primary CD3+ T-cell cultures resulted in the preferential outgrowth of CD8+ T cells with DNMT3AR882H mutation. Single-cell RNA sequencing(RNA-seq) analysis of CD3+ T cells revealed differential CD8+ T-cell subset polarization, mirroring findings in DNMT3A-mutated PTCL-TBX21 and validating the cytotoxic and T-cell memory transcriptional programs associated with the DNMT3AR882H mutation. Our findings indicate that DNMT3A mutations define a cytotoxic subset in PTCL-TBX21 with prognostic significance and thus may further refine pathological heterogeneity in PTCL-NOS and suggest alternative treatment strategies for this subset.


Figures

None
Graphical abstract
Figure 1.
Figure 1.
DNMT3A mutations in peripheral T-cell lymphoma entities. (A) Heatmap of the molecular PTCL classification signatures. (B) Kaplan-Meier curve of the OS of PTCL cases included in this study. (C) Lollipop plot of DNMT3A mutations in PTCL-NOS molecular subtypes (top) and PTCLs of TFH origin (bottom). Lollipops represent mutated residues; cases with >1 mutation plotted are identified numerically. Mutations in the dimerization region (S881-R887) past R882 (884, 885, 886, and 887) are stacked above for visual clarity. (D) Graph of the distribution of DNMT3A mutations per PTCL entity.
Figure 2.
Figure 2.
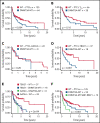
Prognostic significance of DNMT3A mutations in peripheral T-cell lymphoma entities. (A) Kaplan-Meier curve of the OS of DNMT3A-MT and WT cases for the entire PTCL cohort. All patients were treated with a CHOP-based regimen. (B) OS for DNMT3A-MT and WT cases for PTCLs of TFH origin (AITL n = 89, PTCLTFH-like = 15). (C) OS for DNMT3A-MT and WT cases for PTCL-GATA3. (D) OS for DNMT3A-MT and WT cases for PTCL-TBX21. (E) OS comparison of PTCL-TBX21 and PTCL-GATA3 cases with respect to DNMT3A mutation status. (F) OS of DNMT3A mutants within the dimerization region (881-887), other DNMT3A mutants, and WT cases for the entire PTCL cohort. MT, mutant.
Figure 3.
Figure 3.
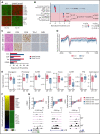
DNMT3A-MT PTCL-TBX21 cases are enriched for an activated CD8+ cytotoxic phenotype. (A) Heatmap of differentially expressed genes between DNMT3A-MT and WT PTCL-TBX21 cases. (B) Gene set enrichment analysis (GSEA) for DNMT3A-MT PTCL-TBX21 cases as compared with WT cases. Pathway diagrams containing differentially expressed genes of interest are displayed within shaded regions. (C, top) Representative images of CD4 and CD8 tumor antigen staining in PTCL-NOS cases. Images are taken at identical high-power magnifications. (C, bottom) Bar graph of the frequency of immunohistochemistry positivity for n = 10 PTCL-TBX21 cases with respect to DNMT3A mutation status. (D) Pooled metagene plot for MeDIP-Seq profiles of DNMT3A-MT PTCL-TBX21 cases as compared with WT cases. Lines represent sample-type average log2 (peaks per bp per gene) for indicated regions, and shading represents standard error among samples. (E) Box plots of the log2 ratio (observed/expected) for 5mC peaks within the indicated genomic regions. (F) Heatmap of concordant differentially expressed and methylated genes. (G) University of California, Santa Cruz (UCSC) genome browser visualization of MeDIP-Seq peaks in DNMT3A-MT samples and WT samples for the listed genes. Gene diagrams represent the position of TSS relative to displayed genomic regions. Histograms display median-centered expression of genes of interest. Sequencing and GEP status are denoted by the in-figure key. TSS, transcriptional start site; TTS, transcriptional termination site; MT, mutant.
Figure 4.
Figure 4.
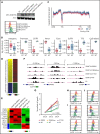
Expression of DNMT3A mutations in a cytotoxic CD8+ PTCL cell line. (A, top) Representative Western blot of MYC-tagged DNMT3A. (A, bottom) Representative histogram of 5mC (MFI) in indicated T8ML1 cells. (B) Box plots of the log2 ratio (observed/expected) for 5mC peaks within the indicated genomic regions. (C) Pooled metagene plot for MeDIP-Seq profiles of DNMT3A-MT (R882H, V716D, and Q886Stop) and DNMT3A-WT (WT, EV) cell lines. Lines represent sample-type average log2 (peaks per bp per gene) for indicated regions, and shading represents standard error among samples. (D) Heatmap of concordant differentially expressed and methylated genes. (E) Supervised heatmap of representative differentially expressed and methylated genes. (F) UCSC genome browser visualization of MeDIP-Seq peaks in DNMT3A-MT samples and DNMT3A-WT samples for the listed genes. Gene diagrams represent the position of TSS relative to displayed genomic regions. (G) Normalized cell growth for T8ML1 cells with indicated DNMT3A alterations. Symbols represent mean ± standard error, n = 3 independent experiments. (H-J) Representative histograms of (H) DNMT3A expression, (I) phosphorylation status of LCK (pY505) and SLP-76 (pY128) under normal culture conditions, and (J) expression of T-cell development transcription factors. Representative histograms and blots are taken from n = 3 independent experiments. TSS, transcriptional start site; TTS, transcriptional termination site; MT, mutant; EV, empty vector.
Figure 5.
Figure 5.
In vitro and ScRNA-Seq analysis of DNMT3A mutations in primary CD3+ T-cell cultures. (A, top) Representative Western blot of MYC-tagged DNMT3A. (A, bottom) Representative histogram of DNMT3A expression (MFI) and 5mC concentrations (MFI) in CD3+ T-cell cultures. (B) Representative flow cytometry plots for indicated cell types at listed time points. (C) Single-positive CD8+ T-cell percentages in vitro over indicated times in listed cell types (symbols represent mean ± standard error from n = 4 total donors covering n = 3 individual experiments) (D-E) UMAP (uniform manifold approximation and projection) plot of Seurat-identified clusters in CD3+ T-cell cultures. (E) Seurat-identified clusters annotated by SingleR for sample composition and immune cell identity. (F) Bar graph of the proportion of immune cell identities per sample as annotated by SingleR. (G) Violin plots of representative genes enriched in Seurat-identified clusters c0, c5, and c7. (H) Flow cytometry plots for listed cell types identifying CD8+ TCM and TEM cells. The gating strategy is shown graphically. Representative histograms, plots, and blots from (A-B) are taken from n = 3 independent experiments. Plots from H are from single-donor used for ScRNA-seq analysis. EV, empty vector; KD, knockdown; TCM, T-central memory; TEM, T-effector memory; Treg, regulatory T cell.

References

    1. Vose JM. Peripheral T-cell non-Hodgkin’s lymphoma. Hematol Oncol Clin North Am. 2008;22(5):997-1005. - PubMed
    1. Piccaluga PP, Tabanelli V, Pileri SA. Molecular genetics of peripheral T-cell lymphomas. Int J Hematol. 2014;99(3): 219-226. - PubMed
    1. Carson KR, Horwitz SM, Pinter-Brown LC, et al. . A prospective cohort study of patients with peripheral T-cell lymphoma in the United States. Cancer. 2017;123(7):1174-1183. - PMC - PubMed
    1. Hsi ED, Horwitz SM, Carson KR, et al. . Analysis of peripheral t-cell lymphoma diagnostic workup in the United States. Clin Lymphoma Myeloma Leuk. 2017;17(4):193-200. - PubMed
    1. Swerdlow SH, Campo E, Harris NL, eds et al.. WHO Classification of tumours of haematopoietic and lymphoid tissues. 4th ed, revised. Lyon, France: International Agency for Research on Cancer; 2017:2