. 2022 Sep 27;6(18):5494-5504.
doi: 10.1182/bloodadvances.2021006659.

High surface IgM levels associate with shorter response to ibrutinib and BTK bypass in patients with CLL

Affiliations

High surface IgM levels associate with shorter response to ibrutinib and BTK bypass in patients with CLL

Giorgia Chiodin et al. Blood Adv. .

Abstract

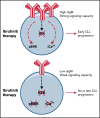
Chronic lymphocytic leukemia (CLL) cells have variably low surface IgM (sIgM) levels/signaling capacity, influenced by chronic antigen engagement at tissue sites. Within these low levels, CLL with relatively high sIgM (CLLhigh) progresses more rapidly than CLL with low sIgM (CLLlow). During ibrutinib therapy, surviving CLL cells redistribute into the peripheral blood and can recover sIgM expression. Return of CLL cells to tissue may eventually recur, where cells with high sIgM could promote tumor growth. We analyzed time to new treatment (TTNT) following ibrutinib in 70 patients with CLL (median follow-up of 66 months) and correlated it with pretreatment sIgM levels and signaling characteristics. Pretreatment sIgM levels correlated with signaling capacity, as measured by intracellular Ca2+ mobilization (iCa2+), in vitro (r = 0.70; P < .0001). High sIgM levels/signaling strongly correlated with short TTNT (P < .05), and 36% of patients with CLLhigh vs 8% of patients with CLLlow progressed to require a new treatment. In vitro, capacity of ibrutinib to inhibit sIgM-mediated signaling inversely correlated with pretherapy sIgM levels (r = -0.68; P = .01) or iCa2+ (r = -0.71; P = .009). In patients, sIgM-mediated iCa2+ and ERK phosphorylation levels were reduced by ibrutinib therapy but not abolished. The residual signaling capacity downstream of BTK was associated with high expression of sIgM, whereas it was minimal when sIgM expression was low (P < .05). These results suggested that high sIgM levels facilitated CLL cell resistance to ibrutinib in patients. The CLL cells, surviving in the periphery with high sIgM expression, include a dangerous fraction that is able to migrate to tissue and receive proliferative stimuli, which may require targeting by combined approaches.


Figures

None
Graphical abstract
Figure 1.
Figure 1.
High sIgM levels or signaling capacity associates with shorter TTNT following ibrutinib therapy. SIgM levels and signaling capacity were measured by flow cytometry before start of ibrutinib. (A) Patients with sIgM MFI > 50 (red line) and sIgM MFI < 50 (blue line) were investigated for time to progression requiring a new treatment from ibrutinib start (TTNT). (B) Patients with high sIgM iCa2+ (red line, >39% iCa2+ using ROC and Youden’s t test) and low signaling (blue line, <39% iCa2+) were also investigated for TTNT. The y-axis (%) indicates the cumulative proportion of patients surviving without having progressed to a new treatment need. Cumulative survival analysis was performed by Kaplan-Meier algorithm using log-rank statistics.
Figure 2.
Figure 2.
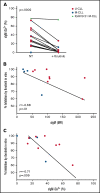
SIgM levels/signaling capacity inversely correlate with signaling inhibition by ibrutinib in vitro. CLL cells taken before ibrutinib therapy start were treated with 10 µM of ibrutinib in vitro (n = 13). Red symbols represent U-CLL; blue symbols represent M-CLL; the green triangle represents a IGHV3-21 M-CLL case. (A) SIgM-mediated iCa2+ mobilization was measured by flow cytometry. Non treated cells (NT) were incubated with DMSO as a control. (B-C) Correlation between percent signaling inhibition by ibrutinib in vitro and sIgM MFI (B) or sIgM signaling capacity (iCa2+ mobilization) (C) measured prior to ibrutinib treatment. Case 495 (IGHV3-21 M-CLL) was excluded from the graphs for better visualization of the correlation. Analysis and Spearman correlation were performed on all 13 cases.
Figure 3.
Figure 3.
Anti-IgM induced signaling is reduced during ibrutinib therapy. CLL cells taken before and at weeks 1, 4, and 12 of ibrutinib therapy were stimulated with anti-IgM, and signaling was measured by flow cytometry or immunoblotting. (A) Intracellular iCa2+ mobilization at different time points of therapy is shown as fold change relative to pretherapy (n = 15) (left). Pretherapy values were set to 1. Mean + SEM is shown. Representative plot showing reduced but maintained iCa2+ during ibrutinib in a patient with CLL with high sIgM levels (right). (B) pERK/ERK inducibility was measured as aIgM/basal pERK/ERK at each time point of therapy in 15 patients with CLL and is shown as fold change relative to pretherapy (pretherapy inducibility was set to 1) (left). Representative immunoblot showing persistence of ERK phosphorylation during therapy (right). P values at each time-point in both panels are relative to pretherapy values.
Figure 4.
Figure 4.
High sIgM expression before therapy associates with residual signaling capacity downstream of BTK during ibrutinib. Residual anti-IgM–induced signaling capacity was measured by flow cytometry (sIgM iCa2+) (A) and immunoblotting (pERK inducibility) (B) in a total of 18 patients with CLL. Levels of sIgM were determined before start of ibrutinib therapy. The statistical difference was calculated using the Mann-Whitney U-test.
Figure 5.
Figure 5.
Basal AKT phosphorylation increases during ibrutinib. AKT basal and induced phosphorylation at S473 was analyzed by immunoblotting before and during therapy in a total of 13 patients with CLL. (A-B) Fold change relative to pre-therapy is shown (basal or anti-IgM–induced pAKT/AKT pretherapy values were set to 1). Bars show mean ±SEM. P values were calculated using the Wilcoxon rank test. (C) Association between inducibility of pAKT and sIgM expression is shown. Levels of sIgM were determined before start of ibrutinib therapy. The statistical difference was calculated using the Mann-Whitney U-test.
Figure 6.
Figure 6.
SIgM levels are selectively increased in patients who progress after ibrutinib therapy. Expression of sIgM was measured before therapy and after ibrutinib therapy discontinuation (n = 13). SIgM levels are shown as fold change relative to pretherapy set to 1 (A) and as MFI values (B). Red lines/dots represent progressed patients. Blue lines/dots represent patients who did not progress. The dashed line in panel B represents the cutoff used in this series to discriminate CLL with high and low sIgM expression. The statistical difference was calculated using the Mann-Whitney U-test.

References

    1. Lam KP, Kühn R, Rajewsky K. In vivo ablation of surface immunoglobulin on mature B cells by inducible gene targeting results in rapid cell death. Cell. 1997;90(6):1073-1083. - PubMed
    1. Forconi F, Lanham SA, Chiodin G. Biological and clinical insight from analysis of the tumor b-cell receptor structure and function in chronic lymphocytic leukemia. Cancers (Basel). 2022;14(3):663. - PMC - PubMed
    1. Stevenson FK, Forconi F, Kipps TJ. Exploring the pathways to chronic lymphocytic leukemia. Blood. 2021;138(10):827-835. - PMC - PubMed
    1. Packham G, Krysov S, Allen A, et al. . The outcome of B-cell receptor signaling in chronic lymphocytic leukemia: proliferation or anergy. Haematologica. 2014;99(7):1138-1148. - PMC - PubMed
    1. Byrd JC, Furman RR, Coutre SE, et al. . Targeting BTK with ibrutinib in relapsed chronic lymphocytic leukemia. N Engl J Med. 2013;369(1):32-42. - PMC - PubMed

Publication types