. 2022 Aug 25;34(9):3400-3424.
doi: 10.1093/plcell/koac162.

The host exocyst complex is targeted by a conserved bacterial type-III effector that promotes virulence

Affiliations

The host exocyst complex is targeted by a conserved bacterial type-III effector that promotes virulence

Vassiliki A Michalopoulou et al. Plant Cell. .

Abstract

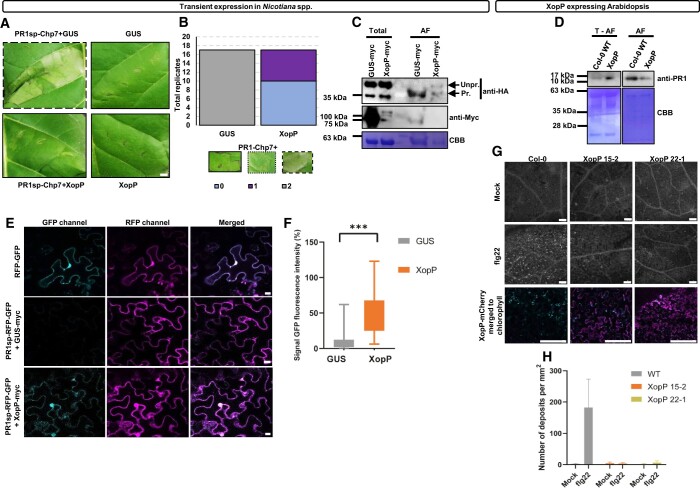
For most Gram-negative bacteria, pathogenicity largely depends on the type-III secretion system that delivers virulence effectors into eukaryotic host cells. The subcellular targets for the majority of these effectors remain unknown. Xanthomonas campestris, the causal agent of black rot disease of crucifers such as Brassica spp., radish, and turnip, delivers XopP, a highly conserved core-effector protein produced by X. campestris, which is essential for virulence. Here, we show that XopP inhibits the function of the host-plant exocyst complex by direct targeting of Exo70B, a subunit of the exocyst complex, which plays a significant role in plant immunity. XopP interferes with exocyst-dependent exocytosis and can do this without activating a plant NOD-like receptor that guards Exo70B in Arabidopsis. In this way, Xanthomonas efficiently inhibits the host's pathogen-associated molecular pattern (PAMP)-triggered immunity by blocking exocytosis of pathogenesis-related protein-1A, callose deposition, and localization of the FLAGELLIN SENSITIVE2 (FLS2) immune receptor to the plasma membrane, thus promoting successful infection. Inhibition of exocyst function without activating the related defenses represents an effective virulence strategy, indicating the ability of pathogens to adapt to host defenses by avoiding host immunity responses.


Figures

Figure 1
Figure 1
XopP targets an EXO70-like ID and EXO70B1, and the interaction is mediated by their N-termini. A, Y2H assays showed that XopP targeted an EXO70-like ID. All the yeast combinations tested here grew in –LW minimal medium, but only the EXO70B1-like ID/XopP combination survived in –LWA minimal medium. Additional Y2H results are presented in Supplemental Figure S1A. B, Interaction of EXO70B1 with the XopP effector in a Y2H assay. All yeast combinations grew in –LW minimal medium, but only the EXO70B1/effector combination survived in –LWA minimal medium, in contrast to EXO70A1 (both splice forms). Additional Y2H results and negative controls are presented in Supplemental Figure S1, B–D. C, Schematic representations of the EXO70-like ID, EXO70B1, and XopP truncation constructs. The green color shows that the homology of the ID to EXO70B1 begins at residue 277 and ends at residue 699. The gray color represents the EXO70 domain (residues 265–614), as identified using the biological database SMART. Bar = 100 residues. The results of the Y2H assays for each construct are shown at the right of each construct. Only the EXO70B1-AB truncation, which corresponds to the first 388 residues, interacted with full-length XopP (upper), as it was observed in SC–LWA medium. D, Interaction of the XopP N-terminal truncation with EXO70B1-AB. All yeast combinations grew in –LW minimum medium and only the combination of EXO70B1-AB/XopP-N terminal truncations survived in the –LWA minimum medium. As above, Y2H assay results are shown to the right of the constructs. E, SEC elution profiles for XopP (yellow), EXO70B1 (blue), and XopP/EXO70B1 complex (purple). A shift to the left (earlier elution) of the XopP/EXO70B1 complex was observed. F, In planta validation of the EXO70B1/XopP interaction using a BiFC assay in N. benthamiana plants. EXO70B1 and XopP were fused at their C-termini with nVENUS and cCFP epitope tags, respectively, and the YFP signal was observed in confocal microscopy 3 dpi (left column). A maximum projection of the z-stack is shown at the right. As negative control, the A. thaliana EXO70A1 homolog was used with XopP, and no YFP signal was observed (middle column). Bars = 15 μm. Protein expression of negative interactions of BiFC and additional negative controls for BiFC are presented in Supplemental Figure 1, E and F, respectively. G, In planta validation of the EXO70B1/XopP interaction in N. benthamiana plants using a co-IP assay. EXO70B1 and XopP were fused at their C-termini with HF (6xHis and 3xFLAG) and Myc epitope tags, respectively, and an IP-flag assay was performed. XopP interacted with EXO70B1 as shown in the immunoblot when probed with an a-myc. XopP is 86 kDa and EXO70B1-HF is 77 kDa. As a negative control for XopP, the AvrRps4 effector (17 kDa) was used (red asterisk) and its expression is shown using the anti-Flag antibody. A red asterisk denotes where XopP was expected if it coprecipitated with AvrRps4. Additional negative control for EXO70B1 is presented in Supplemental Figure S1G. a-Myc, anti-Myc antibody; AD, activation domain of Gal4; BD, binding domain of Gal4; EV, empty vector; SMART, Simple Modular Architecture Research Tool.
Figure 2
Figure 2
The EXO70B–XopP interaction is specific for EXO70B from dicots and Xcc and the E347 amino acid of EXO70B1 is essential for this interaction. A, Phylogenetic analysis of XopP homologs. XopP homologs were grouped in different clusters and share identity with XopP within a range from 99% to 25%. The homologs presented in bold were used for the interaction assays. B, EXO70B1 interacted specifically with XopP and not with other orthologs. In contrast, AtEXO70F1 interacted only with XocXopP1. Additional information regarding the expression of XopP homologs in S. cerevisiae is presented in Supplemental Figure S3A. C, Y2H assays using XopP and ObEXO70B_small and _long versions. Both versions of ObEXO70B failed to interact with the effector. Additional information regarding the expression of noninteractors in S. cerevisiae is presented in Supplemental Figure S3C. D, Y2H screenings of XopP with EXO70B1, EXO70B1E347K, ObEXO70B_small or ObEXO70B_smallK134E. The mutated ObEXO70B gains an interaction with the XopP effector, but AtEXO70B1E347K still interacted with the effector. The protein alignment for all the XopP interactors is presented in Supplemental Figure S3D.
Figure 3
Figure 3
XopP associates with three components of the exocyst sub-complex II and reduces the EXO70B1 and EXO84B protein levels. A, Diagram of interactions as determined by Y2H and BiFC assays. Shown are confirmed binary interactions of XopP and EXO70B1 with the other components of the exocyst complex of A. thaliana as well as the interactions between the components of SC-II, via Y2H (solid lines) and BiFC (dashed lines) interactions. First, EXO70B1 and XopP were cloned as baits and the other components of the exocyst complex were cloned as preys, and all possible interactions were tested. In addition, SEC15b was also cloned as bait and was transformed into S. cerevisiae in combination with SEC10a or EXO84b that were cloned as preys. All plasmids were transformed into either the PJ694a or the AH109 strain of S. cerevisiae. Solid lines represent Y2H interactions. Dashed lines represent the observed BiFC interactions. All possible interactions with EXO70B1 and XopP as baits were made and the absence of lines represents negative interactions. The only combinations that were not tested were XopP with SEC6, SEC8, and SEC15a. Additional verification of the interactions in planta via BiFC is presented and described in Supplemental Figure S4. B, EXO70B1 and XopP in planta localization and their co-localization in N. benthamiana leaves. EXO70B1 and XopP were fused C-terminally with YFP and mCherry fluorophore tags and each construct, as well as their combinations, were infiltrated into N. benthamiana leaves. EXO70B1 was localized not only at the PM but also into the nucleus. XopP had the same localization pattern as EXO70B1, but was found in the nuclear periphery instead of inside the nucleus. In co-localization of both proteins, their localization was not altered, but the EXO70B1–YFP fluorescence signal was significantly reduced. The confocal localizations were repeated three times with similar results. All parameters were the same for the two different conditions. Bars = 10 μm. Additional data are presented in Supplemental Figure S2F. C, Quantification of the protein levels of some representative components of the subcomplex I and subcomplex II of the exocyst, in the presence and absence of XopP. Nicotiana benthamiana leaves were infiltrated with A. tumefaciens GV3101 carrying any of SEC6-HF, SEC8-HF, SEC10a-HF, EXO70B1-HF, or EXO84b-HF in combination with XopP-myc or GUS-myc (as a negative control). Protein extractions were performed at 3 dpi, and immunoblotting with an anti-flag antibody showed reduced levels of EXO70B1 and EXO84b in the presence of XopP, but no reduced levels for the rest of the exocyst components. The quantifications were performed using Image J and the statistical analyses performed using multiple t tests. The P-value for EXO70B1 between mock and XopP was 9.4E-05 and P-value for EXO84B between mock and XopP was 0.00015. The experiment was repeated three times with similar results. Data in (C) show means 96.94 ± 3.76 for Sec6, 101.80 ± 2.27 for Sec8, 98.96 ± 1.04 for Sec10, 52.35 ± 2.01 for EXO70B1, and 55.29 ± 2.26 for EXO84B. The parameters of the statistical analysis are shown in Supplemental Data Set 3. A representative immunoblot is presented in the Supplemental Figure S5A. D and E, EXO70B1 localization in Arabidopsis leaves (D) and quantification of total protein levels (E). EXO70B1 tagged C-terminally with YFP for localization studies or tagged with HF for immunoblotting was co-infiltrated with XopP-myc in Arabidopsis leaves. The C-terminal region of XopP was used as a negative control. When the effector was present, EXO70B1-YFP fluorescence was reduced, as was the total level of EXO70B1-HF. A representative immunoblot is shown in Supplemental Figure S5B. The statistical analysis from three independent experiments was performed using paired parametric t test and P-value was 0.0022. Data in (E) show means 11.77 ± 7.21. The parameters of the statistical analysis are shown in Supplemental Data Set 3. Bars in (D) = 10 μm. SC-II, subcomplex II. **P < 0.005, ***P < 0.0005.
Figure 4
Figure 4
The downregulation of EXO70B1 levels caused by XopP effector is autophagy independent. A, Co-localization of EXO70B1 with the autophagosome marker Atg8a-mCherry in the presence and absence of XopP using the transient expression system in N. benthamiana leaves. Following treatment with 1-μM ConA, EXO70B1 tagged C-terminally with the YFP epitope tag did not co-localize with Atg8a-mCherry. The same results were obtained in the presence of XopP. Bars = 10 μm. Additional images are shown in Supplemental Figure S2, C and E. B, Quantification of EXO70B1 levels following treatment with the autophagy inhibitor, ConA. ConA treatment did not reveal any autophagy-dependent pathway of EXO70B1 downregulation caused by XopP. The quantification was performed using Image J software, and the samples were normalized by CBB staining of the PVDF membrane. The experiment was repeated four times with similar results. Data show means 43.92 ± 16.26 for XopP and 49.25 ± 14.98 for XopP+ConA. Statistical analysis was performed with paired parametric t test, and P-values were 0.0062 between GUS and XopP and 0.0076 between GUS and XopP+ConA. The parameters of the statistical analysis are shown in Supplemental Data Set 3. A representative immunoblot is shown in Supplemental Figure S6A. C, Localization of EXO70B1 in the presence or absence of XopP in transgenic atg9-3 Arabidopsis leaves stably expressing EXO70B1-YFP. The atg9-3+EXO70B1-YFP plants were infiltrated with XopP-myc or infiltration solution and images were taken 3 dpi via confocal microscopy. EXO70B1-YFP fluorescence decreased in the presence of the XopP effector. The experiment was repeated three times with similar results. Bars = 10 μm. A representative immunoblot is shown in Supplemental Figure S6B. The same experiment was also performed with transient expression of EXO70B1 in Arabidopsis and the results are shown in Supplemental Figure S6C. D, Quantification of the EXO70B1-YFP levels of atg9-3 Arabidopsis plants expressing EXO70B1-YFP in the absence (mock) and presence of XopP. The quantification was performed using Image J software, and the three experiments from Figure 4C are included in the analysis. Statistical analysis was performed with paired parametric t test and P-value was 0.0041. A representative immunoblot is shown in Supplemental Figure S6B. The parameters of the statistical analysis are shown in Supplemental Data Set 3. Data show means 34.27 ±7.30 in the case of XopP. A representative immunoblot from the transient expression of EXO70B1 in Arabidopsis is shown in Supplemental Figure S6D. **P < 0.005, ***P < 0.0005.
Figure 5
Figure 5
XopP inhibits the EXO70B1/SEC5a, EXO70B1/SEC15b, and SEC15b/SEC10a interactions in both Y3H and in planta assays. A, XopP interfered with EXO70B1/SEC5a, EXO70B1/SEC15b, and SEC15b/SEC10a associations in a Y3H analysis. The constructs were transformed into the Y3H-compatible yeast strain AH109. EXO70B1 interacted with SEC5a and SEC15b, and the latter associated with SEC10a, as shown by growth in medium lacking Leu, Trp, and Ade (SC–LWA). When Met was absent from the medium, XopP expression was induced by the MET25pro-inducible promoter and the above associations were inhibited, as shown in medium lacking Leu, Trp, Ade, and Met (SC–LWAM). B, Validation of XopP interference in exocyst components interactions, via FRET-SE. EXO70B1-YFP was co-infiltrated into N. benthamiana leaves with either SEC15b-mCherry or SEC5a-mCherry in the presence of the XopP-myc effector. As negative controls, AvrRps4-myc and/or GUS-myc were used. When XopP was present, the EXO70B1/SEC15b and EXO70B1/SEC5a interactions were inhibited. The images were taken 3 dpi via a Leica SP8 confocal laser microscopy. The box plots indicate the relative FRET efficiency (%). See the “Statistical analysis” section for a description of the symbols used. The significance test is Wilcoxon and the P-values are indicated. Data represent three independent experiments, each containing 70 measurements (n = 210 measurements). The parameters of the statistical analysis are shown in Supplemental Data Set 3. Visualization of representative images is presented in Supplemental Figure S7.
Figure 6
Figure 6
XopP targets EXO70B without activating its guarding NLR immune receptor, TN2. A, Expression in N. benthamiana leaves of BnTN2 fused C-terminally to the YFP epitope tag. Micrographs were obtained via confocal microscopy at 3 dpi. Bars = 10 μm. B and C, Transient co-expression of the NLR immune receptor BnTN2-YFP with EXO70B1-HF and XopP-myc in N. tabacum leaves (B) and quantification of the resulting HR (C). EXO70B1-HF suppressed the BnTN2-YFP-dependent HR induction when combined in a 1:1 ratio. In contrast, XopP-myc itself was not able to abolish the BnTN2-YFP-dependent HR induction at the 1:1 expression ratio. However, when combining all three constructs in a 1:1:1 ratio, no HR reaction was observed at 72 hpi. The experiment was repeated four times with identical results. The vertical axis shows the average number of plants from all four experiments that either produce or do not produce the HR. For the HR quantification, 10 plants were used for the statistical analysis (four independent experiments) and two-way ANOVA tests were performed. The P-value for interaction was <0.0001. Additional Y2H screenings and in planta experiments using TN2 are presented in Supplemental Figure S8. Bar = 1 cm.
Figure 7
Figure 7
Localization of the transmembrane immune receptor FLS2 localization to the PM is downregulated in the presence of XopP. A, The box plot shows the intensity of FLS2–GFP transient expression at the PM of N. benthamiana leaves, in the presence (XopP column) or absence (control column) of XopP-mCherry. See the “Statistical analysis” section for a description of the symbols used. The significance test used was Wilcoxon and the P-values are indicated. Data represent three independent experiments, each containing 77 measurements (n = 232 measurements). The parameters of the statistical analysis are shown in Supplemental Data Set 3. Representative images are presented in Supplemental Figure S9A. B, The box plot shows the intensity of FLS2–GFP expression at the PM of transgenic FLS2–GFP Arabidopsis plants that were infected with Pf0-1 EtHAn carrying either the full-length XopP (XopP column) or the C-terminal truncation of XopP (control column). The significance test used was Wilcoxon and the P-values are indicated. Data represent two independent experiments, each containing 95 measurements (n = 190 measurements). The parameters of the statistical analysis are shown in Supplemental Data Set 3. Representative images and positive control for Pf0-1 infections are presented in Supplemental Figure S9, B and C, respectively. C, Quantification of FLS2 PM localization in WT and XopP-E transgenic Arabidopsis plants. Fractionation was performed using WT plants and a T3 Arabidopsis line (22-1-4) expressing XopP-mCherry. The levels of FLS2 were reduced in XopP-E plants. Quantification was performed using Image J software, and the samples were normalized with the H+-ATPase expression levels. The phenotypes of T1 and T3 XopP-E transgenic Arabidopsis plants are shown in Supplemental Figure S9D. A representative immunoblot is presented in Supplemental Figure S9E. AU, absorbance units.
Figure 8
Figure 8
XopP inhibits both the exocytosis of PR1a and the deposition of callose. A and B, HR inhibition assay (A) and quantification (B). XopP inhibited the apoplastic HR induction by the chimeric protein PR1sp–Chp7. Inhibition of the HR (left lower lane) appeared 3 dpi in N. tabacum leaves. GUS protein was used as an HR negative control. The expression of GUS or XopP alone did not induce HR (right lanes). Data represent three independent experiments, each containing approximately five measurements (n = 17 measurements). Additional negative controls are presented in Supplemental Figure S10, A–D. For the quantification, the data are from four independent experiments, each containing approximately five measurements (n = 17). Representative images are shown along with the score, where 0 = no HR, 1 = medium HR, 2 = HR in all the area of the infiltrated leaf. The statistical analysis was made with two-way RM ANOVA (Interaction P <0.0001, Row factor P = 0.1221, and Column factor P >0.9999). The parameters of the statistical analysis are shown in Supplemental Data Set 3. Bar = 1 cm. C, Inhibition of the chimeric protein PR1sp–Chp7 secretion by XopP. PR1sp–Chp7–HA was co-expressed with GUS-myc or XopP-myc in N. benthamiana leaves. AF separation and total protein extraction were performed at 3 dpi. Immunoblot analysis with an anti-HA antibody showed that, in the presence of XopP, a significant portion of the chimeric protein PR1sp–Chp7 was not processed (Unpr.) as it was observed by the shift in molecular weight of the protein before the cleavage of PR1sp of the secreted PR1sp–Chp7 (Pr.). PR1sp–Chp7–HA (C) is 43 kDa, whereas Chp7–HA (A) is 38 kDa. Expression of XopP-myc (86 kDa) and GUS-myc (74 kDa) was shown using an anti-myc antibody. Staining of the PVDF membrane with CBB was used as loading control. D, Inhibition of PR1 secretion in XopP overexpressing transgenic Arabidopsis plants. Arabidopsis WT and XopP transgenic plants were infiltrated with 1-μM flg22 and after 12 h, AF separation was performed. The proteins of the rest of the leaves (Total − AF fraction) were also extracted. Immunoblot analysis using anti-PR1 antibody showed reduced PR1 secretion in XopP transgenic plants relative to WT Col-0 Arabidopsis. Staining of the PVDF membrane with CBB was used as loading control. PR1 is approximately 15 kDa. E and F, Expression (E) and quantification (F) of the chimeric protein PR1sp–RFP–GFP in the absence or presence of XopP. In the upper, the chimeric protein RFP–GFP (without being fused with the secretion peptide) was expressed in the cytoplasm. Fusion of the PR1sp to the N-terminus of the RFP–GFP chimera (PR1sp–RFP–GFP) resulted in exocytosis to the apoplast of the RFP–GFP. Only RFP was visualized (magenta) as the GFP (cyan) was quenched in the acidic environment of the apoplast. When XopP was expressed along with PR1sp–RFP–GFP, exocytosis of RFP–GFP exocytosis was inhibited, and it relocalized to the cytoplasm and nuclei, as both fluorescent proteins were detectable. The images were taken via confocal microscopy at 3 dpi of N. benthamiana leaves. Bars in (E) = 10 μm. The experiment was repeated four times with similar results. Quantification of GFP fluorescence intensity of PR1sp–RFP–GFP infiltrated with GUS or XopP in N. benthamiana plants was performed. Quantification was performed using Image J software, and statistical analysis was made with unpaired t test. Data in (F) show means 8.93 for GUS and 47.05 for XopP and the difference between means (XopP – GUS) ± sem is 38.12 ± 2.90 (n =110 measurements each). The measurement has been done from three different biological replicates. The P <0.0001. The parameters of the statistical analysis are shown in Supplemental Data Set 3. G and H, Visualization (D) and quantification (E) of callose deposition after PTI elicitation with 20-μm flg22 (middle lane) or mock solution (upper lane), in T1 lines of transgenic A. thaliana lines (15-2 and 22-1 lines) expressing XopP-mCherry. In the lower, XopP-mCherry expression (magenta) together with chlorophyll (cyan) was imaged via confocal microscopy, and it was in accordance with the levels of callose secretion. Bars in (G) = 15 μm. Quantification has been made using Image J software, and statistical analysis was made with ordinary two-way ANOVA (Interaction P <0.0001, Row factor P = 0.0001, and Column factor P <0.0001). Data in (H) show means 3.00 for WT mock, 182.30 for WT flg-22 treated, 4.50 for XopP 15-2 mock, 3.67 for XopP 15-2 flg22 treated, 1.75 for XopP 22-1 mock, and 6.33 for XopP 22-1 flg22 treated. The measurements are from two biological replicates. ***P < 0.0005.
Figure 9
Figure 9
Schematic abstract. This model shows how XopP manipulates the exocytosis via associating with members of the subcomplex II of the exocyst, most likely by affecting its proper assembly into a functional complex. In physiological conditions (green color), the components of the exocyst complex are recruited to subcomplexes and then to a holocomplex. Upon X. campestris infection (brown color), XopP is delivered into the cytoplasm along with the other effectors that are secreted. XopP manipulates the interactions between the exocyst components of the subcomplex II and the interaction between EXO70B1 and SEC5a, which belongs to subcomplex I. As a consequence, this affects the exocytosis process of different cargoes, such as PR1, FLS2, and possibly other unknown PRR receptors and callose deposition. The schematical abstract was created in BioRender.

Comment in

Similar articles

Cited by

References

    1. Adlung N, Prochaska H, Thieme S, Banik A, Blüher D, John P, Nagel O, Schulze S, Gantner J, Delker C, et al. (2016) Non-host resistance induced by the Xanthomonas effector XopQ is widespread within the genus Nicotiana and functionally depends on EDS1. Front Plant Sci 7: 1–16 - PMC - PubMed
    1. Ahmed SM, Nishida-Fukuda H, Li Y, McDonald WH, Gradinaru CC, Macara IG (2018) Exocyst dynamics during vesicle tethering and fusion. Nat Commun 9: 1–17 - PMC - PubMed
    1. An SQ, Potnis N, Dow M, Vorhölter FJ, He YQ, Becker A, Teper D, Li Y, Wang N, Bleris L, et al. (2020) Mechanistic insights into host adaptation, virulence and epidemiology of the phytopathogen Xanthomonas. FEMS Microbiol Rev 44: 1–32 - PMC - PubMed
    1. Azevedo C, Santos-Rosa MJ, Shirasu K (2001) The U-box protein family in plants. Trends Plant Sci 6: 354–358 - PubMed
    1. Badel JL, Shimizu R, Oh HS, Collmer A (2006) A Pseudomonas syringae pv. tomato avrE1/hopM1 mutant is severely reduced in growth and lesion formation in tomato. Mol Plant-Microbe Interact 19: 99–111 - PubMed

Publication types

Substances

LinkOut - more resources