. 2022 Jun 10;50(10):5577-5598.
doi: 10.1093/nar/gkac407.

Catchet-MS identifies IKZF1-targeting thalidomide analogues as novel HIV-1 latency reversal agents

Affiliations

Catchet-MS identifies IKZF1-targeting thalidomide analogues as novel HIV-1 latency reversal agents

Enrico Ne et al. Nucleic Acids Res. .

Abstract

A major pharmacological strategy toward HIV cure aims to reverse latency in infected cells as a first step leading to their elimination. While the unbiased identification of molecular targets physically associated with the latent HIV-1 provirus would be highly valuable to unravel the molecular determinants of HIV-1 transcriptional repression and latency reversal, due to technical limitations, this has been challenging. Here we use a dCas9 targeted chromatin and histone enrichment strategy coupled to mass spectrometry (Catchet-MS) to probe the differential protein composition of the latent and activated HIV-1 5'LTR. Catchet-MS identified known and novel latent 5'LTR-associated host factors. Among these, IKZF1 is a novel HIV-1 transcriptional repressor, required for Polycomb Repressive Complex 2 recruitment to the LTR. We find the clinically advanced thalidomide analogue iberdomide, and the FDA approved analogues lenalidomide and pomalidomide, to be novel LRAs. We demonstrate that, by targeting IKZF1 for degradation, these compounds reverse HIV-1 latency in CD4+ T-cells isolated from virally suppressed people living with HIV-1 and that they are able to synergize with other known LRAs.


Figures

Figure 1.
Figure 1.
dCas9 targeted chromatin and histone enrichment for mass spectrometry (Catchet-MS), a method to isolate and identify locus-bound protein complexes in vivo. (A) Schematic representation of the genomic organization of the integrated HIV-1 provirus in J-Lat 11.1 cells, encoding GFP and containing a frameshift mutation in env and a partial deletion of nef. The 5′ LTR region is further segmented into the U3, R, and U5 regions. Three strictly positioned nucleosomes, Nuc-0, Nuc-1 and Nuc-2, delimit the nucleosome-free regions HS1 and HS2, hypersensitive to nuclease digestion, as indicated. The HS2 region, to which the multiple epitope-tagged HA-V5-FLAG-dCas9 bait is guided, is indicated. The amplicons used to scan the chromatin region in ChIP-qPCR are shown. (B) Western blot analysis indicates expression of multiple epitope-tagged HA-V5-FLAG-dCas9 bait in modified J-Lat 11.1 cells using antibodies specific for Cas9, V5, FLAG and HA as indicated. Parental J-Lat 11.1 cell lysate is used as a negative control and α-Tubulin is used as a loading control. (C) ChIP-qPCR analysis with anti V5 epitope affinity beads indicate specific enrichment of the HA-V5-FLAG-dCas9 bait over the guided HIV-1 LTR region. White bars represent data generated in cells expressing the dCas9 bait together with a non-targeting gRNA (nt-gRNA), yellow bars represent data generated in cells expressing the bait and the single guide RNA targeting the HS2 region of the HIV-1 5′LTR (HS2-gRNA). Data show a representative experiment, error bars represent the standard deviation (±SD) of two separate real-time PCR measurements. HIV-1 5′LTR sequences recovery is calculated as a percentage of the input. (D) Flow cytometry histograms show the distribution of GFP positive cells in unstimulated and PMA stimulated control J-Lat 11.1 cells, cells expressing the dCas9 bait and a non-targeting gRNA (nt-gRNA) and cells expressing the bait and the HS2 targeting gRNA (HS2-gRNA). (E) ChIP-qPCR analysis with anti V5 epitope affinity beads in latent (-PMA; grey bars) and PMA treated cells (+PMA; green bars) expressing the dCas9 bait and the HS2-gRNA. Data are the mean of 2 independent experiments (±SD). HIV-1 5′LTR sequences recovery is calculated as a percentage of the input. (F) Schematic representation of the dCas9 bait cellular localization (left panel) and the Catchet-MS workflow (right panel). Approximately 3 billion cells per condition are cross-linked with formaldehyde to stabilize the protein-protein and protein DNA interaction. Following a stringent chromatin enrichment protocol, the cross-linked chromatin is isolated and fragmented by ultrasound sonication. The dCas9 containing complexes are immunoprecipitated using anti V5 antibody conjugated affinity beads, eluted from the beads, and used as input material for a second round of purification with anti-histones (H3, H2B) antibody-conjugated beads, in order to remove the non-chromatin bound fraction of the HA-V5-FLAG-dCas9 bait complexes and to enrich for the locus associated bait complexes. Immunoprecipitated material is finally decrosslinked, resolved on an SDS-page and prepared for mass spectrometry analysis. (G) (Left panel) ChIP-qPCR analysis with anti V5 epitope affinity beads in chromatin fraction prepared from unstimulated cells indicates specific enrichment of HA-V5-FLAG-dCas9 over the HIV-1 5′LTR. Data show a representative experiment, error bars represent the standard deviation (SD) of two separate real-time PCR measurements, HIV-1 5′LTR levels are calculated as percentages of the input. The V5 affinity-purified chromatin (represented in top panel) was eluted and used as input for a sequential immunoprecipitation with a mix of histone H2B and H3 conjugated affinity beads and the isolated material was analyzed by qPCR (Right panel). ChIP-qPCR with anti H3/H2B conjugated affinity beads indicates 5′LTR enrichment of HA-V5-FLAG-dCas9 bait after sequential V5/histone affinity purification.Data show a representative experiment, error bars represent the standard deviation (SD) of two separate real-time PCR measurements, HIV-1 5′LTR levels in both the V5 and histone affinity purification are calculated as percentages of the same original input. (H) Average coverage profiles using ChIP sequencing reads mapped 500 bp upstream and downstream of the peak center at the 5′LTR region of the HIV genome (‘Targets’) to the respective coverage around the predicted off targets (‘OffTargets’). ‘Start’ denotes the starting base pair of the aforementioned 1 kb region around the peak centers and ‘End’ the ending base pair respectively.
Figure 2.
Figure 2.
Cachet-MS identifies known and novel host factors associated with the latent and active HIV-1 promoter. (A) Heatmap displays the protein content at each step of the Catchet-MS purification pipeline. The colors represents the Log2 transformation of the protein intensities scores. Values corresponding to the V5 based immunopurification are adjusted to 100% as only a fraction (1:40) of the material that went into the second, histone based (H2B/H3) immunopurification, was analyzed by mass spectrometry. For the V5/histone experiment, 100% of the material was subjected to mass spectrometry. Missing values are represented by grey lines. The heatmap represents data from one Catchet-MS experiment, input material for the experiment corresponds to chromatin generated from a starting material of 3 billion cells per condition. (B) Bar plots showing the absolute HA-V5-FLAG-dCas9 bait abundance at each step of the purification pipeline. The absolute abundance was calculated based on protein/peptide spectral intensity values and adjusted to the fraction of material analyzed by mass spectrometry. The values are displayed in arbitrary units. (C) Bar plots showing the relative HA-V5-FLAG-dCas9 bait abundance at each step of the purification pipeline. The relative abundance was calculated based on protein/peptide spectral intensity values and normalized to the total protein content. The values are displayed in arbitrary units. (D) Filtering criteria applied to Catchet-MS data. Hits are filtered by comparison with the Crapome repository for contaminants of affinity purification experiments. as well as through GO categorization to select hits present in the cell nucleus and classified to be RNA bound, DNA bound or alternatively bound to histones, transcription factors or associated to chromatin. Colors represent the Log2 transformation of the protein relative abundance. The protein relative abundance was calculated based on protein/peptide spectral intensity values and normalized to the total protein content. Missing values are represented by grey lines. (E) Venn diagram graphically summarizing the overlap between the hits identified to be exclusively, or more abundantly, associated with the unstimulated state (−PMA) and the hits associated with the activated state (+PMA). (F) Selection and functional classification of hits associated with the unstimulated state and considered for a potential role in the maintenance of HIV-1 latency. The first columns of the table summarizes in a heatmap the log2 trasfomation of the protein relative abundance values in the unstimulated (–PMA) sample and the activated (+PMA) sample. Missing values are represented by grey lines. Candidates previously reported to restrict HIV-1 expression are referenced in the third column. Checkmarks indicate the hits functionally validated by shRNA mediated depletion experiments (Supplementary Figure S3). Colored boxes (yellow to dark green) summarize the effect of the target depletion on HIV- 1 expression and refers to the effects summarized in Supplementary Figure S3.
Figure 3.
Figure 3.
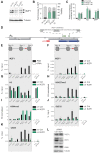
IKZF1, required for maintenance of HIV-1 latency, binds downstream of the latent HIV-1 5′LTR to promote PRC2/PRC1 recruitment and establish a repressive chromatin environment. (A) Western blotting for IKZF1 in J-lat 11 transduced with scramble shRNA (sh Control) and shIKZF1 #1 and #2 iondicates depletion of IKZF1. α-Tubulin is used as a loading control. (B) Bar plot showing the fold increase in % GFP positive cells (left y axes) measured by flow cytometry analysis, following IKZF1 depletion by lentiviral transduction in J-Lat 11.1 with two different shRNA constructs (#1 and #2). Data are the mean of three independent experiments (±SD). The right y axis represents the percentage of live cells. (C) qRT-PCR analysis measuring expression of HIV-1 genes (pol, GFP, tat) in J-lat 11 transduced with scramble shRNA (sh Control) and sh IKZF1 #1 and #2. Data, normalized to GAPDH are represented as fold enrichment over sh Control and are the mean of three independent experiments (±SEM). Statistical significance was calculated using a unpaired t test, *P < 0.05; **P < 0.01; ***P < 0.001. (D) Putative IKZF1 binding site (835–840) downstream of the HIV-1 5′-LTR in the proximity of the sequence targeted by the gRNA. The IKZF1 binding site is composed of a consensus sequence (TGGGAA/T) and at least one more extra core site (GGGA) in a 40 bp range (Li et al., 2011). (E) ChIP-qPCR analysis with IKZF1 antibody in latent cells and PMA stimulated J-Lat 11.1 cells as indicated. (F) ChIP qPCR analysis with IKZF1 antibody in J-Lat 11. 1 cells transduced with scramble shRNA (shControl) and shIKZF1. Data in (E) and (F) are presented as % input, error bars represent the standard deviation (SD) of two separate real-time PCR measurements. (G–I) ChIP-qPCR using antibodies specific for distinct histone marks in J-Lat 11. 1 cells transduced with scramble shRNA (shControl) and shIKZF1. Total histone H3 (G), H3K27me3 (H), H3K4me3 (I). Total histone H3 data (G) are represented as % input mean (±SD), histone marks data (H, I) are expressed as fold change over H3 signal (±SD). (J) ChIP-qPCR analysis with SUZ12 in J-Lat 11. 1 cells transduced with scramble shRNA (shControl) and shIKZF1. (K) ChIP-qPCR analysis with CBX8 in J-Lat 11. 1 cells transduced with scramble shRNA (shControl) and shIKZF1. Data in (J) and (K) are presented as % input, error bars represent the standard deviation (SD) of two separate real-time PCR measurements. The ChIP analysis presented (E–K) are a representative experiment, biological replicate experiments are shown in Supplementary Figure S8. (L) Western blotting for SUZ12, IKZF1, CBX in J-lat 11 transduced with scramble shRNA (sh Control) and shIKZF1. α-Tubulin is used as a loading control.
Figure 4.
Figure 4.
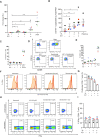
Targeting Targeting IKZF1 by iberdomide treatment reverses latency in primary CD4+ T cells obtained from cART suppressed HIV-1 infected patients with minimal effect on toxicity and effector function. (A) The latency reversal activity of iberdomide alone (10μM) and in combination with JQ1 (500nM) was tested, in primary human CD4+ T cells ex vivo infected to harbour latent HIV-1. The dot plot in panel A shows the fold increase in luciferase activity after treatment as indicated. Each dot represents a single measurement while the black horizontal lines represent the average fold increase for each treatment in the pool of donors. Experiments were performed in duplicate using cells obtained from 6 healthy donors. Statistical significance was determined by repeated measures one-way ANOVA on the log-transformed fold changes followed by Tukey's multiple comparison test: *P < 0.05, ** P < 0.01, *** P < 0.001, ****P < 0.0001. (B) Graph panel showing the average levels of unspliced cell-associated HIV-1 RNA in CD4+ T cells isolated from four HIV-1 infected, aviremic participants upon treatment with iberdomide (10 μM), JQ-1 (500 nM) or combination as measured by nested qPCR. PMA/Ionomycin was used as a positive control. CD4+ T cells were isolated from PBMCs from HIV-1 infected donors and treated as indicated for 24 h. S represents synergism, calculated by using the coefficient of drug interaction (CDI) method. Statistical significance was calculated using paired two-tailed t-test: *P < 0.05, ** P < 0.01. (C) Percentage of cells expressing the Annexin V marker of apoptosis in primary CD4+ T cells treated with iberdomide (10 μM), JQ-1 (500 nM) and the combination of both compounds for 24 h. Treatment with a toxic concentration of Gliotoxin (GTX) 200 nM was used as a positive control. Experiments were performed in uninfected cells obtained from five healthy donors, represented by the dots. (D) Representative flow cytometry plot of extracellular CD69 marker staining analysis in primary CD4+ T cells, upon treatment with iberdomide (10 μM), JQ-1 (500 nM) or a combination of both compounds for 24 h. CD69 expression was assessed by extracellular staining and analyzed by flow cytometry. (E) Percentage of cells expressing the CD69 marker of cell activation in primary CD4+ T cells from five healthy donors as described in (E). Treatment with PMA was used as a positive control. (F) Representative histogram of proliferative capacity of unstimulated or aCD3/CD28 stimulated CD8+ T cells in the presence or absence of LRAs. Cells were stained with a proliferation dye and analyzed 72 h later by flow cytometry. Dividing cells show decreased intensity of proliferation dye as it becomes diluted upon cell division. (G) Percentage of proliferated CD8+ T cells from three healthy donors as described in (G). (H) Representative flow cytometry plots of IFNg production analysis in unstimulated and stimulated primary CD8+ T cells after treatment with LRAs. Cells were treated as indicated for 18 h followed by PMA/Ionomycin (50 ng/1 μM) stimulation for 7 h in the presence of a protein transport inhibitor or remained unstimulated. IFN-g production was assessed by intracellular staining and analyzed by flow cytometry. Numbers in the plot show percentage of IL-2 producing cells. (I) Percentage of INFg producing CD8+ T cells from three healthy donors as described in (H).
Figure 5.
Figure 5.
FDA-approved thalidomide analogues pomalidomide and lenalidomide reactivate HIV-1 latency and synergizes with other LRAs in cells obtained from HIV-1 infected donors. (A) Representative FISH-Flow dot plots of CD4+ T cells from HIV-1 infected donors ex vivo treated with pomalidomide at 1 and 10 μM concentration for 24 h. (B) Graph panel showing the fold increase in vRNA+ cells/million in ex vivo treated CD4+ T cells from HIV-1 infected donors relative to Untreated control as measured by FISH-Flow (A). Cells were treated with pomalidomide or lenalidomide at the indicated concentrations for 24 hours and vRNA + production was analyzed by FISH-Flow. Error bars represent the mean and standard deviation of independent experiments. Statistical significance was calculated using paired Wilcoxon test: * P < 0.05, ** P < 0.01. (C, D) Changes in cell-associated unspliced HIV-1 RNA in CD4+ T cells isolated from HIV-1 infected donors after treatment with pomalidomide (C) and lenalidomide (D). CD4+ T cells were isolated from PBMCs from HIV-1 infected donors and treated as indicated for 24 h. Error bars represent the mean and the standard deviation. Statistical significance was calculated using paired two-tailed t test: * P < 0,05. (E, F) Percentage of INFg (E) and IL2 (F) producing CD8+ T cells from three healthy donors upon treatment with lenalidomide and pomalidomide as indicated. Cells were treated as indicated for 18 h followed by PMA/Ionomycin (50 ng/1 μM) stimulation for 7 h in the presence of a protein transport inhibitor or remained unstimulated. IFN-g and IL2 production was assessed by intracellular staining and analyzed by flow cytometry. Numbers in the plot show percentage of IFNg and IL2 producing cells. (G, H) Representative histogram of proliferative capacity of unstimulated or aCD3/CD28 stimulated CD8+ T cells in the presence or absence of pomalidomide (G) or lenalidomide (H). Cells were stained with a proliferation dye and analyzed 72 h later by flow cytometry. Dividing cells show decreased intensity of proliferation dye as it becomes diluted upon cell division. (I) Percentage of proliferated CD4+ T cells from three healthy donors in the presence of pomalidomide and lenalidomide as described in (G, H). (J) Synergistic reactivation of HIV-1 latency by lenalidomide in combination with Debio 1143 and Pyrimethamine in CD4+ T cells obtained from HIV-1 infected donors as measured by cell associated unspliced HIV-1 RNA. CD4+ T cells were isolated from PBMCs from HIV-1 infected donors and treated as indicated for 18–24 h. Error bars represent the mean and the standard deviation. Statistical significance was calculated using paired two-tailed t test: * P < 0,05, ** P < 0,01. S represents synergism, A represents additive effects calculated by using the coefficient of drug interaction (CDI) method.
Figure 6.
Figure 6.
Proposed model for Thalidomide analogues mediated HIV-1 latency reversal. Thalidomide analogues binds to CRBN, a subunit of the CRLCRBN E3 ubiquitin ligase complex that acts as a substrate adaptor. Thalidomide biding induces recruitment of IKZF1 and its ubiquitination by the ligase. In latently infected cells, ubiquitination of IKZF1 and its degradation by the proteasome results in a decrease in IKZF1 levels, impaired LTR recruitment of PRC2 and PRC1, leading to chromatin de-repression and latency reversal.

Similar articles

Cited by

References

    1. Siliciano J.M., Siliciano R.F.. The remarkable stability of the latent reservoir for HIV-1 in resting memory CD4+ T cells. J. Infect. Dis. 2015; 212:1345–1347. - PubMed
    1. Deeks S.G. HIV: shock and kill. Nature. 2012; 487:439–440. - PubMed
    1. Rafati H., Parra M., Hakre S., Moshkin Y., Verdin E., Mahmoudi T.. Repressive LTR nucleosome positioning by the BAF complex is required for HIV latency. PLoS Biol. 2011; 9:e1001206. - PMC - PubMed
    1. Ne E., Palstra R.J., Mahmoudi T.. Transcription: insights from the HIV-1 promoter. Int. Rev. Cell Mol. Biol. 2018; 335:191–243. - PubMed
    1. Pereira L.A., Bentley K., Peeters A., Churchill M.J., Deacon N.J.. A compilation of cellular transcription factor interactions with the HIV-1 LTR promoter. Nucleic Acids Res. 2000; 28:663–668. - PMC - PubMed

Publication types