. 2022 Jun 10;50(10):5726-5738.
doi: 10.1093/nar/gkac445.

Twisting DNA by salt

Affiliations

Twisting DNA by salt

Sergio Cruz-León et al. Nucleic Acids Res. .

Abstract

The structure and properties of DNA depend on the environment, in particular the ion atmosphere. Here, we investigate how DNA twist -one of the central properties of DNA- changes with concentration and identity of the surrounding ions. To resolve how cations influence the twist, we combine single-molecule magnetic tweezer experiments and extensive all-atom molecular dynamics simulations. Two interconnected trends are observed for monovalent alkali and divalent alkaline earth cations. First, DNA twist increases monotonously with increasing concentration for all ions investigated. Second, for a given salt concentration, DNA twist strongly depends on cation identity. At 100 mM concentration, DNA twist increases as Na+ < K+ < Rb+ < Ba2+ < Li+ ≈ Cs+ < Sr2+ < Mg2+ < Ca2+. Our molecular dynamics simulations reveal that preferential binding of the cations to the DNA backbone or the nucleobases has opposing effects on DNA twist and provides the microscopic explanation of the observed ion specificity. However, the simulations also reveal shortcomings of existing force field parameters for Cs+ and Sr2+. The comprehensive view gained from our combined approach provides a foundation for understanding and predicting cation-induced structural changes both in nature and in DNA nanotechnology.


Figures

Graphical Abstract
Graphical Abstract
Magnetic tweezers experiments and molecular dynamics simulations reveal the salt dependence of DNA twist.
Figure 1.
Figure 1.
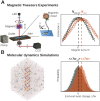
Magnetic tweezers and molecular dynamics simulations reveal the salt dependence of DNA twist. (A) Schematic of the magnetic tweezer set up with a flow cell that enables buffer exchange. The inset shows a DNA molecule tethered between the flow cell surface and a magnetic bead. Changes in DNA twist are experimentally determined from shifts in the maximum of extension versus applied turns curves (symbols) that are fitted by Gaussian functions (solid lines). (B) Snapshot of an MD simulation showing the DNA, solvent, and the ionic atmosphere. Computationally, changes in twist are evaluated from shifts in the mean of the end-to-end twist. The data are for 100 mM KCl (the reference condition, black) and 1000 mM KCl (orange).
Figure 2.
Figure 2.
Magnetic tweezers measurements of the effect of salt on DNA twist. (A) DNA extension vs. rotation curves for alkali chloride ions at concentrations of 50, 100, 250, 500 and 1000 mM (light to dark data points). (B) DNA extension vs. rotation curves for alkaline earth chloride salts at 1, 2, 5, 10 25, 50 and 100 mM (light to dark data points). Zero ΔLk (vertical dashed lines) corresponds to the point where the DNA is torsionally relaxed in 100 mM KCl. (C, D) Change in DNA twist with ion type and concentration for mono- and divalent metal cations. Symbols and error bars are the mean and standard deviations from at least seven independent measurements. Data are with respect to 100 mM KCl. Lines are fits to a power-law model (Equation 1; see main text).
Figure 3.
Figure 3.
MD simulations reveal changes of DNA conformation with increasing Na+ and K+ concentration. (A) Quantitative comparison of DNA twist obtained from MT experiments (open symbols) and MD simulations (filled symbols) as a function of the ion concentration. Changes of the characteristic DNA properties as a function of the ion concentration: helix length h (B), radius r (C), crookedness β, (D), sugar pucker P (E). All parameters are reported relative to 100 mM KCl. Error bars correspond to standard errors obtained from block averaging. Dashed lines correspond to the fitting with the square root of concentration dependence. All fit parameters are listed in the Supporting Information.
Figure 4.
Figure 4.
Origin of ion-specific effects on DNA twist for monovalent ions. (A) Quantitative comparison of change in DNA twist obtained from MT experiments (open bars) and MD simulations (filled bars) for 250 mM LiCl, NaCl, KCl, and CsCl with respect to 100 mM of KCl. Changes of the characteristic DNA properties for different monovalent cations: DNA helical length h (B), radius r (C), crookedness β (D), sugar pucker P (E). All results are relative to 100 mM KCl. Errors correspond to standard errors obtained from block averaging. (F) three-dimensional ion distributions obtained with gromaρs (64) and projected on the DNA surface. (G–J) Radial concentration profiles for 100–1000 mM bulk salt concentration.
Figure 5.
Figure 5.
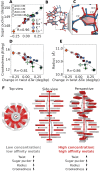
Mechanistic model for the changes of DNA structure with monovalent ion concentration and ion type. (A, D, E) Correlation between change in twist and sugar pucker angle (A), change in twist and crookedness (D), and change in twist and radius (E), for different ion concentrations and ion types. The reported value of R corresponds to the Pearson correlation coefficient. (BC) Representative snapshots of two conformations with low (blue) and high sugar pucker (red). A moderate increase in the sugar pucker angle (from P = 147° to P = 157°) modifies the position of the phosphate group leading to a decrease in local radius (r = 12.3 Å to r = 9.7 Å), and crookedness (β = 14.53° to β = 6.28°), and an increase in twist (Tw = 33.3° to Tw = 35.1°) between the base pairs depicted in (B). (F) Simplified mechanistic picture: High monovalent salt concentrations and ions with high backbone affinity increase sugar pucker, and twist and decrease the radius, and crookedness (red structure). Low salt concentrations and ion with intermediate backbone and nucleobase affinity decrease sugar pucker, and twist and increase the radius, and crookedness (gray structure).
Figure 6.
Figure 6.
The effect of divalent metal cations on DNA twist. (A) Quantitative comparison of DNA twist obtained from MT experiments (open bars) and MD simulations (filled bars) for 50 mM MgCl2, CaCl2, SrCl2 and BaCl2. Data are with respect to 100 mM KCl and error bars correspond to standard errors obtained from block averaging. (B) Comparison of DNA structure obtained from simulations with bulk-optimized (61) (gray) or affinity-optimized (42) Ca2 + (red) force fields. (C) Spurious backbone bridging by Ca2+ ions with bulk-optimized force fields and undistorted structure with affinity-optimized force fields (D). (E) Simulation snapshot DNA structure with Sr2+ and formation of a backbone bridging (F) and a water-mediated backbone bridge (G).

References

    1. Friedberg E.C. DNA damage and repair. Nature. 2003; 421:436–440. - PubMed
    1. Bloomfield V.A. DNA condensation. Curr. Opin. Struct. Biol. 1996; 6:334–341. - PubMed
    1. Liu L.F., Wang J.C.. Supercoiling of the DNA template during transcription. Proc. Natl. Acad. Sci. U.S.A. 1987; 84:7024–7027. - PMC - PubMed
    1. Bustamante C., Bryant Z., Smith S.B.. Ten years of tension: single-molecule DNA mechanics. Nature. 2003; 421:423–427. - PubMed
    1. Lipfert J., van Oene M.M., Lee M., Pedaci F., Dekker N.H.. Torque spectroscopy for the study of rotary motion in biological systems. Chem. Rev. 2015; 115:1449–1474. - PubMed

Publication types