. 2022 Jul 1;163(7):bqac081.
doi: 10.1210/endocr/bqac081.

Small Molecule-mediated Insulin Hypersecretion Induces Transient ER Stress Response and Loss of Beta Cell Function

Affiliations

Small Molecule-mediated Insulin Hypersecretion Induces Transient ER Stress Response and Loss of Beta Cell Function

Karina Rodrigues-Dos-Santos et al. Endocrinology. .

Abstract

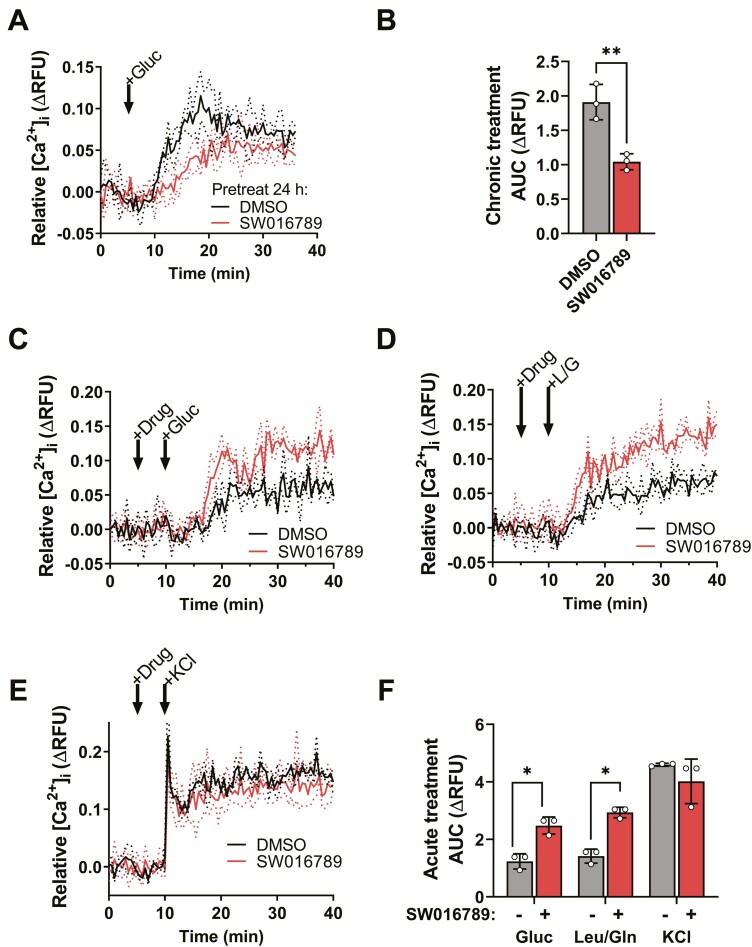
Pancreatic islet beta cells require a fine-tuned endoplasmic reticulum (ER) stress response for normal function; abnormal ER stress contributes to diabetes pathogenesis. Here, we identified a small molecule, SW016789, with time-dependent effects on beta cell ER stress and function. Acute treatment with SW016789 potentiated nutrient-induced calcium influx and insulin secretion, while chronic exposure to SW016789 transiently induced ER stress and shut down secretory function in a reversible manner. Distinct from the effects of thapsigargin, SW016789 did not affect beta cell viability or apoptosis, potentially due to a rapid induction of adaptive genes, weak signaling through the eIF2α kinase PERK, and lack of oxidative stress gene Txnip induction. We determined that SW016789 acted upstream of voltage-dependent calcium channels (VDCCs) and potentiated nutrient- but not KCl-stimulated calcium influx. Measurements of metabolomics, oxygen consumption rate, and G protein-coupled receptor signaling did not explain the potentiating effects of SW016789. In chemical cotreatment experiments, we discovered synergy between SW016789 and activators of protein kinase C and VDCCs, suggesting involvement of these pathways in the mechanism of action. Finally, chronically elevated calcium influx was required for the inhibitory impact of SW016789, as blockade of VDCCs protected human islets and MIN6 beta cells from hypersecretion-induced dysfunction. We conclude that beta cells undergoing this type of pharmacological hypersecretion have the capacity to suppress their function to mitigate ER stress and avoid apoptosis. These results have the potential to uncover beta cell ER stress mitigation factors and add support to beta cell rest strategies to preserve function.

Keywords: endoplasmic reticulum stress; insulin secretion; pancreatic islet beta cells.


Figures

Figure 1.
Figure 1.
Discovery of SW016789 as a small molecule chronic suppressor of insulin secretion. (A) High-throughput screening workflow leading to the discovery of SW016789. Screening was performed on an 8320-compound diversity subset representing the chemical space of the full compound library at the UT Southwestern Medical Center High-Throughput Screening Core. Cells were treated with control and test compounds for 24 hours in normal medium followed by a washout and stimulation with glucose and KCl in the presence of diazoxide and finally subjected to InsGLuc assays. These maximal stimulatory conditions afforded the assay a large dynamic range (average Z-score > 0.5) and resulted in 168 primary hits, which after structural clustering were narrowed down to 82, of which 32 confirmed in triplicate. (B) Concentration response curve testing to determine EC50 of SW016789 InsGLuc-MIN6 after a 24-hour exposure. Data are the mean ± SD of 3 independent assays. (C and D) In mouse InsGLuc-MIN6 beta cells (C) and human islets (D), 24-hour exposure to SW016789 (5 µM) resulted in suppression of glucose-stimulated insulin secretion during assays in the absence of compound. Data are the mean ± SD of 3 or 4 independent experiments. (G-I) Exposure of MIN6 beta cells to dimethyl sulfoxide (DMSO; 0.1%) or SW016789 (5 µM) for up to 72 hours did not alter relative amounts of (G) live cells, (H) dead cells, or (I) the live/dead cell ratio. Digitonin (Dgt) treatment was a positive control for cell death added just prior to the assay. (J) InsGLuc-MIN6 cells were exposed to SW016789 (5 µM) for 24 to 72 hours followed by a 1-hour washout in glucose-free Krebs-Ringer bicarbonate HEPES buffer. Cells were then stimulated for 1 hour with the indicated treatments (0G, glucose-free; 20G, glucose 20 mM; Fsk, forskolin 10 µM; 3-isobutyl-1-methylxanthine 100 µM; PMA, phorbol myristate acetate 100 nM). *P < 0.05 vs respective Basal; †P < 0.05 vs respective DMSO. (K) InsGLuc-MIN6 cells were exposed to SW016789 (5 µM) for 24 hours followed by a 48-hour washout in complete medium. Cells were then assayed for glucose-stimulated InsGLuc secretion. All data are the mean ± SD of at least 3 independent experiments. *P < 0.05 by 2-way analysis of variance.
Figure 2.
Figure 2.
Time-course studies and phenotypic assays reveal SW016789 as an acute potentiator of nutrient-stimulated insulin secretion. (A) InsGLuc-MIN6 cells were treated with SW016789 (5 µM) in a time course as indicated in the diagram. At the end of the time course, glucose-stimulated InsGLuc secretion was assayed. Data are the mean ± SD of n = 4. (B) InsGLuc-MIN6 cells were exposed to SW016789 (5 µM) for 1 hour during stimulation with glucose (20 mM), leucine (5 mM), or leucine/glutamine (Leu/Gln; 5 mM each) or (C) in the presence of diazoxide (250 µM) with or without KCl (35 mM) or glucose (20 mM). Data are the mean ± SD of n = 3. *P < 0.05 by 2-way analysis of variance.
Figure 3.
Figure 3.
SW016789 treatment modulates nutrient-stimulated Ca2+ influx. (A) MIN6 beta cells pretreated 24 hours with SW016789 (5 µM) or dimethyl sulfoxide (DMSO; 0.1%) followed by washout prior to glucose-stimulated Ca2+ influx assays and (B) area under the curve (AUC) calculation. *P < 0.05 by unpaired Student’s t-test. (C-F) MIN6 beta cells acutely treated with SW016789 (5 µM) or DMSO (0.1%) followed by (C) glucose-, (D) leucine/glutamine-, or (E) KCl-stimulated Ca2+ influx assays and (F) associated AUCs. Data are the mean ± SD of 3 independent experiments. *P < 0.05 by 2-way analysis of variance.
Figure 4.
Figure 4.
SW016789 does not impact oxygen consumption rate or canonical glycolysis and tricarboxylic acid (TCA) cycle metabolites in MIN6 beta cells. (A) Experimental design for targeted metabolomics in MIN6 cells preincubated in glucose-free Krebs-Ringer bicarbonate HEPES (KRBH) for 2 hours and then treated with or without glucose (0 vs 20 mM) in the presence of dimethyl sulfoxide (DMSO; 0.1%; DMSO_0G and DMSO_20G) or SW016789 (5 µM; SW_0G and SW_20G). (B) KRBH supernatants were collected for insulin enzyme-linked immunosorbent assay to verify that SW016789 potentiated insulin secretion under these conditions. (C) Metabolomic data are represented as the log2 fold-change with respect to DMSO_0G of 3 independent experiments. (D) Representative metabolites showing glucose induced changes in glycolysis (glucose 6-phosphate, fructose-1,6-bisphosphate), TCA cycle (citrate, α-ketoglutarate, and malate), amino acids (cysteine, lysine), adenosine monophosphate, and redox potential [reduced glutathione (GSH)/oxidized glutathione (GSSG)] in MIN6 cells. (E-G) MIN6 beta cells were subjected to Seahorse analysis. Cells were preincubated in glucose-free KRBH and (E) oxygen consumption rate, (F) extracellular acidification rate, and (G) calculated Seahorse parameters were measured during stimulation with glucose (20 mM) (G20) in the presence or absence of SW016789 (5 µM) or DMSO (0.1%). Subsequently all cells were sequentially stimulated with oligomycin (oligo), carbonyl cyanide-4 (trifluoromethoxy) phenylhydrazone (FCCP), and antimycin A (AntA). Data represent the mean ± SD of 3 independent experiments.
Figure 5.
Figure 5.
SW016789 transiently induces the unfolded protein response (UPRER). (A) MIN6 beta cells were treated with dimethyl sulfoxide (DMSO; 0.1%), SW016789 (5 µM), or thapsigargin (100 nM) in complete medium for 0 to 24 hours as indicated. (B-D) Compound additions were staggered to allow simultaneous sample harvesting. Expression of (B) immediate early genes and (C) adaptive and maladaptive UPRER genes are shown. (D) Expression of Ins1/2 in the time course and (E) insulin content. All data are the mean ± SD of 3 independent experiments. *P < 0.05 vs DMSO.
Figure 6.
Figure 6.
SW016789 and thapsigargin have distinct effects on UPRER-related proteins. (A) MIN6 beta cells were treated with SW016789 (5 µM) or thapsigargin (500 nM) for either 6 or 24 hours in complete medium, and lysates were immunoblotted. Thapsigargin (Tg), but not SW016789, induced proapoptotic markers CHOP and cleaved-PARP (cl-PARP). Alterations in UPRER markers pS51-eIF2α, pT980-PERK, and BiP are shown. (B) SW016789 and Tg increased the stress-induced transcription factors ATF4 and ATF3. Data are the mean ± SD of 3 independent experiments. (C) Beta cell transcription factors Pdx1 and MafA were not significantly affected by either drug. Data are the mean ± SD of 2 or 3 independent experiments. In all immunoblots either actin or glyceraldehyde 3-phosphate dehydrogenase (GAPDH) were used as loading controls. *P < 0.05 by 2-way analysis of variance.
Figure 7.
Figure 7.
SW016789 acutely synergizes with activators of protein kinase C and voltage-dependent calcium channels (VDCCs) to induce secretion. (A) InsGLuc-MIN6 cells were treated 24 hours with either dimethyl sulfoxide (DMSO; 0.1%) or phorbol 12-myristate 13-acetate (PMA; 100 nM) in complete medium. Cells were then washed and preincubated in glucose-free Krebs-Ringer bicarbonate HEPES for 1 hour prior to stimulation with SW016789 (5 µM), PMA (100 nM), or both in the presence or absence of glucose (20 mM) for 1 hour. Afterward, buffer was collected for InsGLuc assays. Data are the mean ± SD of 8 independent experiments. *P < 0.05 by 2-way analysis of variance. (B) InsGLuc-MIN6 cells were treated for 24 hours with DMSO or the VDCC activator FPL64176 followed by glucose-stimulated InsGLuc secretion assay in the absence of compounds. Data are the mean ± SD of 4 independent experiments. *P < 0.05 basal vs glucose. (C) InsGLuc-MIN6 cells were acutely treated for 1 hour with DMSO, FPL64176, or FPL64176 + SW016789 in the presence or absence of glucose. Data are the mean ± SD of 4 independent experiments. *P < 0.05 vs DMSO. (D) Normal glucose-stimulated Ca2+ can be observed with glucose and DMSO (peach) and is enhanced by SW016789 (red). FPL64176 rapidly potentiates glucose-stimulated Ca2+ influx in MIN6 cells (green). In the absence of glucose, DMSO (black), FPL64176 (grey), and SW016789 (blue) have little effect individually, but together FPL64176 and SW016789 synergize to stimulate Ca2+ influx (pink). Data are the mean ± SD of 3 independent experiments.
Figure 8.
Figure 8.
Chemical suppressor screen uncovers voltage-dependent calcium channel inhibitors as protective agents in chronic SW016789 treatment in MIN6 beta cells and human islets. (A) InsGLuc-MIN6 cells were coincubated with SW016789 (5 µM) and candidate small molecules as indicated. Following a 24-hour incubation, all treatments were removed, and glucose-stimulated InsGLuc secretion responses were assessed. (B) InsGLuc-MIN6 cells pretreated in complete medium for 24 hours with dimethyl sulfoxide (DMSO; 0.1%) or SW016789 (5 µM) in the presence or absence of nifedipine (10 µM). After compound washout cells were stimulated with or without glucose (20 mM) for 1 hour for InsGLuc assays. Data are the mean ± SD of 5 independent experiments. (C) Cells were treated as in (B), and Ddit3 gene expression was measured. Data are the mean ± SD of 4 independent experiments. (D) InsGLuc-MIN6 cells were acutely incubated with DMSO (0.1%), nifedipine (10µM), SW016789 (5µM), or nifedipine + SW016789 for 1 hour in the presence or absence of glucose (20 mM). Data are the mean ± SD of 4 independent experiments. (E) Human islets were treated 24 hours in complete medium with DMSO (0.1%) and SW016789 (5 µM) in the presence or absence of nifedipine (10 µM). Islets were washed and incubated in low glucose (1 mM) Krebs-Ringer bicarbonate HEPES (KRBH) for 1 hour, buffer discarded, then incubated 1 hour in low (1 mM) or high (16 mM) glucose KRBH for 1 hour. Data represent the mean ± SD of insulin measured in supernatant normalized to total insulin content from 6 different donor islet preparations. *P < 0.05 by 2-way analysis of variance.

Similar articles

Cited by

References

    1. Alejandro EU, Gregg B, Blandino-Rosano M, Cras-Meneur C, Bernal-Mizrachi E. Natural history of beta-cell adaptation and failure in type 2 diabetes. Mol Aspects Med. 2015;42:19-41. Doi: 10.1016/j.mam.2014.12.002 - DOI - PMC - PubMed
    1. Berger C, Zdzieblo D. Glucose transporters in pancreatic islets. Pflugers Arch. 2020;472(9):1249-1272. Doi: 10.1007/s00424-020-02383-4 - DOI - PMC - PubMed
    1. Rorsman P, Ashcroft FM. Pancreatic beta-cell electrical activity and insulin secretion: of mice and men. Physiol Rev. 2018;98(1):117-214. Doi: 10.1152/physrev.00008.2017 - DOI - PMC - PubMed
    1. Lewandowski SL, Cardone RL, Foster HR, et al. . Pyruvate kinase controls signal strength in the insulin secretory pathway. Cell Metab. 2020;32(5):736-750.e5. Doi: 10.1016/j.cmet.2020.10.007 - DOI - PMC - PubMed
    1. Nicholls DG. The pancreatic beta-cell: a bioenergetic perspective. Physiol Rev. 2016;96(4):1385-1 447. Doi: 10.1152/physrev.00009.2016 - DOI - PubMed

Publication types